
Abstract
The entorhinal–hippocampus network plays a central role in navigation and episodic memory formation. To investigate these interactions, we examined the effect of medial entorhinal cortex lesions on hippocampal place cell activity. Since the medial entorhinal cortex is suggested to play a role in the processing of self-motion information, we hypothesised that such processing would be necessary for maintaining stable place fields in the absence of environmental cues. Place cells were recorded as medial entorhinal cortex–lesioned rats explored a circular arena during five 16-min sessions comprising a baseline session with all sensory inputs available followed by four sessions during which environmental (i.e. visual, olfactory, tactile) cues were progressively reduced to the point that animals could rely exclusively on self-motion cues to maintain stable place fields. We found that place field stability and a number of place cell firing properties were affected by medial entorhinal cortex lesions in the baseline session. When rats were forced to rely exclusively on self-motion cues, within-session place field stability was dramatically decreased in medial entorhinal cortex rats relative to SHAM rats. These results support a major role of the medial entorhinal cortex in processing self-motion cues, with this information being conveyed to the hippocampus to help anchor and maintain a stable spatial representation during movement.
Introduction
A considerable amount of data indicates that the entorhinal–hippocampus network plays an essential role in spatial navigation and episodic memory in both animals and human (Burgess et al., 2002; Buzsáki and Moser, 2013; Lipton and Eichenbaum, 2008; Sugar and Moser, 2019). This network is characterised by unique anatomical connectivity and neural firing properties. Anatomically, the entorhinal cortex is subdivided into two distinct regions, the medial entorhinal cortex (MEC) and the lateral entorhinal cortex (LEC) which both receive multi-modal sensory inputs (Canto et al., 2008; Sewards and Sewards, 2003). The MEC receives inputs preferentially from posterior associative areas involved in visual spatial processing (visual, parietal and retrosplenial cortices) but also receives projections from the perirhinal and postrhinal cortices. The LEC receives its strongest input from anterior regions of the brain, mainly the piriform and insular cortices. Other important sources of input to the LEC are the perirhinal and prefrontal cortices. The outputs of the MEC and LEC are conveyed to the hippocampal formation, through the medial and lateral perforant pathways, respectively, to the dentate gyrus, CA3 and CA1 hippocampal subfields (Burwell, 2000; Burwell and Amaral, 1998a, 1998b; Dolorfo and Amaral, 1998; Furtak et al., 2007; Insausti et al., 1997; Kerr et al., 2007; Van Strien et al., 2009).
The hippocampus and the MEC contain various populations of spatially selective neurons. In contrast, LEC neurons show little spatial modulation (Hargreaves et al., 2005; Yoganarasimha et al., 2011). In the hippocampus, place cells, which show location-specific firing (Muller and Kubie, 1987; O’Keefe and Dostrovsky, 1971), have been suggested to underlie an allocentric representation of space (O’Keefe and Nadel, 1978). In the MEC, there are distinct functionally specialised categories of neurons including grid cells, conjunctive head × grid cells, head-direction cells, speed cells and border cells (Hafting et al., 2005; Kropff et al., 2015; Sargolini et al., 2006; Solstad et al., 2008; Taube, 1998; see Grieves and Jeffery, 2017 for a review). Among those neurons, grid cells which are characterised by multiple, regularly spaced firing fields covering the whole environment are suggested to underlie a movement-based representation of space (McNaughton et al., 2006).
If there is no doubt that the hippocampus and the MEC have a close anatomical relationship, how they interact with respect to their function in spatial cognition and episodic memory remains poorly known. One approach for addressing this issue has been to examine the effect of inactivating MEC on hippocampal place cell firing. Inactivation of the MEC did not abolish nor dramatically disrupted the spatially selective properties of individual place cell (Hales et al., 2014; Miao et al., 2015; Schlesiger et al., 2018). They nevertheless altered their remapping characteristics (Miao et al., 2015; Rueckemann et al., 2016; see however Schlesiger et al., 2018) and the temporal organisation of theta-related hippocampal firing patterns (Chenani et al., 2019; Schlesiger et al., 2015).
It is generally hypothesised that the MEC underlies a movement-based (or idiothetic) representation of space that would be associated at the hippocampal level with landmark (or allothetic) information (McNaughton et al., 2006). Accordingly, we should expect that MEC inactivation would have a greater impact on place cells when the animals must rely on self-movement to navigate the environment. This possibility, however, has never been investigated. In the present study, we examined the effect of N-methyl-d-aspartate (NMDA) lesions of the MEC on place cell firing when allothetic cues, comprising visual, olfactory, auditory and tactile cues were progressively removed, thus requiring the animal to use idiothetic cues to maintain a stable place cell representation.
Materials and methods
Subjects
A total of nine adult male Long Evans rats (Janvier, Le Genest-St-Isles, France) weighing between 300 and 350 g at the time of surgery were used for the experiment. The rats were housed in individual cages in a temperature- and humidity-controlled colony room that was kept on a 12:12 h light:dark cycle. One week after arrival, animals were handled daily by the experimenter for 5 days. All rats were then submitted to a progressive food deprivation schedule to maintain 85% of their free-feeding weight and trained to forage for 20-mg food pellets in an open field. Following training, surgery for lesion and electrode implantation was made. Rats were assigned to MEC lesion (n = 4) or SHAM-lesioned (n = 5) groups. All procedures complied with both European (directive 2010/63/EU of the European Parliament and of the Council) and French (AGRG1238767A) institutional guidelines, permission # 13.24 from Ministère de l’agriculture et de la pêche to ES.
Apparatus
The recording apparatus was a dark grey cylinder with a grey floor (50-cm high, 100-cm diameter), visually isolated from the rest of the laboratory by a black cylindrical curtain (250-cm diameter). The apparatus was illuminated by indirect light provided by four 25-W bulbs placed on the ceiling in a 60 × 60-cm square arrangement. During all phases of the study, a radio tuned to an FM station was fixed to the ceiling in a central position relative to the cylinder, producing background music >70 dB to mask uncontrolled directional sounds. A food dispenser located above the platform dropped 20-mg pellets at random locations on the apparatus floor when activated. Three distinct objects were used as intramaze cues: a grey glass bottle (29-cm high), a black plastic cylinder (21-cm high) and a black wooden cone (20-cm high). Their locations were fixed relative to each other. Each object was placed against the wall of the cylinder, and their arrangement formed an isosceles triangle (Van Cauter et al., 2013). The computer, the monitoring and the recording set-up were located in a room adjacent to the room containing the cylinder.
Microdrives and recording set-up
Recordings were made using a microdrive containing four tetrodes. A tetrode was composed of four twisted 25-μm nichrome wires. The four tetrodes formed a bundle threaded through a piece of stainless steel tubing. Each wire was attached to a pin on the outside of a rectangular Mill-max connector. The tubing was attached to the centre pin of the connector and served as the animal’s ground as well as a guide for microwires. The connector, tubing and wires could be moved down by turning drive screw assemblies cemented to the skull. Before surgery, the wire tips were gold-plated to reduce their impedance to 200–400 kΩ. Screening and recordings were performed with a counterbalanced cable attached at one end to a commutator that allowed the rat to move freely. The other end of the cable was connected to the rat headstage, which contained a field effect transistor amplifier for each wire. The signals from each tetrode wire were further amplified 10,000 times, bandpass-filtered between 0.3 and 6 kHz with Neuralynx amplifiers (Neuralynx, Bozeman, MT, USA), digitised (32 kHz) and stored by DataWave Sciworks acquisition system (DataWave Technologies, Longmont, CO, USA). Two light-emitting diodes (LEDs), one red and one green, separated by 5 cm and attached to the headstage assembly provided the position and the orientation of the rat’s head. It is generally assumed that rats are red-light blind (above 620 nm) due to the lack of red-light sensitive opsin (Rocha et al., 2016). The green LED which was located at the rear of the animal’s head could have been a source of visible light however. To attenuate this potential source of illumination, we lowered its intensity to make it as dim as possible while maintaining optimal tracking of the animal. It is therefore unlikely that the rat could use this source of light to perceive remote environmental features. The LEDs were imaged with a CCD camera fixed to the ceiling above the maze, and their position was tracked at 50 Hz with a digital spot-follower.
Surgery
Lesions and electrode implantation were performed during a single surgery. Rats were deeply anesthetised by an i.m. injection of xylazine (15 mg/kg, Rompun, Bayer, France) and ketamine (100 mg/kg, Imalgène, Merial, France) and placed in a Kopf stereotaxic apparatus (Kopf instrument, Tujunga, CA, USA).
Bilateral excitotoxic lesions of the MEC were made by injections of NMDA (20 mg/mL, Sigma–Aldrich, Saint-Quentin Fallavier, France) dissolved in phosphate-buffered saline (pH: 7.4; 0.12 M) via a stainless steel cannula (25 gauge) and tubing connected to a 10-μL Hamilton syringe and an automatic pump (rate: 0.05 μL/min). The stereotaxic coordinates of the six injection sites (three in each hemisphere) and the corresponding NMDA volume injected were anteroposterior (AP): 7.5 mm, mediolateral (ML): ±4.6 mm, 0.20-µL NMDA; AP: 8.2 mm, ML: ±4.7 mm, 0.35-µL NMDA; and AP: 8.8 mm, ML: ±4.8 mm, 0.25-µL NMDA (Paxinos and Watson, 2004). The dorsoventral (DV) coordinate was established by lowering the cannula very slowly until its tip touched the calvarium and then raised 1 mm (Parron and Save, 2004). The cannula stayed in place for an additional 120 s after the NMDA volume was delivered. SHAM lesions were obtained by administering equal volumes of phosphate-buffered saline to the same injection sites. Animals were then implanted with a bundle of four tetrodes aimed at the hippocampus at the following coordinates: AP: −3.8 mm, ML: ±3 mm and DV: 1.5 mm (Duvelle et al., 2019). Post-surgery treatment involved a subcutaneous injection of an antibiotic (Clamoxyl, 0.05 mL) and an analgesic (tolfédine, 0.04 mL). The animals were allowed to recover for 10 days before neuron screening started. When implanted, the electrodes and the cannula could be moved down in the brain by screwing the screws into the nylon cuffs (⅛ screw turn moves the electrodes 50 µm).
Histology
At the completion of the experiment, rats received an overdose of pentobarbital (Dolethal 10 mL/kg) and were perfused intracardially with 0.9% saline followed by 4% formaldehyde. The brains were removed, stored for 1 day in formaldehyde, followed by a 30% sucrose solution, and finally frozen with dry ice. Thirty-micrometre-thick sagittal sections were mounted on glass slides and stained with cresyl violet. The extension of the lesion and the position of the tip of the electrodes were determined from digital pictures, acquired with a Leica Microscope (Wetzlar, Germany), and imported in an image manipulation program (Gimp 2.8, distributed under General Public License).
Experimental procedure
Our purpose was to examine whether MEC lesions affect place field properties after removal of external cues. We recorded place cells during a sequence of five successive 16-min sessions in which sensory cues were progressively suppressed or made irrelevant in order to increase the influence of movement-related cues on place cell activity. For that purpose, the animals were screened daily for single-unit activity. Baseline was made during recording Session 1 in the experimental arena. Tetrodes were lowered 50 μm if no single-unit activity was found or after a complete recording sequence. When a set of units was isolated, the sequence of five 16-min recording sessions proceeded as follows (Figure 1(a)):
Session 1 (S1, baseline): The arena was lit and contained three objects. Rats were placed in the arena facing a random direction. For 16 min, the animals moved freely, foraging for food pellets dispensed by a food dispenser.
Session 2 (S2): The room lights were turned off to eliminate visual cues, and the cylinder floor and wall were cleaned to neutralise olfactory cues. The objects were still available.
Session 3 (S3): Objects were removed, but olfactory cues from S2 were still present (no cleaning).
Session 4 (S4): The floor and wall were cleaned. During this session, no reliable allothetic cues (visual, object, olfactory) were available and the animals had to use idiothetic information to navigate.
Importantly, animals were never removed from the arena between S1 and S4.
Session 5 (S5): This session was similar to S1 in order to examine whether the baseline firing pattern could be reinstated when all cues were again made available. Animals were removed from the arena, the room light was switched on, the arena cleaned, and the three objects put back in place.

(a) Protocol for recording hippocampal place cells in freely moving rats. The top panel shows the schematic of the five 16-min sessions (S1–S5) showing the light (white) and dark (grey) sessions, the position of the three objects, and sessions in which the floor and walls were cleaned (sponge). The bottom panel shows the available external information (+: present, −: absent). From S1 to S4, the light, objects and odours were progressively removed to increase the influence of self-motion information. S5 is similar to S1. (b) Reconstruction of lesion extent (red) in the medial entorhinal cortex of the four rats. (c) Cresyl violet–stained coronal sections from the brains of representative rats superimposed to Paxinos and Watson figures showing lesions of the medial entorhinal cortex. MEC: medial entorhinal cortex; LEC: lateral entorhinal cortex; PaS: parasubiculum. (d) Cresyl violet–stained coronal sections showing the recording locations in the hippocampus.
Data analysis
Behaviour
We calculated the distance travelled by the animal during S1, and the running speed (duration of the recording session divided by the distance travelled). We evaluated general object exploration by calculating the mean time that an animal’s head was present in a 10-cm diameter circular area centred on each object. We also analysed specific object exploration. To characterise the rats’ behaviour in more detail, we distinguished two behaviours: ‘exploration’ and ‘passes’, both of which consisted of interaction with the objects within the 10-cm area. For each trajectory through this area, we calculated the angular head movement score, the duration of the trajectory and the animal’s speed. The angular movement score was the sum of the absolute deviation of angular head movements. Animal speed was the distance of the trajectory in the area divided by its duration. An exploration event was defined by low speed locomotion (running speed below 4 cm/s during at least 1 s spent in the object zone) and an angular movement score above 50. During an exploration event, the rat was probably engaged in active object exploration. We analysed the time spent in object exploration and the number of exploration events. Passes were defined by higher speed locomotion (running speed above 6 cm/s and at most 1 s spent in the object zone) and angular movement score below 50. Thus, passes were straight trajectories close to the object, presumably providing dynamic tactile input through whisker contact. In darkness, contact with the objects through these passes may be frequently used by the animals and perhaps even more so by MEC rats. We analysed the number of passes.
We also examined the distribution of object exploration between different objects to see if it was uniform or if there was a preference for a particular object. We calculated the time difference between the most explored object and the least explored object for each session.
Spike sorting
Spike sorting was performed manually using the graphical cluster-cutting software Offline Sorter (Plexon). Units selected for analysis had to have well-discriminated clusters with spiking activity clearly dissociated from background noise. Units that were lost before the recording session was completed, or whose waveforms changed too much between two sessions, were not used for further analysis. Units having interspike intervals (ISI) <2 ms (refractory period) were removed due to poor isolation, as were cells with a peak firing rate ⩽1 Hz. To prevent repeated recordings of the same cell over several days, clusters that recurred on the same tetrodes in the same cluster space across recording sessions were analysed on the first day only. Quality of unit isolation was assessed by computing the L-ratio and the isolation distance on MATLAB custom-made codes following Schmitzer-Torbert et al. (2005) procedures. There was no difference between SHAM and MEC for these two measures (t-tests, L-ratio: t(107) = 1.66, n.s.; isolation distance, t(107) = 0.09, n.s.). We can therefore exclude the possibility that any observed change was due to poor cluster isolation. Overall, a total of 422 cell clusters for SHAM animals and 256 cell clusters for MEC animals were accepted.
Spatial rate maps
Spatial rate maps were generated by dividing the arena into an array of 40 × 40 square bins, each 2.5 × 2.5 cm in size. The number of spikes per bin was divided by the time spent in that bin to provide a firing rate (Hz). Smoothed firing rate maps were then generated using a boxcar procedure in which the firing rate in each bin was replaced by the mean rate of that bin plus the immediately surrounding bins. The firing rate of the cell was colour-coded from low (light blue) to high (dark red). Pixels that were not visited by the rat were displayed in white.
Place cell selection
Cells were considered as place cells if a set of at least nine contiguous pixels of the non-smoothed rate map had a firing rate above the mean firing rate (averaged over the arena) in the baseline session. This specific activity is considered to be the place field of the cell. Among the 678 cell clusters, 78 for SHAM and 31 for MEC groups were classified as place cells in S1. Among them, 70 for SHAM and 24 for MEC were recorded during five complete recording sessions (i.e. a recording sequence).
Waveforms
In Session 1 baseline, we calculated the average spike waveform for each place cell. Then, we extracted the spike height (µV) as the difference between the maximum amplitude and the minimum amplitude of the waveform, and the peak-to-trough duration (µs) as the difference between the time at maximum amplitude and the time at minimum amplitude of the waveform.
We also examined place cell burst properties using the method reported in Chen et al. (2009). First, we extracted each animal’s pass in the firing field for each place cell (to avoid false long ISI when the animal is outside the firing field). We determined the mean value of the ISIn from all passes according to the following formula

Then, we constructed a new ISI sequence L(n) which could be extracted from the original ISIn sequence. If the ISIn < mean, it was included in the L(n) sequence. We calculated the mean of L(n), ML, which was used as a parameter to define bursts. ML is an auto-adaptive parameter derived from measured spike trains. We then calculated the burst duration as the sum of the ISI within a burst, the number of spikes (N) and the burst ISI as the average of the ISI within a burst. Finally, we calculated the average burst duration, the average number of spikes in a burst and the average ISI for each place cell.
Because the spike amplitude of place cells was found to be lower in MEC rats than in SHAM rats (see Results’ ‘Effects of MEC lesions on place cell firing in baseline condition (S1)’ section), we examined whether this decrease was specific to place cells or applied to all other hippocampal neurons that we recorded (including pyramidal cells and interneurons). For that, we calculated the waveform characteristics of all recorded cells, place cells not included, in S1 and found that there was no difference between place cells and other recorded cells in spike amplitude (t-tests, SHAM, t(420) = 0.387, n.s.; MEC, t(242) = 1.146, n.s.) or peak-to-trough duration (t-tests, SHAM, t(420) = 0.567, n.s.; MEC, t(242) = 1.593, n.s.) for both SHAM and MEC groups. As a result, the decrease in spike amplitude in MEC rats (t-tests, SHAM vs MEC, t(555) = 8.011, p < 0.001) and the lack of difference in peak-to-trough duration (t-tests, SHAM vs MEC, t(555) = 0.656, n.s.) were similar in non-place cells as in place cells (see ‘Results’).
Spatial firing analysis
To analyse the effects of both MEC lesions and cue manipulations on place cell firing properties, we calculated the field firing peak (Hz) as the pixel within the field with maximum firing, the field size (cm2), the spatial coherence and the spatial information for each place cell. Spatial coherence consists of spatial autocorrelation of the non-smoothed place field map and measures the extent to which the firing rate in a particular bin is predicted by the average rate of the eight surrounding bins. The spatial information content is expressed in bits per spike and is calculated as follows

where λi is the mean firing rate in bin i, λ is the overall mean firing rate and Pi is the occupancy probability of bin i. In short, the spatial information content index can be seen as a measure of the amount of information relative to the location of the animal conveyed by a single action potential emitted by a single place cell.
Because we observed higher running speed in MEC animals (see Results’ ‘Behaviour’ section), we examined whether speed influenced place cell properties. For that, we calculated instantaneous speed from which we extracted position samples, for a speed below 15 cm/s, similar to the speed range found in SHAM rats in S1, and for a speed above 15 cm/s. Then, we constructed the rate maps and computed place cells properties as previously described.
Spatial correlation
To analyse the stability of place cell activity, we calculated the within-session correlation. For that, we divided each of the five sessions into two equal time recording periods and we constructed the two corresponding spatial rate maps. Then, we calculated the Pearson product-moment correlation coefficient between these two spatial rate maps. We also computed the between-session correlation using the second half of a session and the first half of the following session. Z-transformed correlation values were compared using a repeated measures analysis of variance (ANOVA).
Overdispersion
Overdispersion was measured as described by Fenton and Muller (1998). Passes through the firing field were defined as the time series of positions starting when the LED was detected inside the place field and ending when the LED was detected outside the field. To enhance the reliability of firing rate estimates, passes were taken into account only if they met the following two criteria: (1) each pass had to last at least 1 s; (2) the pass had to go through the field centre. The observed number of spikes fired during a pass was compared with the number of spikes predicted from the session-averaged positional firing rate distribution. The predicted activity during a pass depends only on the specific pixels visited and the time spent in those pixels without regard to the sequence of positions. For a given pass, the expected number of spikes is given by

where ri is the time-averaged firing rate at position i in the pass through the field, and ti the time spent in location i during the pass. According to the Poisson assumption, the standard deviation of the expected numbers of spikes is equal to

Therefore, if Z ⩾−1.96 or ⩽+1.96, the probability that the observed number of spikes is consistent with the model is inferior or equal to 0.05. Overdispersion was then measured as the variance of the distribution of Z values computed for a set of passes.
Statistics
No statistical methods were used to predetermine sample sizes, but our sample sizes are similar to those reported for place cells in previous studies. Statistical tests included Levene’s tests for equality of variances. A normality test (Lilliefors) was applied to all data sets. If a normal distribution was observed, either one-factor ANOVA, two-factor ANOVA or ANOVA with repeated measures were used with post hoc Newman–Keuls test for pairwise comparisons. T-tests were also used for specific pairwise comparisons. If the data were not normally distributed, the Mann–Whitney U test for independent samples was used, and the Wilcoxon signed-rank test was used for paired samples. A chi-square test compared proportion of place cells. All Pearson’s correlation values had undergone a Fisher Z-transformation before statistical testing. Statistical significance was set at p < 0.05. P > 0.05 is indicated as n.s. (non-significant).
Results
Histology
Figure 1(b) shows a series of coronal sections (adapted from Paxinos and Watson) showing the extent of MEC damage for the four rats (Figure 1(c) for photographs of MEC lesions). Rat 1, rat 3 and rat 4 had almost complete bilateral lesions of the MEC which extended over the caudal–medial portion of the entorhinal cortex (CEnt) and the middle part (MEnt), while rat 2 had partial lesions of the MEC at CEnt. In all rats, the lesions therefore affected the caudal–medial entorhinal cortex in its most dorsal and medial parts. The LEC (LEnt) was only partially damaged at its limit with the MEnt for rat 2 and rat 4, and not at all for rat 1 and rat 3. In all rats, collateral damage was limited to a small portion of the dorsal parasubiculum. Figure 1(d) shows an example of the track of the tetrode bundle implanted in the dorsal hippocampus for place cell recording.
Behaviour
We examined whether MEC lesions modified spontaneous behaviour in baseline session (S1) and whether initial cue manipulation in S2 (lights were switched off) induced alteration of behaviour in SHAM and MEC groups. As shown in Figure 2(a), MEC rats ran at higher speed than SHAM rats in both S1 and S2 (repeated measure ANOVA, group effect, F(1,63) = 52.44, p < 0.001; session effect, F(1,63) = 6.48, p < 0.05; no group × session interaction, F(1,63) = 0.66, n.s.; post hoc Newman–Keuls, SHAM vs MEC, S1 and S2: p < 0.001).

Behaviour during S1 and S2. (a) Running speed of SHAM (red) and MEC (blue) rats during S1 and S2. Duration (b) and number of object exploration events (c) and number of passes through the object areas (d) for SHAM and MEC. (e) Difference in exploration time between the most explored and the least explored object in SHAM and MEC rats. (f) Representative examples of colour-coded spatial maps showing exploration time from black (minimum time) to yellow (maximum time) for SHAM rats. Animals spend maximum time near a specific object. (g) Colour-coded exploration time maps for two MEC rats. Time exploration is distributed all around the arena or equally near the three objects. SHAM versus MEC, post hoc Newman–Keuls ***p < 0.001, **p < 0.01 and *p < 0.05; Mann–Whitney U test ###p < 0.001 and #p < 0.05.
The duration and number of exploration events during the baseline session (S1) and when the light were off (S2) are shown in Figure 2(b) and (c). In S1, the time spent near the object was not different between SHAM and MEC rats (Mann–Whitney U test, S1: U = 558, p = 0.15; S2: U = 760, p = 0.16). However, MEC rats spent a greater time exploring the objects in S2 relative to S1 (Wilcoxon signed-rank test, S1 vs S2, Z = 2.35, p < 0.05) whereas there was no difference in SHAM rats (Wilcoxon signed-rank test, S1 vs S2, Z = 1.11, p = 0.27). SHAM rats exhibited a higher number of exploration events than MEC rats (Figure 2(c), repeated measures ANOVA, group effect, F(1,63) = 10.95, p < 0.001, post hoc Newman–Keuls, S1 and S2: p < 0.01). However, both groups increased their number of exploration events in darkness (session effect, F(1,63) = 10.95, p < 0.01; no group × session interaction, F(1,63) = 0.09, n.s., post hoc Newman–Keuls, S1 vs S2, SHAM and MEC: p < 0.05). The number of passes through the object areas was not modulated by cue (S1 vs S2) or lesion (SHAM vs MEC) conditions (Figure 2(d); repeated measures ANOVA, no group effect, F(1,63) = 1.43, n.s.; no session effect, F(1,63) = 0.67, n.s.; no group × session interaction, F(1,63) = 1.95, n.s.).
We also examined whether animals had uniform exploration time of each object or exhibited a preference for one of the three objects. We found that MEC animals explored the three objects more uniformly than SHAM rats in the two sessions (Figure 2(e); Mann–Whitney U test, SHAM vs MEC, S1: U = 107.50, p < 0.001; S2: U = 285.00, p < 0.05). As shown in Figure 2(f), SHAM rats focused their activity more on one of the objects than MEC rats. When lights were off, this characteristic was diminished in SHAM rats (but remained higher than in MEC rats) (Wilcoxon signed-rank test, S1 vs S2, SHAM: Z = 2.11, p < 0.05; MEC: Z = 1.72, p = 0.09).
Altogether, the results show that MEC lesions induced modification of spontaneous behaviour and object exploration. MEC rats ran with higher speed than SHAM rats. In S1, MEC rats had a lower number of exploration events than SHAM rats although the time spent exploring the objects was not different. Suppression of visual information in S2 led to an increase in time spent in object exploration in MEC rats but not in SHAM rats.
Effects of MEC lesions on place cell firing in baseline condition (S1)
During the baseline session, 256 cells were recorded from 4 MEC-lesioned animals in 20 sessions and 422 cells from 5 SHAM animals in 45 sessions. Of these neurons, 31 met the criteria for active place cells in MEC rats and 78 in SHAM rats. The number of recorded neurons is shown in Table 1.
Summary of the cell distribution for MEC-lesioned and SHAM rats.

MEC: medial entorhinal cortex.
We observed a lower proportion of place cells in MEC rats (13%) than in SHAM rats (21%) (χ2 (1) = 4.8, p < 0.05). The basic firing parameters of place cells in MEC and SHAM rats are displayed in Table 2. No difference between MEC and SHAM rats was found in terms of infield mean firing rate (MEC = 2.3 ± 0.4 Hz, SHAM = 1.8 ± 0.1 Hz, t-test, t(107) = 1.28, n.s.) and infield peak firing rate (MEC = 5.6 ± 2.2 Hz, SHAM = 3.2 ± 0.3 Hz, t-test, t(107) = 1.73, n.s). However, place cell firing in MEC rats was characterised by lower spatial coherence (MEC = 0.15 ± 0.02, SHAM = 0.36 ± 0.02, t-test, t(107) = 6.6, p < 0.001) and marginally significant lower information content (MEC = 1.49 ± 0.09, SHAM = 1.88 ± 0.08, Mann–Whitney U test, U = 931, p = 0.062), suggesting altered location-specific firing. We also observed larger field size in MEC animals (MEC = 750 ± 54 cm2, SHAM = 413 ± 37 cm2, t-test, t(107) = 4.91, p < 0.001).
Electrophysiological properties and spatial characteristics of place cells in MEC-lesioned and SHAM rats.

MEC: medial entorhinal cortex; IC: information content.
Averages are given ± SEM.
t-test: ***p < 0.001, **p < 0.01; Levene’s test: °°°p < 0.001.
Because MEC animals exhibited higher running speed, we examined whether place cell properties were modulated by speed per se. Most spiking and spatial firing parameters were not affected by speed (t-tests, speed < 15 cm/s vs speed > 15 cm/s, spike amplitude, peak-to-trough duration, infield firing rate, infield peak firing rate, spatial coherence, within-session correlation, field size, all ps > 0.05, n.s.). Only the information content was increased for running speed >15 cm/s (t(60) = 2.83, p < 0.01). Firing variability (overdispersion) was greater in MEC rats than in SHAM rats (SHAM, σ2 = 5.61, MEC, σ2 = 8.29, one-factor ANOVA, F(1,921) = 11.63, p < 0.0001) indicating decreased reliability of place cell firing in the place field. In addition to spatial firing alteration, place cell action potentials in MEC animals had lower amplitude (MEC = 172 ± 7 µV, SHAM = 226 ± 8 µV, t-test, t(107) = 4.25, p < 0.001) but no modification of peak-to-trough spike duration was observed (MEC = 316 ± 20 µs, SHAM = 335 ± 7 µs, t-test, t(107) = 1.09, n.s.). Lower ISI in bursts (mean ISI in bursts, SHAM: 44.19 ± 2.83 ms, MEC: 33.41 ± 3.53 ms, t-test: t(107) = 2.15, p = 0.034) in MEC rats may account for diminished spike amplitude. Note that the number of spikes in bursts and the duration of bursts also decreased in MEC rats (t-tests, number of spikes in burst, SHAM: 4.96 ± 0.16, MEC: 3.78 ± 0.18, t(107) = 4.17, p < 0.001; burst duration, SHAM: 214.32 ± 14.97 ms, MEC: 130.26 ± 16.71, t(107) = 3.23, p < 0.01).
Examples of rate maps in the baseline session and the following session are displayed in Figure 3. We evaluated place field stability by calculating within-session spatial correlations. Place cells were less stable in MEC rats than in SHAM rats (Pearson correlation coefficient: SHAM = 0.59 ± 0.02, MEC = 0.33 ± 0.05, Mann–Whitney U test, U = 556.5, p < 0.001).

(a) and (b) Spatial firing patterns of four representative place cells in (a) SHAM and (b) MEC rats during the five recording sessions (top row). Each example shows the rat trajectory (first row, in grey) with spike locations (red dots), and the colour-coded rate map is from 0 Hz (second row, blue) to the peak rate (red) displayed at the bottom right. Firing rates below 1 Hz are displayed in red.
Effects of MEC lesions on place cell firing during cue manipulation sessions
Cue removal (S1–S2 and S2–S4)
Figure 4(a)–(g) shows the time-course of the firing characteristics and rate map correlations for the two groups during the five sessions including all cue manipulations. Following the baseline session, the rats were recorded during three consecutive 16-min sessions during which they were not removed from the arena. The transition from one session to the next was separated by a cue manipulation so that, from S2 to S4, the available allothetic sensory cues were progressively removed or made irrelevant in order to increase importance of idiothetic cues. We recorded 70 place cells in 41 recording sequences in SHAM rats and 24 place cells in 17 recording sequences in MEC animals.

Firing properties of place cells for each session. Only the place cells recorded over the five sessions are included (SHAM, n = 70 cells; MEC, n = 24 cells). (a) Mean firing rate (Hz), (b) peak rate (Hz), (c) information content, (d) spatial coherence, (e) place field size (cm2), (f) amplitude of place cell action potentials (µV) and (g) peak-to-trough duration of place cell action potentials (µs). Comparisons between SHAM and MEC in baseline session S1 (t-test, ***p < 0.001 or Mann–Whitney U test), when lights were switched off in S2 (repeated measures ANOVA or Wilcoxon signed-rank test for S1 and S2), during cue manipulations from S2 to S4 (repeated measures ANOVA or Wilcoxon signed-rank test for S2–S3–S4), and during recovery of external information in S5 (repeated measures ANOVA or Wilcoxon signed-rank test for S4 and S5). ANOVA session effect, §§§p < 0.001 and §p < 0.05.
First, we analysed the effects of suppressing visual cues and neutralising olfactory cues (S1 vs S2). In S2, a similar proportion of place cells in the two groups did not maintain a place field (though they continued to fire) (SHAM: n = 26/70, 37%; MEC: n = 9/24, 39%; χ2 (1) = 0.03, n.s.). For the cells that still exhibited a place field, in both SHAM and MEC rats, switching off the light and removing olfactory cues had deleterious effects on spatial coherence (repeated measures ANOVA, group effect, F(1,92) = 32.61, p < 0.001; session effect, F(1,92) = 5, p < 0.05; no group × session interaction, F(1,92) = 2.34, n.s.). No impact on information content (repeated measures ANOVA, group effect, F(1,92) = 11.09, p < 0.005; no session effect, F(1,92) = 2.17, n.s.; no group × session interaction, F(1,92) = 0.06, n.s.) and field size (repeated measures ANOVA, group effect, F(1,92) = 23.24, p < 0.001; no session effect, F(1,92) = 2.84, n.s.; no group × session interaction, F(1,92) = 1.89, n.s.) was found.
From S2 to S4, the progressive suppression of allothetic cues (switching off the light, removing the objects and neutralising olfactory cues) had an effect in both groups. We first assessed whether the SHAM group was affected and found that all spiking (spike amplitude, peak-to-trough duration) and spatial firing (infield mean firing rate, infield peak firing rate, spatial coherence, information content and field size) parameters remained unchanged (repeated measures ANOVA, no session effect, all ps > 0.05). We then looked at whether cue manipulation induced different effects in MEC rats relative to SHAM rats. A group × session interaction indicating a differential effect was found only for peak-to-trough duration that dropped in MEC rats (repeated measures ANOVA, no group effect, F(1,92) = 0.155, n.s.; session effect, F(2.184) = 7.263, p < 0.001; group × session interaction, F(2,184) = 5.495, p < 0.01). All other parameters, whether or not they were already different between the two groups during S1, showed a similar evolution from S2 to S4 in the two groups (repeated measures ANOVA, spike amplitude: group effect, F(1,92) = 15.05, p < 0.001, no session effect, F(2,184) = 1.315, n.s., no group × session interaction, F(2.184) = 1.544, n.s.; mean firing rate: no group effect, F(1,29) = 0.335, n.s.; no session effect, F(2,58) = 0.644, n.s.; no group × session interaction, F(2,58) = 0.211, n.s.; peak firing rate: no group effect, F(1,29) = 0.01, n.s.; no session effect, F(2,58) = 0.621, n.s.; no group × session interaction, F(2,58) = 0.214, n.s.; spatial coherence: group effect, F(1,92) = 5.647, p < 0.05; no session effect, F(2,184) = 1.148, n.s.; no group × session interaction, F(2,184) = 0.548, n.s.; information content, no group effect, F(1,92) = 1.207, n.s.; no session effect, F(2,184) = 2.308, n.s.; no group × session interaction, F(2,184) = 0.733, n.s.; field size, group effect, F(1,29) = 10.55, p < 0.01; session effect, F(2,58) = 4.86, p < 0.05; no group × session interaction, F(2,58) = 1.75, n.s.).
Since cue removal was gradual, we examined the dynamics of place field stability from S1 to S5. We again constructed a rate map for each half-session and calculated spatial correlations between rate maps for each two neighbouring half-sessions (first half-S1 × second half-S1, second half-S1 × first half-S2, first half-S2 × second half-S2, second half-S2 × first half-S3, etc.). As shown in Figure 5(a), within- and between-session correlations were affected and decreased across sessions in both MEC and SHAM rats (repeated measures ANOVA, group effect, F(1,92) = 31.5, p < 0.001, session effect, F(8,736) = 24.81, p < 0.001, group × session effect, F(8,736) = 4.67, p < 0.001). Most interestingly, post hoc analysis revealed that the within-session correlation dropped during S4 in MEC rats relative to last half-S3 × first half-S4 correlation and was lower than in SHAM rats (post hoc Newman–Keuls, MEC vs SHAM: second half-S3 × first half-S4, n.s.; first half-S4 × second half-S4, p < 0.001; second half-S4 × first half-S5, n.s.). Figure 5(b) and (c) shows example rate maps for S4, maps for first half-S4 and second half-S4 and correlations between these two maps in SHAM and MEC groups.
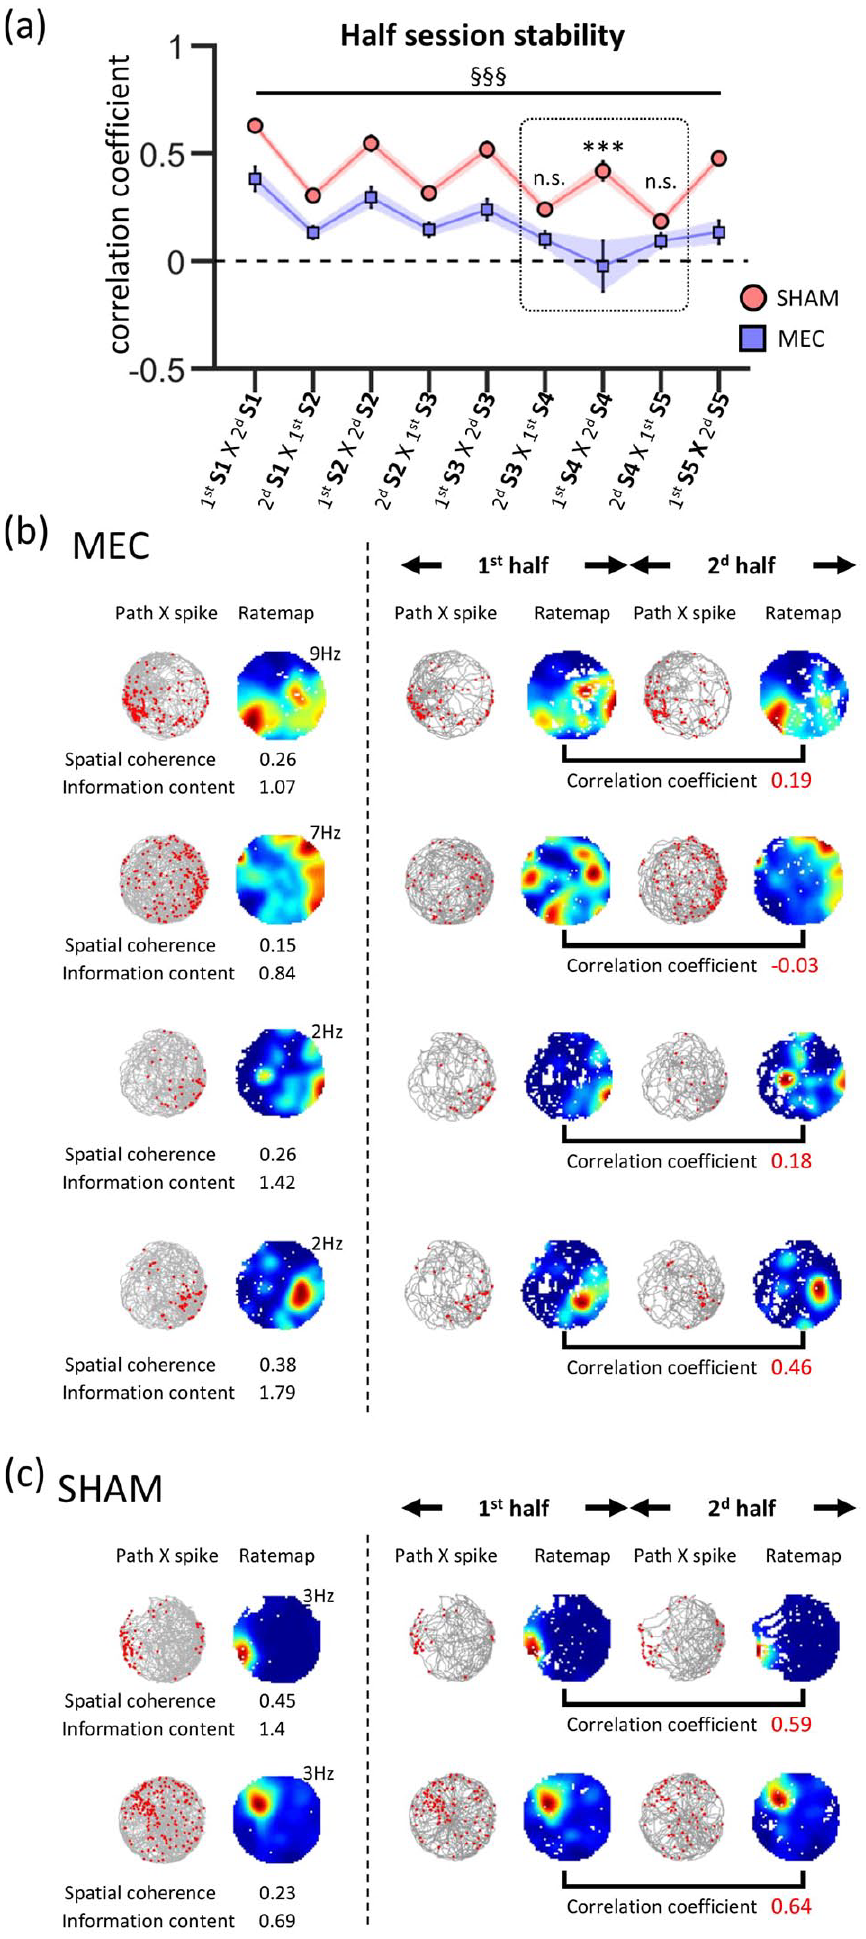
(a) Rate map correlation between the two neighbouring halves of successive sessions. Note the drop of the within-session correlation in MEC rats in S4. Post hoc tests revealed difference between SHAM and MEC in S4 (first S4 × second S4) and not for neighbouring half-session comparisons (second S3 × first S4 and second S4 × first S5). Repeated measure ANOVA for S1–S5, ANOVA session effect, §§§p < 0.001, SHAM versus MEC, post hoc Newman–Keuls ***p < 0.001. (b) and (c) Spatial firing patterns of (b) four representative place cells in MEC and (c) two representative place cells SHAM rats during S4. Left to the dashed line: each example shows the rat trajectory (in grey) with spike locations (red dots) (left), and the colour-coded rate map (right). The peak rate is displayed at the top right of rate maps, and spatial coherence and information content are shown below each example. Right to the dashed line: rat trajectory with spike locations and colour-coded rate map are shown for the first (first half) and the last (second half) half-sessions of S4 recording. The value of the spatial correlation coefficient between the half-session rate maps is shown in bold red.
Overall, cue degradation (S2–S4) did not alter firing parameters in SHAM rats. Within-session field stability was affected however. In MEC rats, the great majority of firing parameters were not differentially affected relative to SHAM rats. In contrast, within-session stability was clearly degraded in MEC rats relative to SHAM rats when only idiothetic cues were available in S4.
Return to baseline cue conditions (S5)
Before S5, animals were removed from the arena, which was cleaned, the objects were replaced, and the lights were switched back on. In SHAM rats, 17 out of the 26 place cells (65%) that did not maintain a place field in S2, S3 and S4 (though they were still active) recovered a place field. By contrast, in MEC rats, none of the nine cells that had not maintained a field in S2, S3 and S4 resumed spatial firing, but three additional place cells lost their field. We then calculated the correlation between the baseline session and S5 for each group and found a higher correlation for place cells in SHAM rats compared to MEC rats (MEC = 0.11 ± 0.04, SHAM = 0.38 ± 0.03, t-test, t(92) = 5, p < 0.01), indicating greater restoration of spatial firing in SHAM rats than in MEC rats. Spatial coherence of place fields in SHAM rats, but not in MEC rats, increased with respect to S4 (repeated measures ANOVA, group effect, F(1,92) = 16.78, p < 0.001; no session effect, F(1,92) = 0.21, n.s.; group × session interaction, F(1,92) = 7.73, p < 0.01; post hoc Newman–Keuls tests, S4 vs S5: SHAM, p < 0.05, MEC, n.s.; SHAM vs MEC: S4, n.s., S5, p < 0.001). Moreover, the within-session correlation increased for place cells in SHAM rats and was nearly significant in MEC rats (repeated measures ANOVA, group effect, F(1,92) = 59.02, p < 0.001; session effect, F(1,92) = 4.9, p < 0.05, no group × session interaction, F(1,92) = 0.3, n.s.; post hoc Newman–Keuls, S4 vs S5: SHAM, p < 0.001, MEC, p = 0.054; SHAM vs MEC: S4, p < 0.001, S5, p < 0.001). We also found that during S5, field size increased in MEC rats but remained unchanged in SHAM rats (repeated measures ANOVA, group effect, F(1,24) = 13.8, p < 0.01; no session effect, F(1,24) = 3.49, n.s; group × session interaction, F(1,24) = 6.51, p < 0.05; post hoc Newman–Keuls, S4 vs S5: SHAM, n.s., MEC, p < 0.005; SHAM vs MEC: S4, n.s., S5, p < 0.005). Together, these results indicate that in S5, place cells mostly recovered the activity seen in the baseline session in SHAM rats whereas it remained degraded in MEC rats in spite of fully available allothetic and idiothetic cues.
Discussion
To better understand the interaction between the MEC and place cells in the hippocampus, we investigated the effect of bilateral NMDA lesion of the MEC on place cell activity. Place cells were recorded as MEC-lesioned rats explored a familiar environment in which allothetic cues (visual, tactile, olfactory) were progressively suppressed or neutralised so that animals had to exclusively rely on idiothetic cues to maintain stable place fields. Since the MEC has been suggested to be important for conveying self-motion information to the hippocampus, we hypothesised that MEC lesions would disrupt place field stability when the rats had to use idiothetic cues relative to SHAM rats. It was also expected that in baseline condition MEC lesion would affect a number of firing parameters as shown in previous studies (e.g. Hales et al., 2014).
MEC lesions had a significant effect on behaviour. Although MEC rats exhibited higher running speeds (Van Cauter et al., 2013), increased locomotion did not yield a greater number of object exploration events. On the other hand, MEC rats made a lower number of visits to objects for exploration than SHAM rats even though they explored for a similar duration. This suggests that increased locomotion did not prevent MEC rats from collecting information in the environment. Interestingly, when visual and olfactory cues were suppressed in Session 2 (the objects were still available), MEC rats displayed a clear increase in object exploration compared to Session 1 whereas such an effect was not observed in SHAM rats. This result is counter-intuitive for SHAM rats since we should expect them to compensate for the absence of visual information by increasing ‘actual’ contacts with the objects. Speculatively, this might indicate that the spatial representation established during repeated cylinder exposures in SHAM rats was robust enough to withstand the loss of information. In this view, maintaining their level of object exploration in association with movement information would be sufficient for accurate tracking of their position. In contrast, MEC rats increased object exploration in Session 2 suggesting that they were not able to use their representation and/or the available sensory information to update their position and track their location in the environment. The use of passes near the objects to presumably collect dynamic tactile input through whisker contacts did not appear to be a prominent strategy in either group, even in darkness.
Consistent with previous studies (Hales et al., 2014; Schlesiger et al., 2015, 2018), we found that MEC lesions did not abolish place cell firing but, instead, induced alterations in their basic firing properties even during the first session when all allothetic information was available. In MEC rats, the overall proportion of place cells was nonetheless diminished. In the baseline condition, MEC lesions induced a complex pattern of effects. A number of spiking parameters (spike amplitude and ISI during bursts) and spatial firing parameters (information content, spatial coherence, field size) were altered whereas others (spike peak-to-trough duration, infield mean firing rates, peak firing rate) were unaffected. These effects are similar to those reported in previous studies (Brun et al., 2008; Hales et al., 2014; Kanter et al., 2017; Sabariego et al., 2019; Schlesiger et al., 2018) indicating that place cell firing does not exclusively depend on MEC inputs. Overdispersion, a parameter that reflects the excess variance inherent to place cell discharge (Fenton and Muller, 1998) was found to be higher in MEC rats. Our results thus parallel and extend those found in the literature, indicating that the intrinsic spatial selectivity of place cell activity was degraded in MEC rats. In addition, we show that MEC lesions induced within-session place field instability in the baseline condition as revealed by a lower within-session correlation in MEC rats. This result suggests that MEC-lesioned rats were unable to anchor their location to a stable spatial reference frame ‘on-line’. Overall, disrupting MEC input to the hippocampus affected mainly spatial properties of place cell firing in the baseline condition.
We then examined the effect of removing the main sources of allothetic information so that rats had to rely as much as possible on idiothetic cues. Interestingly during Session 2, MEC rats exhibited higher object exploration compared to Session 1 and to SHAM rats. This result suggests that MEC rats may compensate for their inability to maintain a stable place cell representation by increasing their contact with objects. Cue removal was gradual (Session 2, removal of visual + olfactory cues; Session 3, removal of visual + object cues; then Session 4, removal of visual + object + olfactory cues), to avoid suppression of cell firing as a result of a dramatic reduction in sensory input. Indeed, when visual and olfactory cues were neutralised (Sessions 1–2), the proportion of place cells that did not maintain a place field (though they were still firing) was similar in SHAM (37%) and MEC (39%) groups. Save et al. (2000) showed that when a visual cue-card and olfactory cues were removed, 50% of place cells did not maintain spatial-selective firing. In our study, the presence of 3D objects in Session 2 may account for more persistent spatial firing. From Session 2 to Session 4, progressive removal of allothetic cues (switching off the light, removing the objects and neutralising olfactory cues) induced a massive reduction of sensory input. It was remarkable that most of the firing parameters were unaffected in both SHAM and MEC rats, suggesting that they still received inputs to maintain intrinsic spatial properties.
Our main finding is that place cells in MEC rats showed overall lower stability than SHAM rats, both within sessions and between sessions. This effect was particularly evident in Session 4, when all allothetic information was suppressed. Within-session correlations decreased relative to SHAM rats. Our results therefore show that when the animals have to exclusively rely on idiothetic cues, place fields become unstable in the absence of a functional MEC. This effect persists when the initial cue conditions were restored (Session 5). This suggests that the MEC is important for processing idiothetic cues and provides this information to place cells in the hippocampus. It is nevertheless important to point out that even though idiothetic cues contribute to some extent to maintaining place field stability in SHAM rats, during Session 4 they were insufficient for keeping it at baseline levels (Session 1). This effect is consistent with the properties of path integration whose accuracy is limited due to progressive accumulation of errors resulting from inaccuracy in the evaluation of angular movement. Recalibration of the actual animal’s location therefore requires the use of external landmarks (Etienne et al., 1996; Gallistel, 1990).
The view that MEC plays an essential role in the processing of idiothetic cues and the computation of path integration was proposed when grid cells were discovered (Hafting et al., 2005; Sargolini et al., 2006). Grid cells are thought to provide a universal, that is, environment-invariant, metric for spatial navigation based on the use of idiothetic cues (McNaughton et al., 2006). It has since been shown that the grid map is not as environment-independent as previously assumed (Barry et al., 2007, 2012; Boccara et al., 2019; Derdikman et al., 2009; Jacob et al., 2019; Krupic et al., 2015; Munn et al., 2020). Yet, the MEC-grid cells-path integration hypothesis remains predominant despite the fact that only a few studies have shown a link between grid cell activity and path integration (Allen et al., 2014; Gil et al., 2018; Jacob et al., 2019) and between the MEC and path integration (Jacob et al., 2017; Van Cauter et al., 2013). In that regard, our results provide important support for this hypothesis. Moreover, they indicate that the processing of idiothetic information (and path integration computation) is important for maintaining a stable hippocampal spatial representation during locomotion. The existence of speed cells in the MEC, whose activity is correlated to instantaneous running speed, is compatible with such a dynamic computation (Kropff et al., 2015).
Previous studies using lesion, optogenetic and chemogenetic inactivation techniques have shown that MEC manipulation induced a remapping of place fields in familiar environments (Hales et al., 2014; Kanter et al., 2017; Miao et al., 2015; Ormond and McNaughton, 2015; Rueckemann et al., 2016). This instability cannot be accounted for by an involvement of MEC in path integration but may result from a change in spatial input from MEC to the hippocampus (Kanter et al., 2017). Accordingly, a number of studies have shown that MEC is also involved in the processing of allothetic cues (Ferbinteanu et al., 1999; Hales et al., 2014; Steffenach et al., 2005; Van Cauter et al., 2013). We thus support the idea that the MEC is part of a circuit that combines idiothetic and allothetic information to generate an internal reference frame that could be continuously updated by interacting with the external reference frame (Knierim et al., 2014). Such processing would be necessary for the hippocampal place cell system to anchor and maintain stable spatial representation during movement.
Footnotes
Acknowledgements
The authors thank Claire Maréchal for histological work, Dr Dominique Debanne for discussion and Dr Jenny Coull for reviewing English. TVC was supported by a doctoral fellowship from the Ministère de la Recherche.
Declaration of conflicting interests
The author(s) declared no potential conflicts of interest with respect to the research, authorship and/or publication of this article.
Funding
The author(s) received no financial support for the research, authorship and/or publication of this article.