
Abstract
Ethanol is a psychoactive substance causing both short- and long-term behavioural changes in humans and animal models. We have used the fruit fly Drosophila melanogaster to investigate the effect of ethanol exposure on the expression of the Gαq protein subunit. Repetitive exposure to ethanol causes a reduction in sensitivity (tolerance) to ethanol, which we have measured as the time for 50% of a set of flies to become sedated after exposure to ethanol (ST50). We demonstrate that the same treatment that induces an increase in ST50 over consecutive days (tolerance) also causes a decrease in Gαq protein subunit expression at both the messenger RNA and protein level. To identify whether there may be a causal relationship between these two outcomes, we have developed strains of flies in which Gαq messenger RNA expression is suppressed in a time- and tissue-specific manner. In these flies, the sensitivity to ethanol and the development of tolerance are altered. This work further supports the value of Drosophila as a model to dissect the molecular mechanisms of the behavioural response to alcohol and identifies G proteins as potentially important regulatory targets for alcohol use disorders.
Introduction
Ethanol, the alcohol most commonly found in fermented beverages, causes both acute and chronic effects on human and animal behaviour. The acute effects are known to be mediated via alteration of the activity of a number of central nervous system receptors and voltage-gated ion channels (Camarini and Pautassi, 2016). In contrast, long-term ethanol-induced changes in behaviour, which include tolerance, craving, withdrawal and relapse, are regulated by less well-understood mechanisms. Prior work has indicated the involvement, among other molecules, of G protein–coupled receptors (GPCRs). This includes dopamine, serotonin, gamma-aminobutyric acid type B (GABAB), opiate and other peptide receptors (Lovinger and Roberto, 2013). In addition, GPCRs have been shown to facilitate gamma-aminobutyric acid (GABA) release following ethanol stimulation (Kelm et al., 2011). However, less attention has been given to the role of G proteins associated with these receptors. GPCRs are stimulated by extracellular ligands and transduce the signal by activating their associated G proteins.
G proteins are heterotrimeric complexes composed of alpha, beta and gamma subunits of which several subtypes are encoded by the genomes of individual animal species (Milligan and Kostenis, 2006). Different G-protein subtypes elicit individual cellular signalling events by activating or inhibiting a variety of specific enzymes that further transduce the signal to other cellular systems (Syrovatkina et al., 2016). Each GPCR tends to associate with specific trimers of G-protein subunits; however, promiscuity of GPCR and G-protein interaction has been reported as a result of changes in G-protein gene expression for some but not all receptors (Camarini and Pautassi, 2016; Kostenis et al., 2005). Recent analysis of G-protein subunits and GPCR using cryo-microscopy has revealed both similarities and differences in the interaction between different GPCR and G proteins (Capper and Wacker, 2018), which supports the possibility of receptors associating with different G proteins.
The study of the molecular effects of ethanol has been greatly facilitated by the use of animal models (Barkley-Levenson and Crabbe, 2012). The fruit fly Drosophila melanogaster offers several advantages over mammalian models due to simple behaviours, short generation time and amenability to genetic studies (Kaun et al., 2012). When repeatedly exposed to sedating doses of ethanol, Drosophila displays tolerance measurable as a delayed onset of sedation in later ethanol exposures compared to the first exposure (Morozova et al., 2006; Sandhu et al., 2015). These behavioural changes are likely to depend on gene expression changes. However, the specific genes involved and their temporal sequence of activation or inactivation are not known. In Drosophila, RNA microarrays have been successfully used to identify several classes of genes, the expression of which is affected by alcohol treatment (Kong et al., 2010). An alternative approach is to focus on candidate genes based on their known involvement in the processes being investigated. In this study, we have hypothesised that changes in G-protein expression play a role in alcohol-induced tolerance in Drosophila as such change in expression could result in changes in the association of the G proteins with receptors and thus lead to alteration in cellular signalling in response to drugs (tolerance) or in their absence (craving). Changes in G-protein gene expression induced by psychoactive drugs have been previously documented in mammalian systems (Kaewsuk et al., 2001; Kitanaka et al., 2008; Zelek-Molik et al., 2012), but to our knowledge this has not been documented in Drosophila for alcohol-induced behaviours.
Following an initial screening of Drosophila G proteins (Supplementary Table 1), in this work we have investigated the effect of alcohol on the expression of Gαq and we demonstrate a correlation between downregulation of this subunit and the onset of tolerance.
Results
Development of ethanol tolerance in wild-type Drosophila
Drosophila wild-type Canton-S 1- to 3-day-old males exposed to ethanol vapours responded by reducing their locomotion followed by sedation. Sedation was determined by observing the flies every minute and recording the number of flies that were not able to recover to an upright position after being startled. The time at which 50% of the flies in the same exposure chamber were sedated was recorded as the ST50 for that group of eight flies. Flies were exposed to the same ethanol treatment for three consecutive days at 24-h intervals, and as expected, a higher ST50 was observed on the second and third day when compared to the first day of exposure, indicating that the flies were less responsive to the sedating effect of ethanol and thus more ‘tolerant’ (Figure 1). A control experiment, where ST50 was measured 1 or 3 days after selection and receiving the same handling as chronically treated flies but with no alcohol exposure other than measuring one ST50, showed no age-induced development of tolerance (results not shown).

Sedation time (ST50) in wild-type Drosophila. Groups of eight male flies were exposed to 100% EtOH vapours, and ST50 (time until 50% of the flies were sedated) was recorded. The timeline indicates that the three ST50 assays were carried out on three consecutive days with 24-h intervals. Horizontal bar indicates significant difference over 3 days; one-way ANOVA **p < 0.01, n = 6 independent experiments on separate days. Error bars represent SEM.
Alcohol effect on Gαq expression in wild-type Drosophila
RNA was extracted from the heads of Drosophila sacrificed at different time points during tolerance development: naïve, untreated flies (control); 1 h after the first ethanol exposure (acute response); 24 h after the second ethanol exposure (basal level in ‘chronically’ treated flies); and 1 h after the third exposure (acute response in ‘chronically’ treated flies). A significant decrease in Gαq messenger RNA (mRNA) expression was observed in basal level and in the acute response of ‘chronically’ treated flies (Figure 2). We use the term ‘chronically’ treated to emphasise the shift in response compared to the first treatment. To confirm that the change in mRNA expression had an effect on protein levels, Western blots were carried out with a primary antibody that recognises Drosophila Gαq protein. A significant reduction in Gαq protein was observed in chronically treated flies (Figure 3).
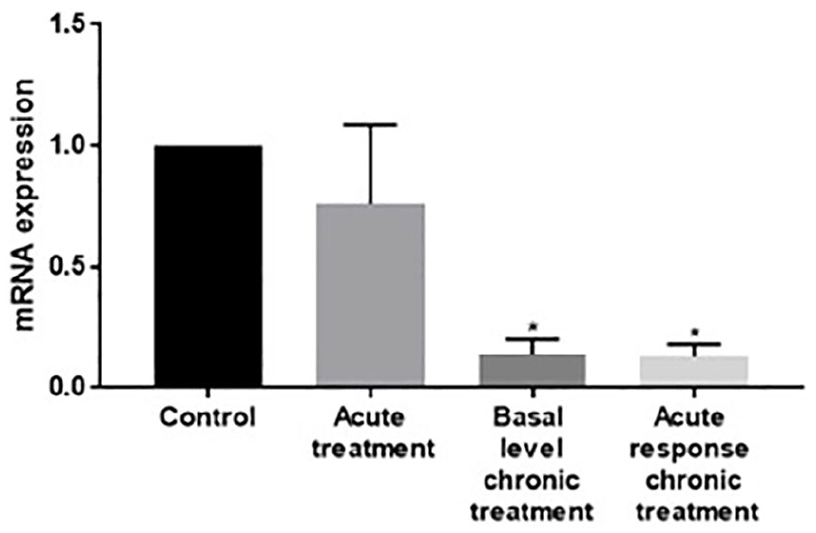
qRT-PCR of Gαq mRNA in wild-type Drosophila. mRNA levels of the Gαq subunit were quantified from the heads of control and ethanol-exposed wild-type flies by qRT-PCR using the 2−∆∆Ct method and normalised to an internal control β-actin. Flies (sets of 8) were exposed to ethanol for 30 min at 24-h intervals for up to 3 days and were sacrificed before ethanol exposure (control), 1 h after the end of the first ethanol exposure (acute treatment), 24 h after the second ethanol exposure (basal level chronic treatment) or 1 h after the end of the third exposure (acute response chronic treatment). Levels of mRNA expression are reported relative to the expression in control flies. *p < 0.05 compared to control, ANOVA with Bonferroni multiple comparisons. Bars represent SEM. n = 4 independent experiments.

Western blot analysis of Gαq protein expression. Primary antibodies recognising Gαq and β-actin, respectively, were used to estimate relative levels of Gαq protein expression in Drosophila heads that had not been exposed to ethanol (control), sacrificed 24 h after two ethanol exposures (basal level chronic treatment) or 1 h after the third ethanol exposure (acute response chronic treatment). All flies were handled similarly and were sacrificed at the same time. (a) Image of stained Western blot membrane. Both bands recognised by the anti-Gαq were used for the calculation in (b). The lanes shown were selected from a larger gel (full gels shown in Supplementary Figure 1). (b) Quantification of Gαq protein levels (density of both bands added together) normalised to β-actin. Densities are expressed as a ratio to the control level in the same sets of bands as shown in (a). Two separate experiments each consisting of duplicate sets of tubes of flies were treated as indicated (each tube containing 15 flies). The extracted samples were loaded in duplicates on gels and probed with polyclonal or monoclonal anti-Gαq antibodies. The band density of all 10 sets of the three conditions (six stained with polyclonal and four with monoclonal antibodies) were measured and recorded as shown. Data were analysed by non-parametric Kruskal-Wallis test and overall showed a statistically significant decrease, represented by long horizontal bars (*p = 0.0449). Short horizontal bars represent mean values.
Effect of induced downregulation of Gαq on tolerance development
In order to determine whether there is a causal relationship between the observed concurrent development of tolerance and downregulation of Gαq, knockdown of Gαq expression was induced via Gal4-UAS inhibitory RNA (RNAi) (Brand and Perrimon, 1993). To avoid that the reduced expression of Gαq affected the normal development of the flies, the induction of the RNAi was regulated in the flies by the temperature-sensitive Gal4 suppressor tubulin-Gal80ts (McGuire et al., 2003). Gal80ts is inactivated at temperatures of 25°C and above; thus, flies maintained at 18°C would not express Gαq RNAi and express normal level of Gαq, while at 25°C and above the expression of Gαq is suppressed by Gαq RNAi. We present here the data for two different lines that we have developed through crossings: one in which Gal4 is driven by the promoter of ubiquitously expressed tubulin (Tub-Gal4-Gal80ts-siRNAGαq) and one driven by the promoter of the neuronally expressed elav (Elav-Gal4-Gal80ts-siRNAGαq), both constructs also expressing tubulin-Gal80ts. In both fly lines, we confirmed a significant reduction in Gαq mRNA expression at the higher temperature compared to 18°C (Figure 4). It should be noted that we carried out the RNAi induction at 30°C and 25°C for the tubulin and elav constructs, respectively, because we had observed that the shift to 30°C (but not to 25°C) moderately affected the same-background control line of the elav construct (result at 30°C for elav construct not shown). Both Tub-Gal4-Gal80ts-siRNAGαq and Elav-Gal4-Gal80ts-siRNAGαq were subjected to the tolerance protocol (described above) at 18°C and 25°C/30°C, and their respective ST50 were measured (Figure 5). At 18°C, all flies demonstrated an increase in ST50 (tolerance) over the three ethanol exposures. At 25°C/30°C, both constructs with siRNAGαq flies demonstrated a higher ST50 on the first ethanol exposure than at 18°C and did not demonstrate an increase in ST50 (no tolerance) over the next two ethanol exposures. As the genetic background can in some cases affect ethanol-induced behaviour (Chan et al., 2014), we measured tolerance development in flies resulting from crosses of w1118;tub–Gal80ts; tub–Gal4/TM6c-Sb and w1118, elav–GAL4, mw+; tub–GAL80ts, mw+;+ and a fly line with the same background of the siRNAGαq line but not containing siRNAGαq. We observed that there was no difference in the ST50 at day 1 between 18°C and 25°C/30°C, and that normal tolerance developed over 3 days of ethanol exposure at both 18°C and 25°C/30°C (Supplementary Figure 2).

qRT-PCR of Gαq in knockdown mutant fly heads. Gαq mRNA was quantified by qRT-PCR using the 2−∆∆Ct method and normalised to an internal control β-actin. Measurements were carried out in (a) Tub-Gal4-Gal80ts-siRNAGαq (ubiquitous expression of Gαq siRNA) and (b) Elav-Gal4-Gal80ts-siRNAGαq (neuronal expression of Gαq siRNA) 72 h after the flies were transferred to a 30°C or 25°C incubator, respectively. Results represent average of four independent experiments, with six flies per condition, and duplicate assays. t-test *p < 0.05, ****p < 0.0001. Bars represent standard deviation.

Sedation time (ST50) in Drosophila Gαq knockdown mutants. Groups of eight male flies were incubated at 18°C, 25°C or 30°C for 3 days, followed by exposure to 100% EtOH for three consecutive days, at the same time of the day. ST50 (time until 50% of the flies were sedated) was recorded. (a) w1118;tub−Gal80ts; tub−Gal4/TM6c-Sb (ubiquitous expression of Gαq siRNA) and (b) w1118/Y;tub−Gal80ts; elav−Gal4/TM6c-Sb (neuronal expression of Gαq siRNA). Horizontal bars indicate significance in ST50 change over 3 days. Stars over day 1 bars indicate significant difference between day 1 30°C and day 1 18°C or day 1 25°C and day 1 18°C. ANOVA with Bonferroni post hoc test *p < 0.05; **p < 0.01; ***p < 0.001; NS = not significant. n = 5–6 independent experiments. Bars represent standard deviation.
Discussion
In this work, Drosophila was confirmed to be a useful model for studying alcohol-induced behaviours as has been amply demonstrated in other studies (Kaun et al., 2012; Robinson et al., 2013). Previous Drosophila work had identified a number of GPCRs that are involved in the response to alcohol, including the dopamine/ecdysteroid receptor (Petruccelli et al., 2016), neuropeptide F receptor (Wen et al., 2005), putative opioid receptors (Koyyada et al., 2018) and GABAB receptor (Ranson et al., 2019). An earlier extensive review of mammalian studies of the effect of psychostimulants on G-protein expression (Kitanaka et al., 2008) highlighted that only limited work had been focused on ethanol-induced changes in any animal models, with only one study reporting a reduction in G-protein b1 in rat hippocampus (Saito et al., 2002). A more recent microarray study (Kong et al., 2010) focusing on the effect of acute ethanol exposure in Drosophila did not identify any G proteins being significantly affected. This matches with our observations of a lack of significant expression change following acute exposure as opposed to chronic exposure which does cause a significant change compared to untreated flies. To our knowledge, this is the first report specifically targeting ethanol-induced G-protein changes and the first to be carried out in Drosophila.
This study has demonstrated that chronic exposure to ethanol causes a reduction in Gαq expression in Drosophila heads. We have confirmed that this statistically significant decrease occurs at both the mRNA and protein level. In addition, the results strongly suggest that this altered Gαq expression has a functional significance, as flies in which Gαq expression was downregulated via Gαq-RNAi show an altered behaviour in the development of tolerance to ethanol. Given that chronic ethanol exposure induces a Gαq reduction and a reduction in the sensitivity to ethanol (increase in ST50) and given that RNA reduction of Gαq causes an increase in ST50 similar to chronic ethanol exposure, it is reasonable to hypothesise that Gαq is involved in the reduction of sensitivity to ethanol following chronic ethanol exposure. We have demonstrated this effect both in ubiquitously expressed Gαq downregulation (tubulin promoter driven) and in neuron-specific downregulation (elav promoter driven). Gαq is known to have an important neuronal function in the Drosophila brain (Himmelreich et al., 2017) and thus it might have been expected that neuronally restricted downregulation will be more effective. Indeed, in the elav construct, a 50% reduction in Gαq mRNA had very similar effect in terms of ST50 change to an 81% mRNA reduction of the tubulin construct. The mechanism by which the change in Gαq expression and its effect on tolerance occur remains to be elucidated in terms of how the Gαq gene is regulated and how the change of expression is associated with tolerance. The slo-K+ channel (homologous to the mammalian BK channel) has been implicated in the formation of rapid tolerance to ethanol (Ghezzi et al., 2004), and it would be of interest to determine whether there is a functional link between slo-K+ and Gαq with respect to alcohol tolerance.
The Gαq Drosophila subunit is known to signal via the phospholipase C pathway, which leads to activation of protein kinase C (PKC; Litosch, 2016). Interestingly, a deficiency of PKC has been associated with desensitisation to alcohol in Drosophila (Chen et al., 2010). This would be consistent with our finding that ethanol-induced reduction of Gαq is associated with reduced sensitivity for alcohol. It may also be relevant that slo-K+ activity is affected by PKC phosphorylation (Contreras et al., 2013). Recent findings have depicted a more complex picture of G-protein signalling, which includes multiple targets for Gαq (Litosch, 2016), multiple isoforms of phospholipase C and the role of G-protein regulating proteins (McCudden et al., 2005). Full understanding of the role of Gαq in ethanol-induced behaviour will require understanding the role of multiple physiological functions. While in this study we have specifically focused on the relation between Gαq and ethanol-induced tolerance, Gαq due to its wide distribution and association with multiple receptors is associated with several other functions. Indeed, Gαq mutants have been shown to have altered olfactory expression (Kain et al., 2008) and axonal pathfinding (Ratnaparkhi et al., 2002). However, the advantage of measuring ST50, as we did in this study, is that the time to sedation is directly related to the exposure to ethanol and is not affected by other functions such as olfaction, memory or directional movement.
It also needs to be established to what extent the change in gene expression for Gαq is specific to alcohol consumption compared to other psychoactive substances. In cocaine-treated rats, a significant increase in Gαq was observed in the amygdala and paraventricular nucleus membrane fraction 2 days after withdrawal with no change in the frontal cortex or in the cytosolic fraction of any of the brain regions (Carrasco et al., 2003).
The Gαq subunit is probably not the only subunit whose expression is affected by alcohol. Indeed, we have preliminary data for changes in other alpha and beta subunits, but these observations require confirmation by further genetic studies.
In summary, this work provides evidence that Gαq expression is affected by chronic alcohol exposure and that this change is likely to be involved in the development of tolerance. Further work analysing different G-protein subunits and other effectors of G-protein signalling needs to be carried to fully elucidate the mechanism of tolerance to alcohol and other psychoactive drugs in Drosophila and mammalian species.
Methods
Fly stock and maintenance
Canton-S wild-type flies, small interfering RNA (siRNA) line for Gαq-specific knock down (stock number 36775) and a line with same background of the siRNA line (stock number 36303) were obtained from Bloomington Stock Centre (USA). Drosophila lines w1118;tub−Gal80ts; tub−Gal4/TM6c-Sb (kindly donated by Professor Joerg Albert, UCL, UK) and w1118, elav-GAL4, mw+; tub-GAL80ts, mw+;+ (kindly donated by Dr Colin McClure, Imperial College London, UK) were used. Fly lines with temperature-inducible expression of Gαq RNAi were developed by crossing Gαq RNAi virgin females with male w1118/Y;tub−Gal80ts; tub−Gal4/TM6c-Sb or w1118, elav-GAL4, mw+; tub-GAL80ts, mw+;+ flies. Male offspring were selected based on lack of the dominant stubble marker for the Tub-Gal4 driver, while flies with the elav-Gal4 driver did not need selection because the parent fly was homologous for elav-Gal4 and tub-GAL8ts. The flies resulting from these crosses are referred to as Tub-Gal4-Gal80ts-siRNAGαq and Elav-Gal4-Gal80ts-siRNAGαq, where the former is expected to express siRNAGαq ubiquitously, while the latter only in neurons; the expression siRNAGαq will be repressed by Gal80ts in both lines at 18°C. All flies were grown on ready-mix Drosophila dried food prepared with water in equal amounts (Philip Harris Education, UK) and routinely incubated at 25°C and 60% relative humidity in a 12-h light/dark cycle incubator. Temperature-sensitive mutant flies were reared at either 18°C (control) or 25°C–30°C (experimental conditions: 25°C was used for Elav-Gal4-Gal80ts-siRNAGαq and 30°C for Tub-Gal4-Gal80ts-siRNAGαq).
Behaviour assay
Ethanol sedation and tolerance were measured using the procedure adapted from Maples and Rothenfluh (2011). Male flies were separated in groups of 8 using light CO2 sedation and allowed to recover in a tube with food for 24 h. Flies were selected from actively growing colonies that were cleared 72 h earlier and may have thus contained different ratios of fly ages. Flies were transferred to a 25 mm× 95 mm transparent plastic vial in between two cotton plugs. One cotton plug at the base of the vial served as a stable surface to observe the flies and the other cotton plug was used to cap the vial and deliver the ethanol. Five hundred microlitres of 100% ethanol was added to the side of the cotton plug facing the flies. Sedation was observed manually as ST50, which is the time in minutes it takes for 50% of the flies in a sample vial to become sedated. Sedation was defined as the lack of movement or the inability to self-right for 3 s after being startled to the bottom of the tube. The 3-s observation has been optimised to reduce observer bias. It is extremely rare for flies that have been stationary for 3 s to right themselves while still being in the ethanol chamber. Flies were exposed to ethanol for three consecutive days, once a day with 24 h in between exposures. Experiment series were repeated on different days with different generations of flies.
Sequence analysis and primer design
The DNA sequence for Gαq protein genes in the Drosophila genome were obtained from Fly Base (www.flybase.org) and/or National Centre for Biotechnology Information Databases (Gq: CG17759) and aligned using CLUSTALW2 (www.ebi.ac.uk/tools/ms/clustalW2), a free online tool through the European Bioinformatics Institute (EBI). Primer pairs were designed using National Centre for Biotechnology Information to span intron regions or exon–exon junction in order to avoid amplifying contaminating genomic DNA. A pair of primers was designed for the G-protein gene and the sequences were verified by a BLAST (Basic Local Alignment Search Tool) search to check for specificity to the Gαq protein coding regions. The following primers were designed: (Gq gene) Gq fwd: 5′-CAGCAGCACGCGAAAGCGTC-3′ and Gq rev: 5′-GTCCCGGCGCAACTGCTTCT-3′. The housekeeping gene/internal control (β-actin) β-actin fwd: 5′-GCGTCGGTCAATTCAATCTT -3′ and β-actin rev: 5′AAGCTGCAACCTCTTCGTCA-3′ were selected from a previous study (Ponton et al., 2011).
Real-time reverse transcriptase polymerase chain reaction
Flies (sets of eight) were snap-frozen in liquid nitrogen (30 s), the heads were isolated by 2-min vortex decapitation and collected under a dissecting microscope. Heads were homogenised with disposable tissue homogenisers for 10 s in Qiagen RNEasy Plus RLT buffer in sterile 1.5 mL Eppendorf tubes according to the manufacturer’s instructions. RNA was quantified spectrophotometrically (Nanodrop Technologies, USA). RNA was amplified and quantified with the one-step reverse transcriptase polymerase chain reaction (RT-PCR) quantification kit from PCR Biosystems (UK) on a Stratagene Mx3000pTM Real-time PCR System (Stratagene, USA) according to the manufacturer’s instructions. Each reaction mixture contained the following: 5 ng of RNA, 400 nM of forward and reverse primers, made up to 20 µL with the kit reagents, in a 96-well plate (Thermo Scientific, UK). Qualitative RT-PCR (qRT-PCR) was performed under the following sequential conditions according to the manufacturer’s protocol: complementary DNA (cDNA) synthesis at 45oC for 10 min, polymerase activation at 95 C for 2 min, initial denaturation at 95oC for 5 s, followed by 40 cycles of denaturation at 95oC for 5 s and annealing/extension at 60oC for 20 s. In each experiment, a melting curve cycle was performed according to the manufacturer’s programme to check the melting temperature of the products produced to ensure the product was of the expected size and not the result of primer dimers. mRNA level was quantified using the comparative method (2−∆∆Ct), (Schmittgen and Livak, 2008), where 2−∆∆Ct equals the normalised threshold cycle (DCt) of G-protein genes in treated flies minus the DCt of the same gene in naïve flies (control) and normalised to the internal control β-actin. The efficiency of the primers was measured and was found to be comparable to satisfy the recommendations of Pfaffl (2001). RT values ranged between 21–23 and 20–21 for Gq and actin, respectively.
Western blot
The following antibodies were used: rabbit polyclonal anti-Gαq/11 at a dilution of 1:250 (Santa Cruz Biotech. Inc., USA), mouse monoclonal anti-Gαq/11 (sc-136181; Santa Cruz Biotech) at a dilution of 1:250, anti-actin at a dilution of 1:3000 (St John’s Laboratory, UK) and horseradish peroxidase–conjugated goat anti-rabbit IgG and anti-mouse IgG secondary antibody (Cayman Chemical Company, UK) at a dilution 1:10,000. Sets of 15 fly heads (males) were homogenised in Laemmli buffer in sterile and ice-cold 1.5 mL Eppendorf tubes. Samples were then cooled in ice for 1 min and heated for 5 min at 95oC. After further cooling on ice for 1 min, the samples were centrifuged at top speed for 1 min and resolved on 10% sodium dodecyl sulphate (SDS) gel (ProtoGel; National Diagnostics, USA). Blots were transferred onto 0.2-µm pore-sized polyvinylidene difluoride (PVDF) membranes (Biorad) using Trans-blot turbo. The membrane was incubated with the primary antibodies for 18 h at 4°C, washed three times with tris-buffered saline (TBS) buffer 0.05% Tween 20, incubated with secondary antibodies for 1 h at room temperature developed with Biorad chemiluminescence reagents and visualised using Biorad ChemiDoc imager. The same membranes were prepared for reprobing by incubating with 0.2 M NaOH for 5 min followed by three washes in water. Membranes were incubated with the anti-actin antibodies for 2 h at room temperature and further processed as described above. Molecular weight markers were Magic marker XP from Fisher Scientific UK.
Statistical analysis
Statistical analysis was performed using GraphPad Prism version 7. Statistical tests are indicated in the figure legends. Western blots were analysed using Image J. Error bars represent mean ± standard error of the mean (SEM) or standard deviation.
Supplemental Material
Supplemental_Material_ – Supplemental material for G-protein αq gene expression plays a role in alcohol tolerance in Drosophila melanogaster
Supplemental material, Supplemental_Material_ for G-protein αq gene expression plays a role in alcohol tolerance in Drosophila melanogaster by Benjamin Aleyakpo, Oghenetega Umukoro, Ryan Kavlie, Daniel C. Ranson, Andrew Thompsett, Olivia Corcoran and Stefano O. Casalotti in Brain and Neuroscience Advances
Footnotes
Acknowledgements
The authors thank Prof. Joerg Albert and Dr Alyona Kerder for critically reading the manuscript.
Author contributions
B.A. carried out most of the experimental work described in the manuscript, O.U. had carried out the initial development work that led to the findings described here, R.K. provided expertise in fly genetics, B.A. was granted a partial fees-bursary from the University of East London. D.C.R. contributed to the final experiments. A.T. provided molecular biology expertise and advice during the project, O.C. co-supervised the project and S.O.C. directed the project. All authors contributed to the completion of the manuscript and reviewed it before submission.
Data availability
All the data presented in this manuscript and any supporting data will be made available.
Declaration of conflicting interests
The author(s) declared no potential conflicts of interest with respect to the research, authorship and/or publication of this article.
Funding
The author(s) disclosed receipt of the following financial support for the research, authorship, and/or publication of this article: This work was partially funded by the University of East London through an equipment start-up grant to S.O.C. B.A. and O.U. were self-funded PhD students and have contributed to the cost of the research through bench fees. B.A. was granted a partial fees-bursary from the University of East London. D.C.R. is supported by a PhD scholarship from the Society for the Study of Addiction. No funding was received from agencies in the public, commercial or not-for-profit sectors. S.O.C. paid for the article processing charges.
Supplemental material
Supplemental material for this article is available online.
References
Supplementary Material
Please find the following supplemental material available below.
For Open Access articles published under a Creative Commons License, all supplemental material carries the same license as the article it is associated with.
For non-Open Access articles published, all supplemental material carries a non-exclusive license, and permission requests for re-use of supplemental material or any part of supplemental material shall be sent directly to the copyright owner as specified in the copyright notice associated with the article.