
Abstract
Introduction:
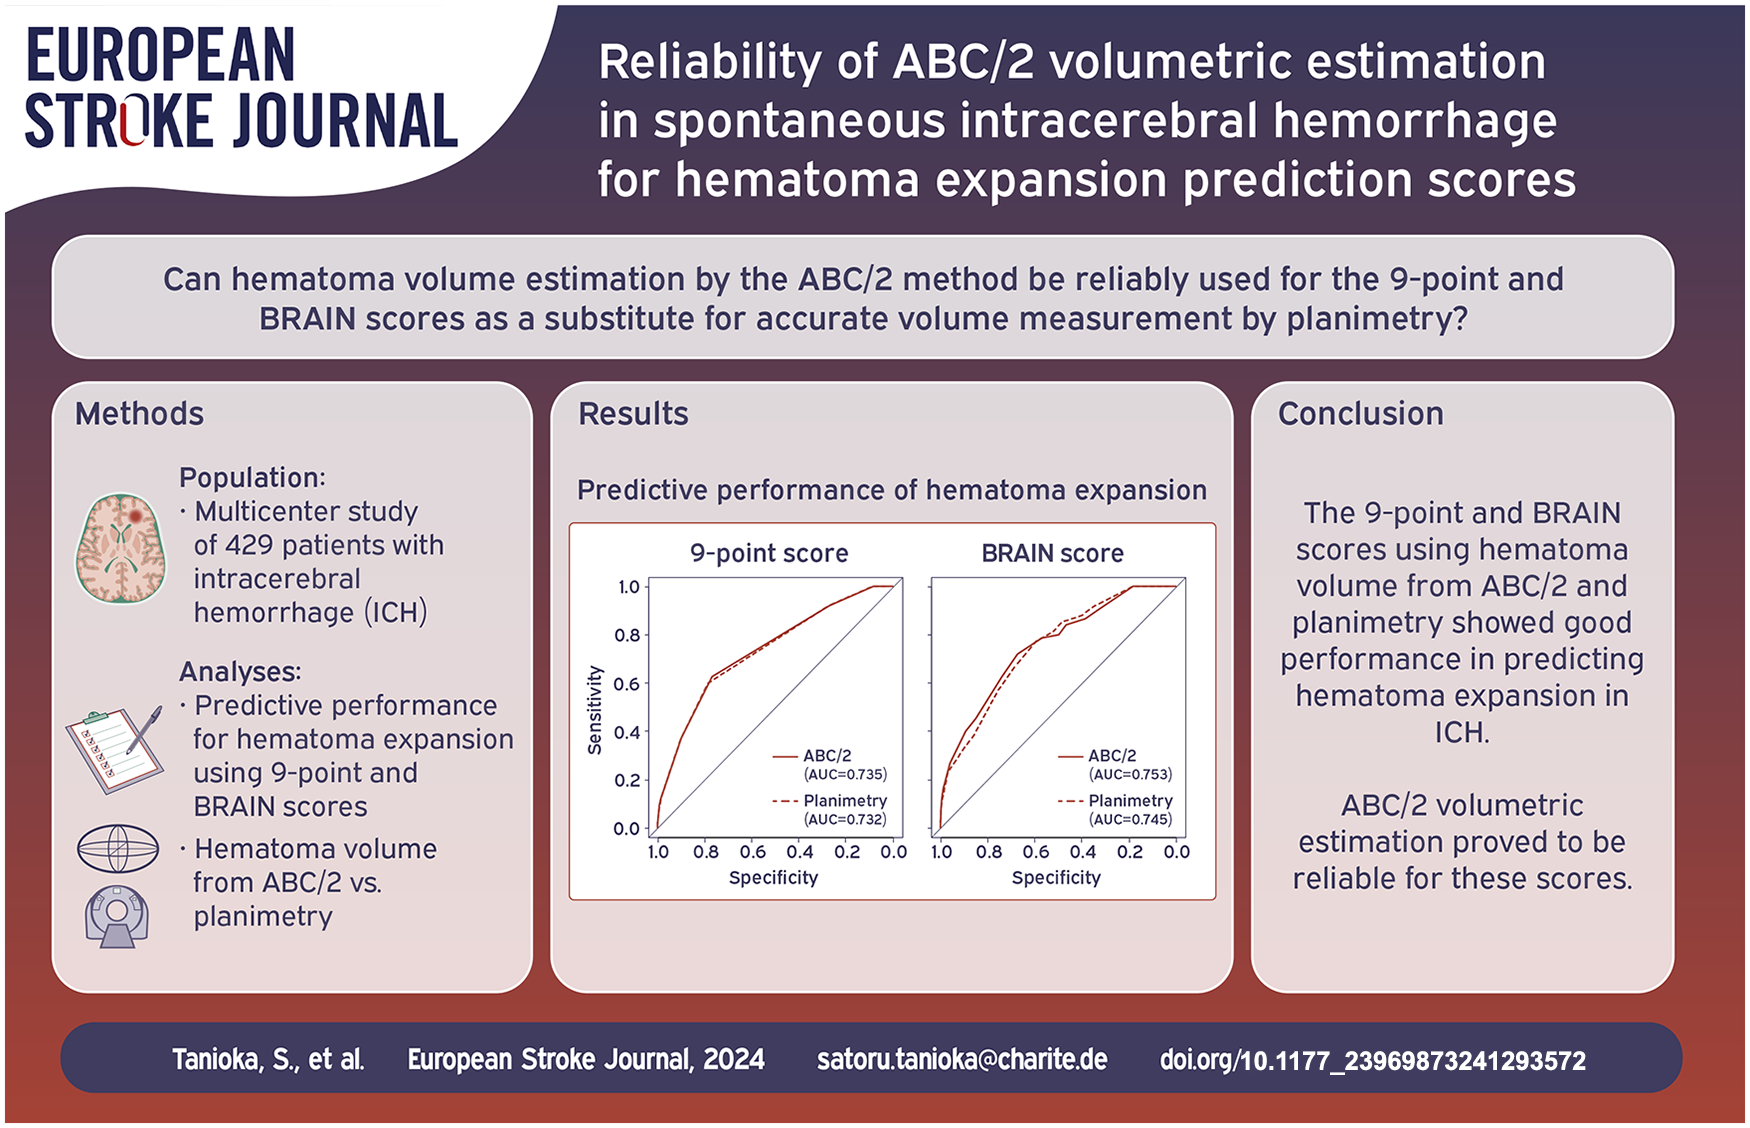
Prediction scores for hematoma expansion in spontaneous intracerebral hemorrhage (ICH), such as the 9-point and BRAIN scores, were developed predominantly using planimetry to measure hematoma volume. In this study, we aim to investigate whether the ABC/2 formula, which is known to overestimate hematoma volume, can be reliably used as a substitute for planimetry in these prediction scores.
Patients and methods:
A total of 429 patients from four hospitals were retrospectively enrolled. CT scan and clinical data at admission and follow-up CT scan were collected. The 9-point and BRAIN scores were calculated using hematoma volume from ABC/2 and planimetry. Hematoma expansion was assessed using hematoma volume from planimetry.
Results:
The median hematoma volume measured by ABC/2 was 11.97 ml (interquartile range [IQR], 4.8–30.0), whereas the volume measured by planimetry was 11.70 ml (IQR, 4.9–26.6). The median measurement error between ABC/2 and planimetry was 0.30 ml (IQR, −0.72–2.87). ABC/2 overestimated hematoma volume in 244 patients (56.9%) compared to planimetry. In the 9-point score, the area under the curves (AUCs) for predicting hematoma expansion were 0.735 (95% confidence interval [CI], 0.675–0.796) with ABC/2 and 0.732 (95% CI, 0.672–0.793) with planimetry. In the BRAIN score, the AUCs were 0.753 (95% CI, 0.693–0.813) with ABC/2 and 0.745 (95% CI, 0.688–0.803) with planimetry.
Discussion and conclusion:
The 9-point and BRAIN scores using hematoma volume measured by ABC/2 and planimetry showed good performance in predicting hematoma expansion in ICH. ABC/2 volumetric estimation proved to be reliable for these scores.
Introduction
Hematoma expansion is a significant event associated with early neurologic deterioration and poor patient outcomes in spontaneous intracerebral hemorrhage (ICH).1,2 To date, many trials have focused on reducing the risk of hematoma expansion.3 –6 Additionally, numerous studies have aimed to accurately predict hematoma expansion on admission by combining clinical information.7 –26 Various methods, including scoring systems and state-of-the-art radiomics and machine learning analyses, have been proposed for the prediction.8,11,18,20,21,23 –26 Since radiomics and machine learning are not yet widely applicable, scoring systems, such as 9-point, BRAIN, and BAT scores, remain valuable.8,11,18 These prediction scores are easily adoptable in clinical practice and are particularly useful in rural areas, where they assist in deciding whether a patient should be transferred to specialists.
The 9-point and BRAIN scores require hematoma volume to assign points.8,11 The ABC/2 formula and the planimetry technique are widely used to measure hematoma volume. In the ABC/2 formula, hematoma volume is manually calculated using three mutually perpendicular lengths. The planimetry technique, on the other hand, calculates hematoma volume by multiplying segmented hematoma areas by a slice thickness using software. Planimetry can measure hematoma volume more precisely than ABC/2 that is known to overestimate hematoma volume.27,28 To develop the 9-point score, planimetry was adopted to measure hematoma volume. 8 In the BRAIN score, planimetry was employed in most cases, with ABC/2 used in a small number of cases. 11
Here, a question arises. Although the 9-point and BRAIN scores were developed predominantly using planimetry to measure hematoma volume, can they also predict hematoma expansion with the same performance when ABC/2, which may overestimate hematoma volume, is used as a substitute for planimetry? In real ICH patient management, ABC/2 is usually used for evaluating hematoma volume because planimetry is more time-consuming.
In this study, we investigate the performance of the 9-point and BRAIN scores using hematoma volume measured by ABC/2 and planimetry. Then, we aim to determine whether ABC/2 can be reliably used for these scores to predict hematoma expansion in spontaneous ICH.
Patients and methods
Study population
The institutional review boards granted approval for this study. Individual informed consent was waived by the institutional review boards due to the retrospective nature of this study. All study protocols and procedures were conducted in accordance with the Declaration of Helsinki. This article was prepared according to the standards for reporting of diagnostic accuracy (STARD) statement.
Consecutive patients aged ⩾ 18 years with acute ICH admitted to a university hospital and three regional base hospitals were retrospectively reviewed. The hospitals included Mie University Hospital (January 2017 to December 2021), Mie Chuo Medical Center (December 2013 to December 2021), Matsusaka Chuo General Hospital (January 2018 to September 2021), and Suzuka Kaisei Hospital (October 2017 to December 2021). Inclusion criteria were as follows: baseline CT scan within 24 h of onset; follow-up CT scan within 48 h after baseline CT scan; and CT scans with a thickness of 5.0 mm or less. Exclusion criteria were as follows: multiple hemorrhage; secondary cause of ICH (e.g. hemorrhagic transformation of ischemic infarction, aneurysm, arteriovenous malformation, arteriovenous fistula, and tumor); traumatic ICH; surgical hematoma evacuation before follow-up CT scan; and insufficient data.
A total of 429 patients were enrolled in this study (Figure 1): 100 (Mie University Hospital), 105 (Mie Chuo Medical Center), 116 (Matsusaka Chuo General Hospital), and 108 (Suzuka Kaisei Hospital). The following demographic and clinical data on admission were collected from the medical records: age, sex, previous history (ICH, cerebral infarction, ischemic heart disease, hypertension, diabetes mellitus, and dyslipidemia), anticoagulant use, antiplatelet use, systolic and diastolic blood pressures, Glasgow Coma Scale, hemoglobin, platelet count, white blood cell count, serum creatinine, serum total bilirubin, prothrombin time-international normalized ratio (PT-INR), and time from onset to baseline CT scan (Table 1).
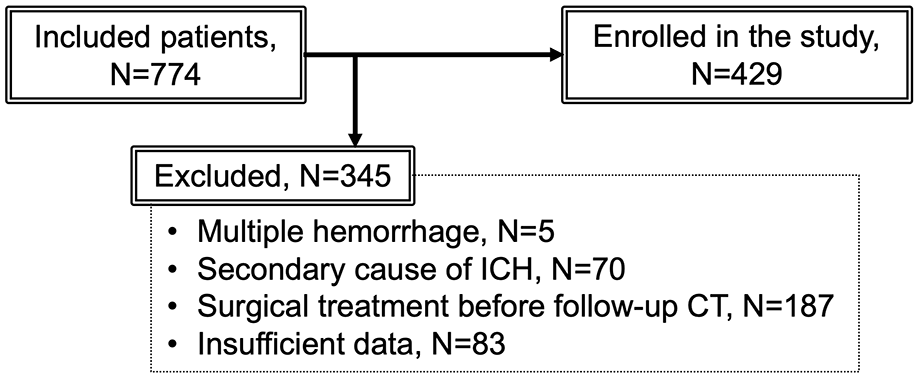
Flow diagram of patient enrollment.
Demographic and clinical characteristics of patients. .
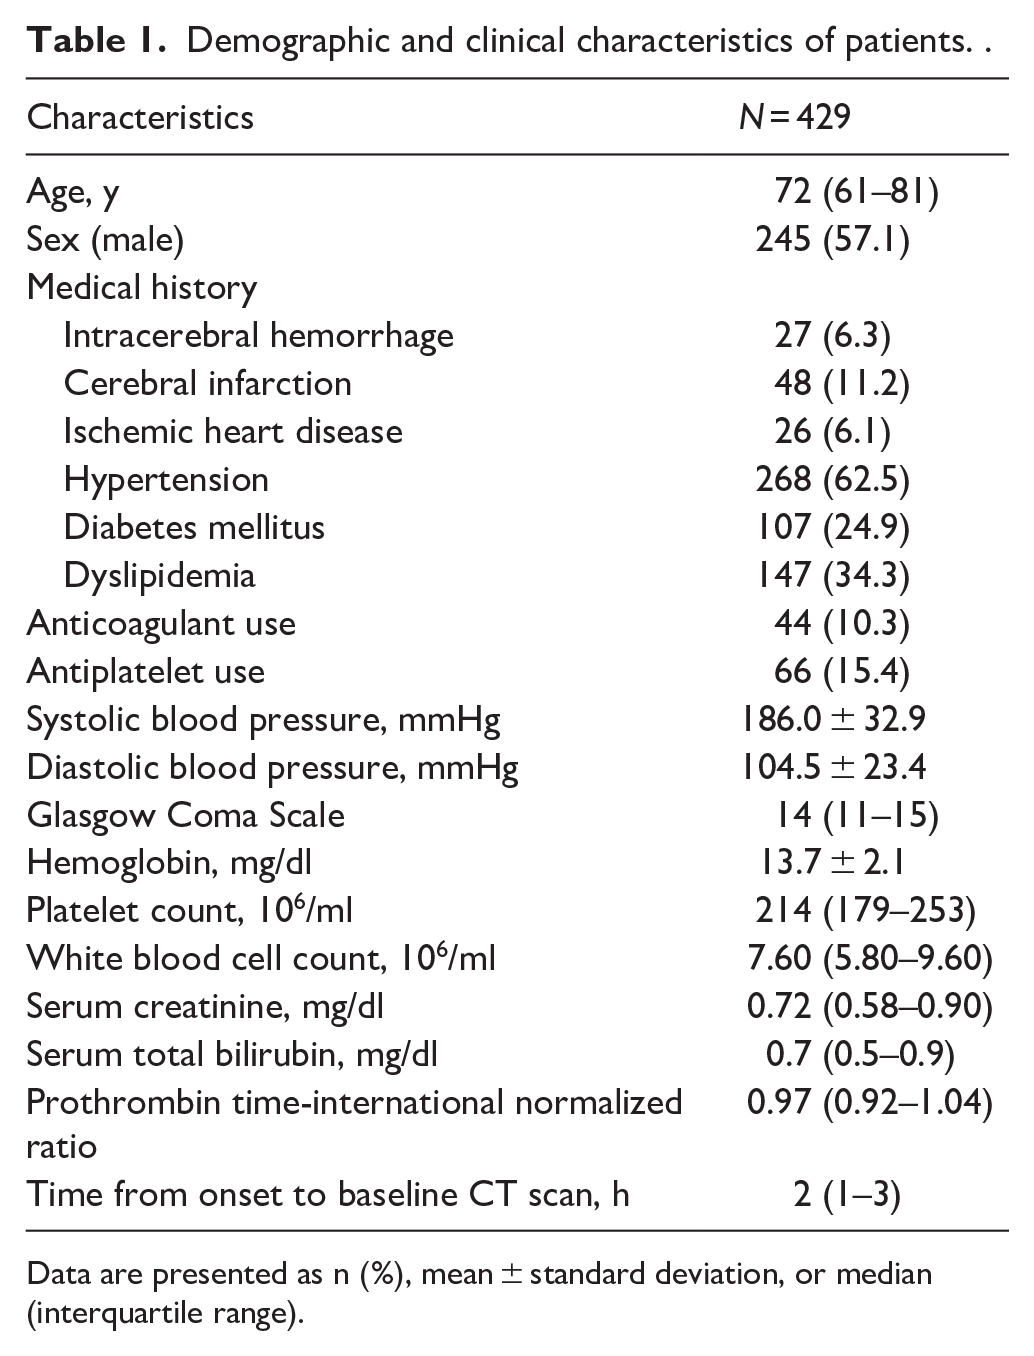
Data are presented as n (%), mean ± standard deviation, or median (interquartile range).
Imaging acquisition
CT scanning was conducted at 120 kVp with a slice thickness of 0.25–5.0 mm. CT angiography was performed by injecting 50–100 ml of iodinated contrast medium at 3.5–5.0 ml/s. One hundred and thirty-four patients (31.2%) underwent CT angiography.
Inhospital management
Following the identification of ICH on the baseline CT scan, continuous blood pressure monitoring and the initiation of blood pressure-lowering treatment were undertaken. Throughout the period between the baseline and follow-up CT scans, calcium channel blockers were administered as antihypertensive agents, with a target systolic blood pressure of less than 140 mmHg or 180 mmHg. If patients were on anticoagulants, reversal agents were administered.
Hematoma volume measurement by ABC/2 and planimetry
Only intraparenchymal hematoma was measured as hematoma volume; intraventricular hematoma was not included in the hematoma volume. For ABC/2 and planimetry, two different raters who are board-certified stroke specialists measured hematoma volume. Each rater evaluated approximately half of the total cases. Prior to conducting the measurements, the raters simultaneously assessed several cases as part of a training session to reach a consensus on the evaluation method.
In ABC/2, the following three lengths were specified: the maximum length measured on the slice with the largest hematoma area (A), the maximum length perpendicular to A (B), and the number of slices with hematoma multiplied by the slice thickness (C). Hematoma volume was calculated by multiplying A, B, and C and dividing by 2. ABC/2 was performed on the baseline CT scan to assign points to the 9-point and BRAIN scores.
In planimetry, hematoma was manually segmented in each slice using 3D slicer. Hematoma volume was computed by multiplying the segmented areas by the slice thickness. Planimetry was performed on the baseline CT scan to assign the points and on the follow-up CT scan to assess hematoma expansion.
Hematoma expansion was defined as a volume increase in planimetry between baseline and follow-up CT scans greater than 6 ml or 33% of baseline volume.8,11,18,19,29,30
Qualitative assessment of CT findings at baseline
Hematoma locations were categorized as basal ganglia, thalamus, brainstem, cerebellum, and lobe. Hemorrhage in the basal ganglia, thalamus, brainstem, and cerebellum was defined as deep ICH, whereas hemorrhage in the lobe was defined as lobar ICH. Intraventricular extension of hematoma was evaluated. CT angiography spot sign was assessed with the following definition: ⩾1 focus of any size and morphology of contrast pooling (⩾120 Hounsfield units) within the hematoma, and discontinuous from normal or abnormal vasculature adjacent to the hematoma.16,31 All assessments were conducted by two raters. In case of disagreement, the CT images were reassessed by both raters together and a consensus was reached.
9-point and BRAIN scores
The 9-point score was calculated from hematoma volume, CT angiography spot sign, anticoagulant use, and time from onset to baseline CT scan. 8 The BRAIN score was calculated from hematoma volume, intraventricular extension of the hematoma, anticoagulant use, time from onset to baseline CT scan, and previous history of ICH. 11
Statistical analysis
Continuous variables were summarized as mean with standard deviation or median with interquartile range, depending on the distribution of the variable evaluated by the Shapiro-Wilk test. Categorical variables were summarized as counts with percentages.
Inter-rater reliability was evaluated for hematoma volume measurement and for the qualitative assessment of CT findings. For hematoma volume measurement, intra-class correlation coefficient (ICC) was calculated. Two raters measured identical 70 hematoma volumes that were randomly selected, and ICC was assessed for ABC/2 and planimetry, respectively. For the quantitative assessment of CT findings, Cohen’s kappa coefficient was calculated. It was evaluated for hematoma locations, intraventricular extension of hematoma, and angiography spot sign.
Wilcoxon signed-rank test and Pearson’s correlation coefficient were applied to analyze the relationship between ABC/2 and planimetry. The area under the receiver operating curve (AUC), sensitivity, and specificity in predicting hematoma expansion with the 9-point and BRAIN scores were calculated. Two AUCs were compared using DeLong test.
To investigate the influence of various factors on ABC/2 volumetric estimation, additional analyses were conducted. Patients were stratified according to hematoma volume as evaluated by planimetry (<15 ml, 15–30 ml, >30 ml), hematoma location (deep ICH, lobar ICH), and anticoagulant use. Measurement errors in hematoma volume between ABC/2 and planimetry were compared within each group using Mann-Whitney U test or Kruskal-Wallis rank sum test.
p values less than 0.05 were considered significant. All statistical analyses were performed using EZR (Saitama Medical Center, Jichi Medical University, Saitama, Japan).
Results
Table 2 summarizes the assessments of baseline and follow-up CT scans. Hematoma expansion was observed in 75 patients (17.5%). The ICCs for hematoma volume measurements with ABC/2 and planimetry were 0.920 (95% confidence interval [CI], 0.875–0.950) and 0.951 (95% CI, 0.839–0.978), respectively. Cohen’s kappa coefficients for the CT findings of hematoma locations, intraventricular extension of hematoma, and angiography spot sign were 0.914 (95% CI, 0.882–0.946), 0.868 (95% CI, 0.820–0.916), and 0.723 (95% CI, 0.591–0.855), respectively.
Baseline and follow-up CT analyses. .
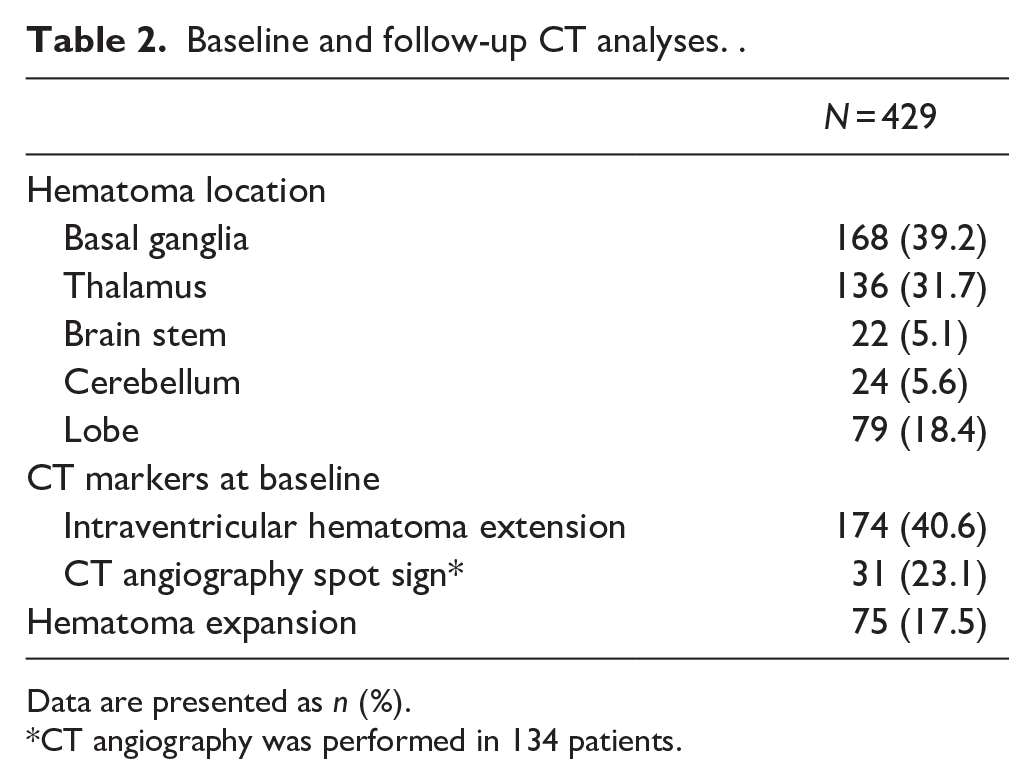
Data are presented as n (%).
CT angiography was performed in 134 patients.
The median hematoma volume measured by ABC/2 was 11.97 ml (interquartile range (IQR), 4.8–30.0), while the volume measured by planimetry was 11.70 ml (IQR, 4.9–26.6). A significant difference was observed by Wilcoxon signed-rank test (p < 0.001). The median measurement error between ABC/2 and planimetry was 0.30 ml (IQR, −0.72–2.87). ABC/2 overestimated hematoma volume in 244 patients (56.9%) compared to planimetry. Pearson’s correlation coefficient between ABC/2 and planimetry was 0.965 (95% CI, 0.958–0.971), showing a very strong correlation (Figure 2).
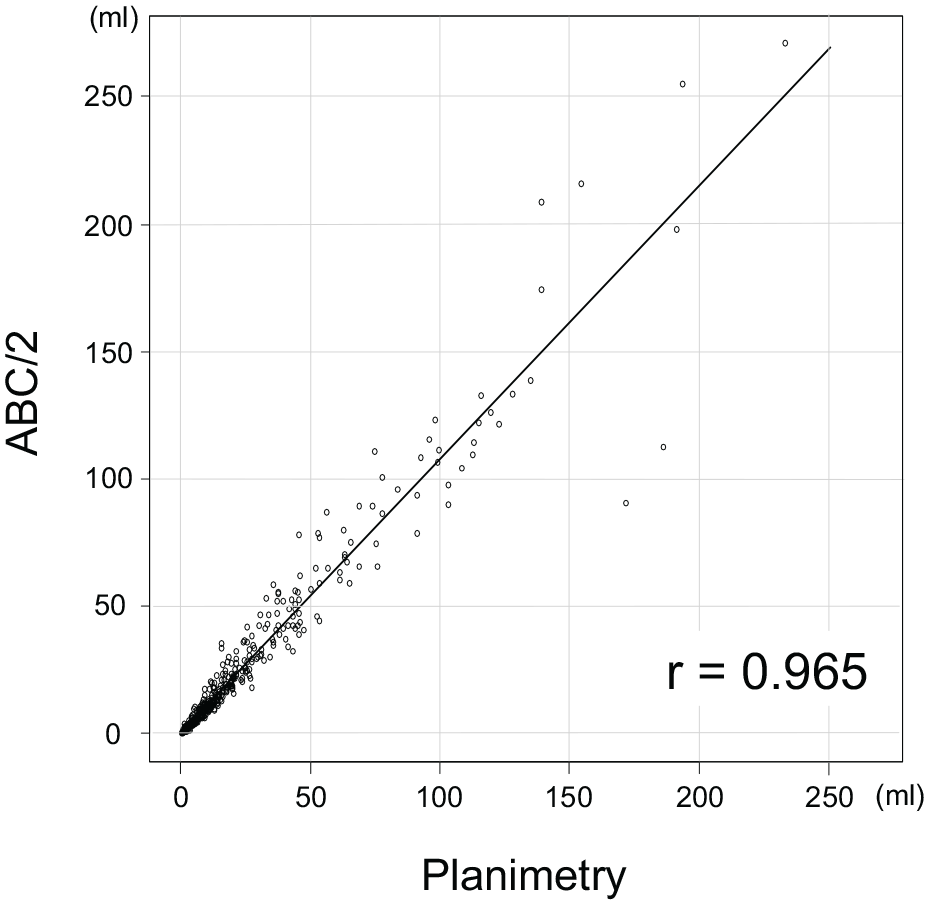
Pearson’s correlation coefficient between ABC/2 and planimetry for hematoma volume.
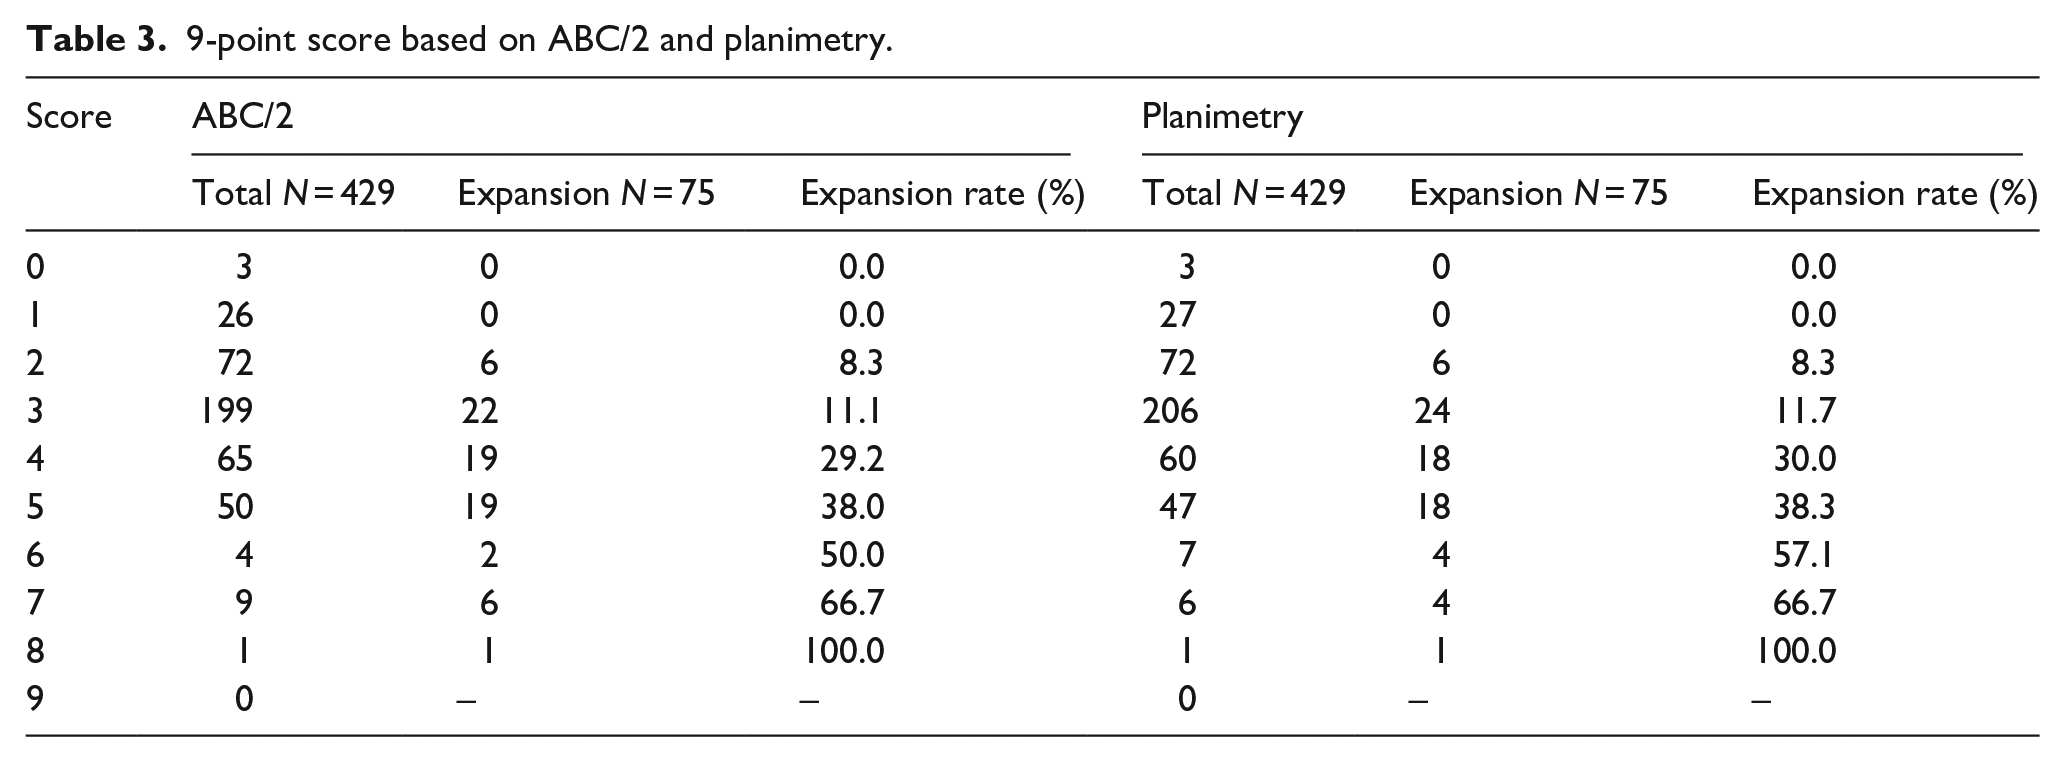
The 9-point score derived from ABC/2 and planimetry is summarized in Table 3. The AUCs for predicting hematoma expansion were 0.735 (95% CI, 0.675–0.796) with ABC/2 and 0.732 (95% CI, 0.672–0.793) with planimetry (Figure 3(a)). No significant difference was found between the AUCs by DeLong test (p = 0.647). With a cutoff value of 4, sensitivity and specificity for ABC/2 were 0.627 and 0.768, and those for planimetry were 0.600 and 0.785.
9-point score based on ABC/2 and planimetry.
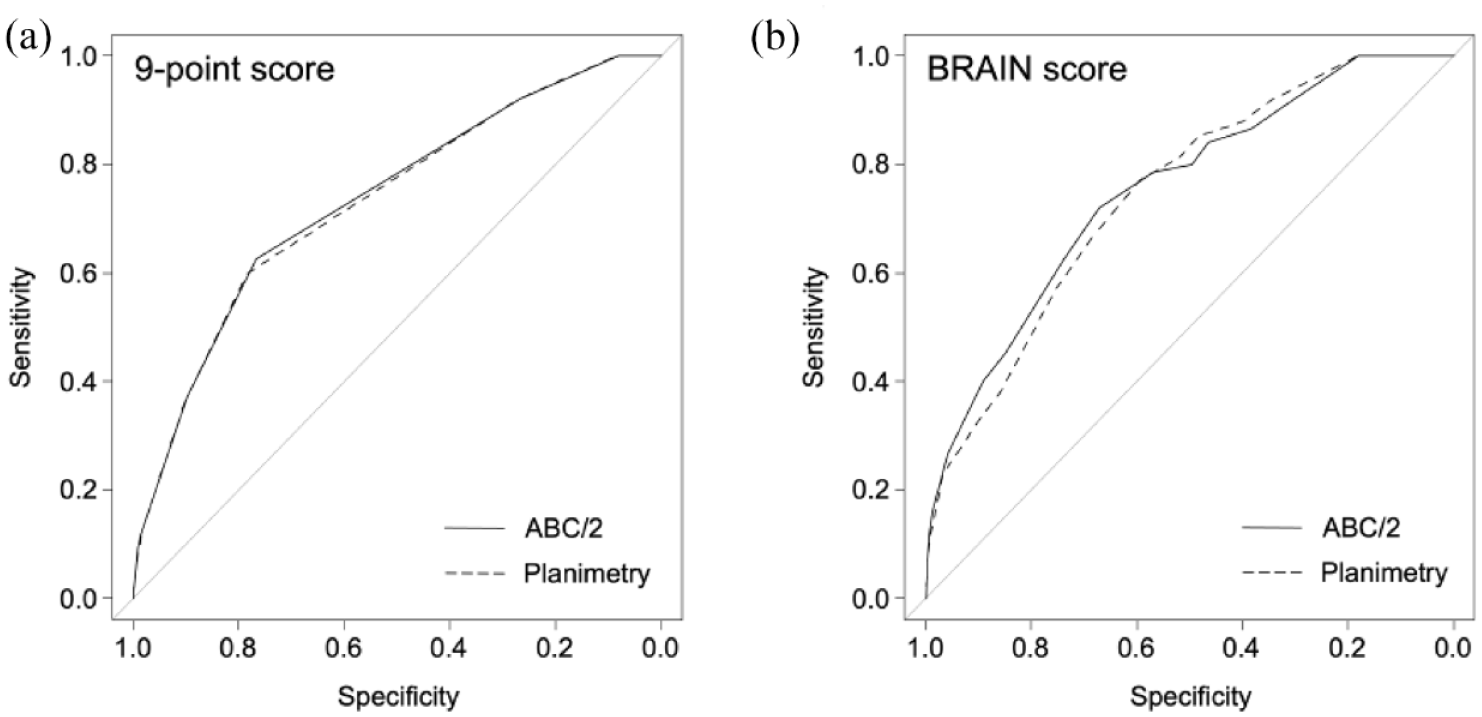
(a) The receiver operating curve (ROC) in predicting hematoma expansion with the 9-point score. The area under the ROCs (AUCs) were 0.735 for ABC/2 and 0.732 for planimetry and (b) the ROC with the BRAIN score. The AUCs were 0.754 for ABC/2 and 0.745 for planimetry.
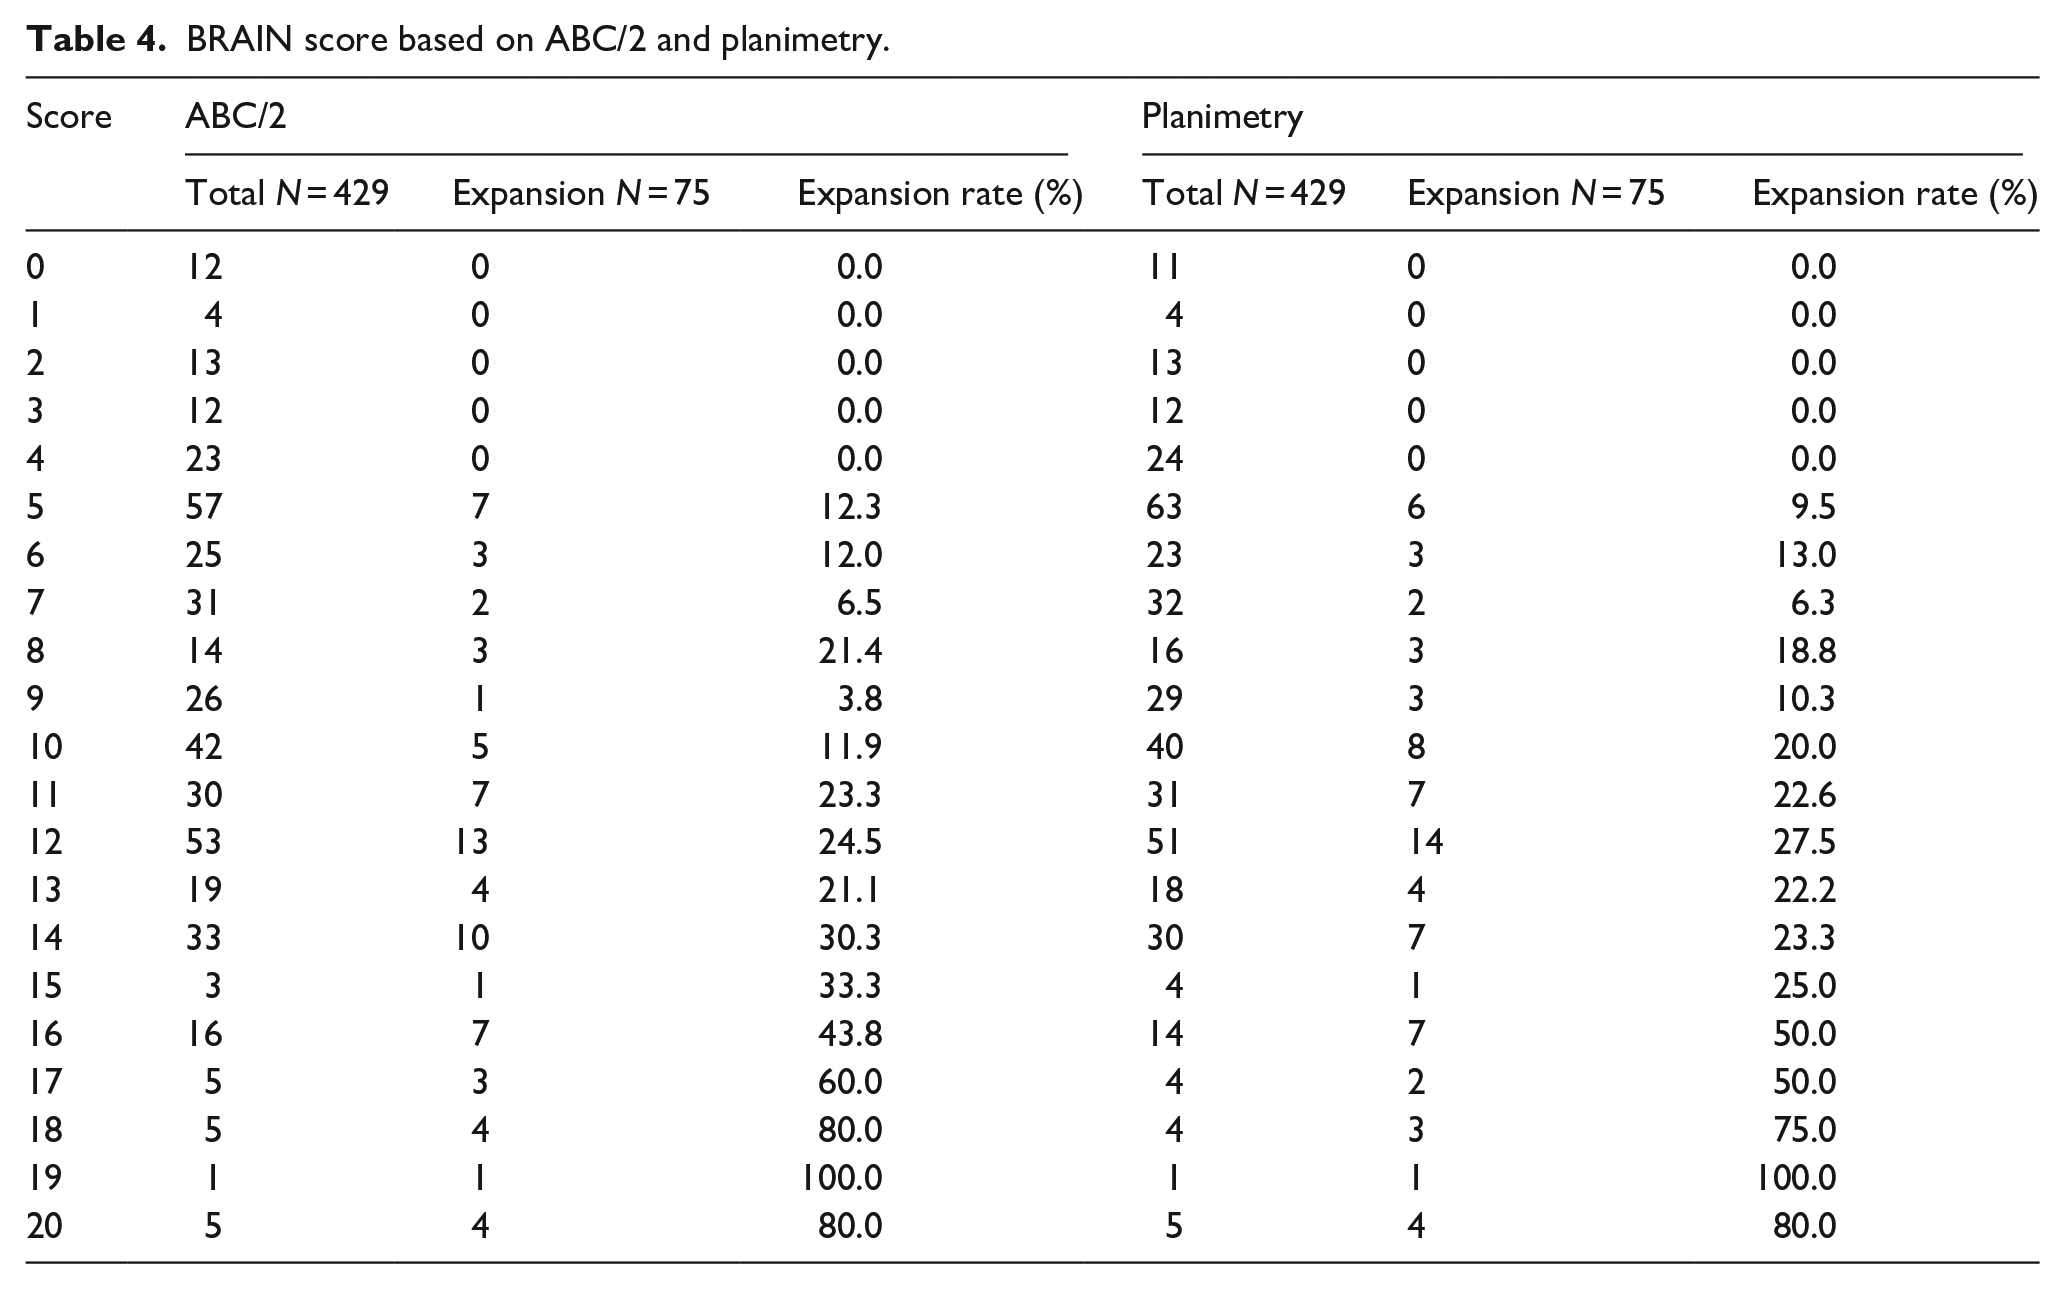
The BRAIN score is summarized in Table 4. The AUCs were 0.753 (95% CI, 0.693–0.813) for ABC/2 and 0.745 (95% CI, 0.688–0.803) for planimetry (Figure 3(b)). DeLong test showed no significant difference between the AUCs (p = 0.445). With a cutoff value of 10, sensitivity and specificity for ABC/2 were 0.787 and 0.568, and those for planimetry were 0.773 and 0.593.
BRAIN score based on ABC/2 and planimetry.
Hematoma volumes by ABC/2 and planimetry and their measurement errors are summarized in Table 5, stratified by hematoma volume as determined by planimetry (<15 ml, 15–30 ml, >30 ml), hematoma location (deep ICH, lobar ICH), and anticoagulant use. Larger hematoma volume and lobar ICH were significantly associated with higher measurement error, whereas anticoagulant use was not. PT-INR on admission in patients with and without anticoagulant use were 1.32 (IQR, 1.10–1.66) and 0.96 (IQR, 0.92–1.02), respectively.
Hematoma volumes and measurement errors. .
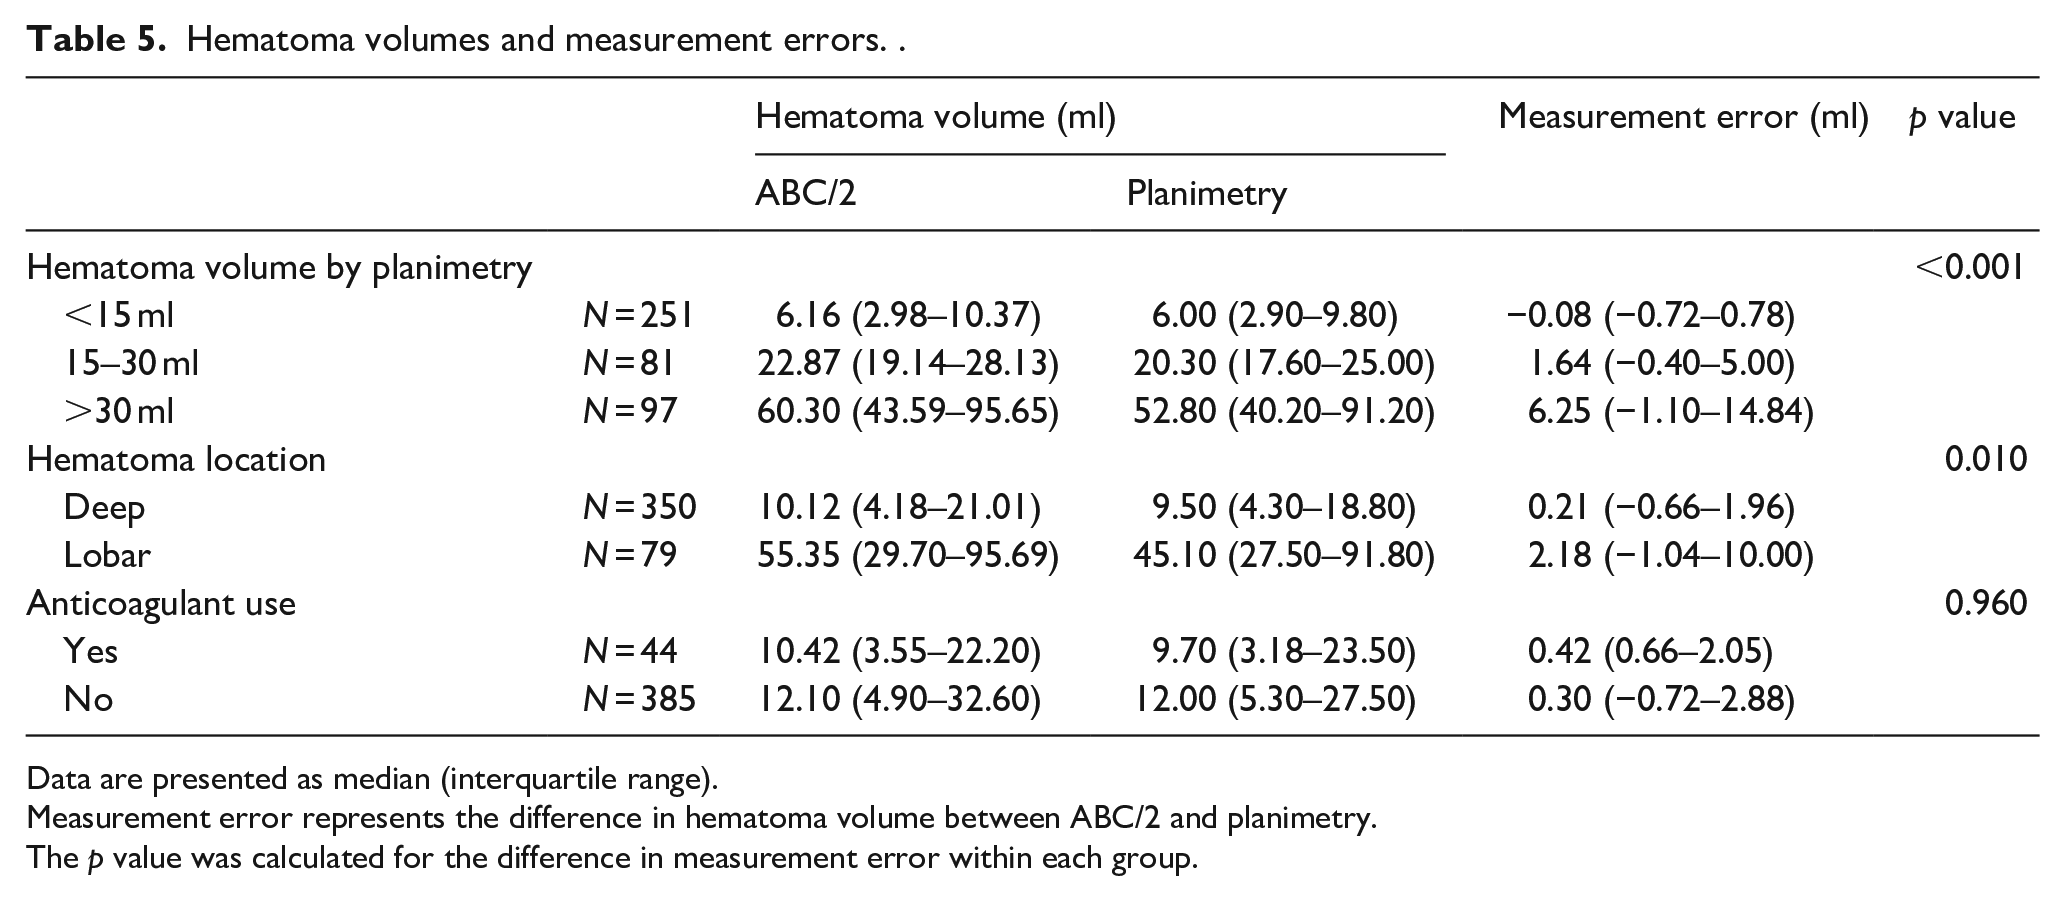
Data are presented as median (interquartile range).
Measurement error represents the difference in hematoma volume between ABC/2 and planimetry.
The p value was calculated for the difference in measurement error within each group.
Discussion
The 9-point and BRAIN scores using hematoma volume measured by ABC/2 and planimetry were effective in predicting hematoma expansion in spontaneous ICH. The ABC/2 volumetric estimation can be reliably used for these scores in clinical practice.
ABC/2 overestimated hematoma volume in more than half of the cases in this study, which was consistent with previous reports.27,28 However, the difference in median hematoma volume between ABC/2 and planimetry was subtle (11.97 ml vs 11.70 ml). In addition, the measurement error between them was 0.30 ml, which was very small. In both the 9-point and BRAIN scores, hematoma volume is divided into three categories: < 30 ml, 30–60 ml, and > 60 ml in the 9-point score; and 10 ml, 10–20 ml, and > 20 ml in the BRAIN score. Therefore, only hematoma volume around 30 ml and 60 ml in the 9-point score and around 10 ml and 20 ml in the BRAIN score influence the point assignment differences. Especially in the 9-point score, since the same point is assigned to hematoma volume less than 30 ml, many cases were not affected by the small difference in hematoma volume measurement between ABC/2 and planimetry. The receiver operating curves were almost overlapping (Figure 3(a)), and the score distributions were very similar (Table 3). On the other hand, in the BRAIN score, the influence of hematoma volume on the point assignment was greater in many cases than in the 9-point score because of the lower volume setting in the hematoma volume component. However, when points from the other components were included, the AUCs and score distributions became relatively similar (Figure 3(b) and Table 4).
Although the scoring system, such as the 9-point and BRAIN scores, is a conventional method for predicting hematoma expansion, it is still valuable because of its ease of application in clinical practice. In major hospitals in developed countries, the artificial intelligence-based systems for predicting the clinical course of patients will be introduced in the not-so-distant future. Many studies have addressed the prediction of hematoma expansion using radiomics, machine learning, and neural networks; these methods will be integrated into medical record or imaging systems.20,21,23 –26 However, in developing countries or rural areas, the introduction of the latest technology is usually delayed. In this study, the BRAIN score based on ABC/2 showed good AUC and sensitivity. It will continue to help clinicians for some time yet as an easy-to-use method for clinical decision making to select patients with ICH for admission to the intensive care unit or referral to specialists.
To date, 10 scoring systems have been reported to predict hematoma expansion. 32 Of these, the following four scoring systems included hematoma volume for prediction: 9-point score, BRAIN score, HEAVN score, and Basal Ganglia Score.8,11,33,34 The 9-point and BRAIN scores were developed using prospective cohort data and validated with external data, whereas the HEAVN and Basal Ganglia Scores were developed with single-center retrospective data and have not been externally validated.8,11,30,33 –35 Therefore, the latter two were deemed ineligible for evaluation and were not included in this study.
In the additional analyses to identify factors influencing the measurement error between ABC/2 and planimetry, larger hematoma volume and lobar hemorrhage were significantly associated with higher measurement error. This finding was consistent with previous reports.27,28 Anticoagulant use was not associated with measurement error, which may be due to the relatively smaller hematoma volume observed in patients on anticoagulants. The effect of anticoagulant use on hematoma volume at admission depends on the PT-INR, with PT-INR ⩽ 3.0 having no effect.36,37 In this study, the median PT-INR in patients on anticoagulants was 1.32, which did not result in increased hematoma volume at admission.
There are several limitations to note. First, the results of this study were based on the retrospective cohort. Prospective data collection will provide more reliable results. Second, this study included only patients from Japan, which introduces a potential bias in patient background. However, it focused on technical aspects of hematoma volume measurement rather than the disease itself and had a sufficient sample size with diverse hematoma locations and volumes. Therefore, the results may be generalizable and applicable to patients worldwide. Third, the proportion of patients who underwent CT angiography was lower in this study (31.2%) compared to the original article that developed the 9-point score (46.1%). Given that the CT angiography spot sign is one of the strongest predictors of hematoma expansion, it would have been desirable to include more patients with CT angiography. Forth, the number of patients with a score of 6 or more in the 9-point score and with a score of 17 or more in the BRAIN score was small. More patients with the higher scores are required for more accurate investigations.
Conclusion
The 9-point and BRAIN scores for predicting hematoma expansion in spontaneous ICH using hematoma volume measured by ABC/2 and planimetry showed good performance. ABC/2 volumetric estimation proved to be reliable for measuring hematoma volume in these scoring systems.
Footnotes
Acknowledgements
None.
Declaration of conflicting interests
The author(s) declared no potential conflicts of interest with respect to the research, authorship, and/or publication of this article.
Funding
The author(s) received no financial support for the research, authorship, and/or publication of this article.
Ethical approval
This study was approved by the following institutional review boards: Mie University Hospital institutional review board (REC number: T2023-7), Mie Chuo Medical Center institutional review board (REC number: MCERB-202321), Matsusaka Chuo General Hospital institutional review board (REC number: 325), and Suzuka Kaisei Hospital institutional review board (REC number: 2020-05).
Informed consent
Individual informed consent was waived by the institutional review boards due to the retrospective nature of this study.
Guarantor
ST.
Contributorship
ST reviewed the literature and designed the study. FI, KT, TA, and HS were involved in protocol development and ethical approval. ST, TY, TK, and MI collected and interpreted the data. YK and YN performed the data analysis. OUA, AH, and DF validated the data analysis. ST wrote the first draft of the manuscript. All authors reviewed, edited, and approved the final version of the manuscript.