
Abstract
Introduction:
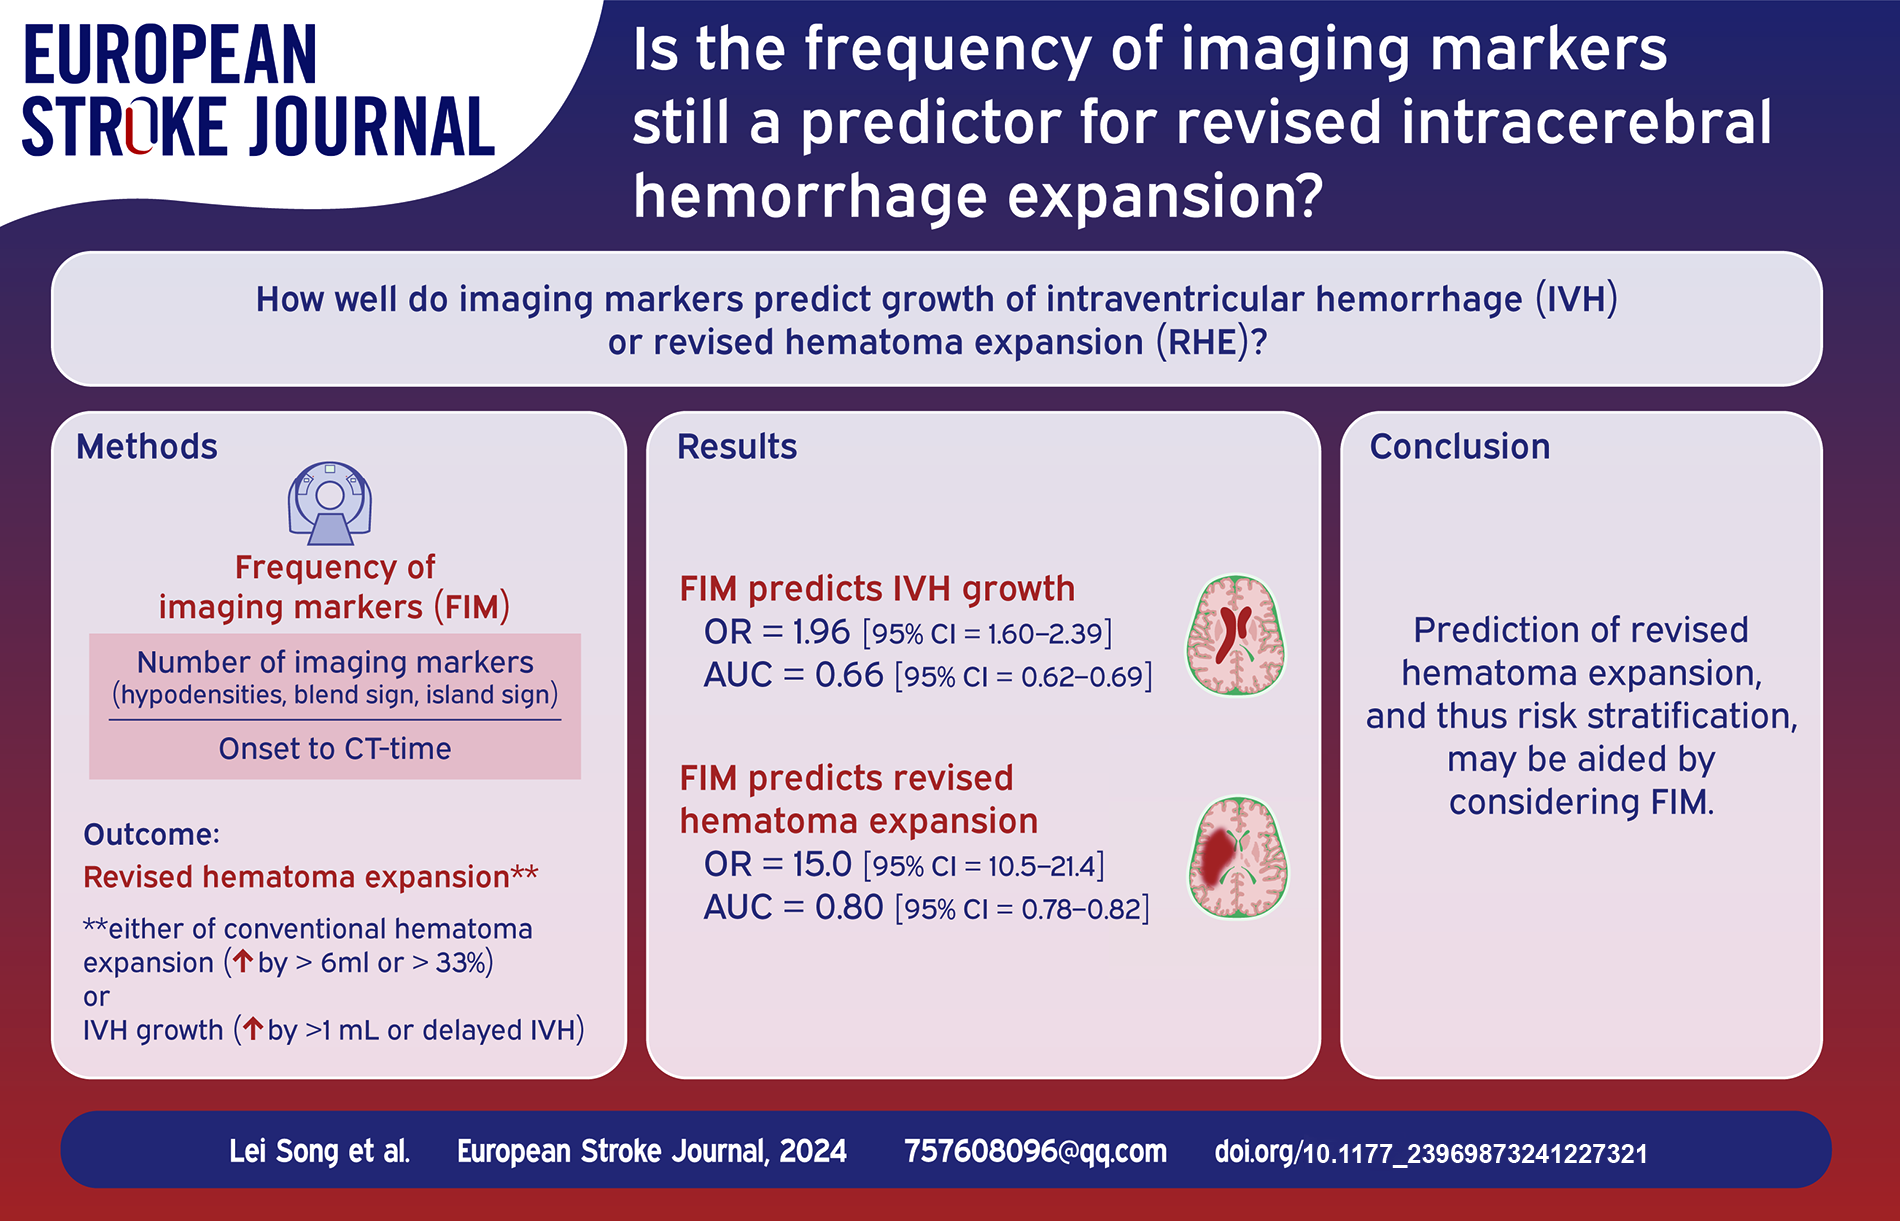
Frequency of imaging markers (FIM) has been described as a novel predictor for hematoma expansion after intracerebral hemorrhage (ICH). A revised definition of hematoma expansion that incorporates intraventricular hemorrhage (IVH) growth, that is, revised hematoma expansion (RHE), has also been proposed. Nevertheless, the associations between FIM and IVH growth or RHE remains unexplored. The objective of this study was to assess the influence and performance of the FIM on two types.
Materials and Methods:
Patient selection and variables were based on our published protocol. FIM was defined as the ratio of the number of imaging markers to the onset-to-neuroimaging time. The association between FIM and two definitions was tested by multivariate analysis. The area under the receiver operating characteristic curve (AUC), sensitivity, specificity, positive predictive value (PPV), and negative predictive value (NPV) of the FIM on two definitions were also evaluated.
Results:
There were 303 (20.36%) and 583 (39.18%) subjects in the IVH growth and RHE, respectively. Multivariate analysis demonstrated that FIM was associated with both IVH growth and RHE (odds ratio [OR] = 1.96, 95% confidence interval [CI] = 1.60–2.39; OR = 15.01, 95% CI = 10.51–21.43, respectively). The optimal cutoff points for FIM to predict IVH growth and RHE were 0.63 and 0.62, with AUC, sensitivity, specificity, PPV, and NPV of 0.66, 0.50, 0.78, 0.36, and 0.86 versus 0.80, 0.60, 0.93, 0.84, and 0.78, respectively.
Discussion and Conclusion:
FIM was not only a predictor of IVH growth, but also of RHE. These findings may have important clinical implications for decision-making based on risk stratification of patients with ICH.
Introduction
The incidence of intracerebral hemorrhage (ICH) is 10%–15% of all strokes, with 30-day mortality and 90-day disability being 40% and 60%, respectively. 1 Hematoma expansion is commonly defined as the growth of parenchymal hematoma from baseline to follow-up computed tomography (CT) scans, and is a primary determinant of worse outcomes in patients with ICH. 2 Of note, the dynamic change of intraventricular hemorrhage (IVH) is another cause of unfavorable prognosis. 3 Accumulating investigations have demonstrated that the inclusion of IVH growth into the conventional definition of hematoma expansion, that is, revised hematoma expansion (RHE), can boost the predictive accuracy of outcomes in patients with ICH.4 –6
Recently, an indicator termed the frequency of imaging markers (FIM) has been proposed for the prediction of hematoma expansion with better performance. 7 It is not clear whether the FIM can be used in predicting IVH growth or RHE. In this study, we aimed to confirm the links of FIM and IVH growth or RHE and further test their predictive performance.
Materials and Methods
Patient selection and variables
This was a multicenter, retrospective, observational cohort study of subjects with ICH between January 2018 and August 2022. Six centers from four cities across three Chinese provinces were involved in the study: Huangshi Central Hospital Affiliated to Hubei Polytechnic University, Xiangyang Central Hospital Affiliated to Hubei University of Arts and Science, Xiangyang No. 1 People’s Hospital Affiliated to Hubei University of Medicine, The First Affiliated Hospital and the Second Affiliated Hospital of Anhui Medical University, and Tangshan Gongren Hospital.
Eligible patients with ICH were aged >18 years with onset-to-CT time ⩽6 h, and within 48 h by a follow-up CT scan. The exclusion criteria consisted of the existence of trauma, brain tumor, vascular malformation, hemorrhagic transformation of cerebral infarction, or any other cause of secondary ICH. Also, the following criteria were excluded from the present study: unclear onset, primary IVH, supratentorial multiple hematomas, infratentorial (brainstem and cerebellum) hematoma, anticoagulation-associated ICH, surgical evacuation of hematoma before the follow-up CT, missing follow-up CT, and images with severe motion artifacts.
Baseline parameters collected from electronic medical records included age, sex, alcohol, smoking, glucose, platelet count, international normalized ratio, Glasgow Coma Scale score, systolic and diastolic blood pressures, and hematoma sites (basal ganglia, thalamus, lobar).
Neuroimaging
A schematic diagram of the FIM is presented in Figure S1 (see Supplemental File). According to our previous study, FIM was calculated as the ratio of the number of imaging markers to the onset-to-CT time. 7 Neuroimaging markers in the current analysis were hypodensities 8 (hypodense area completely encased within the hematoma without concern for its size, morphology, or density), blend sign 9 (hyper- and hypo-attenuating regions of the hematoma with a density difference of ⩾18 Hounsfield Unit and an identifiable border), and island sign 10 (the presence of ⩾3 scattered or ⩾4 connected small hematomas around the main hematoma). Presence of one or more marker was defined as the presence of ⩾1 of the above-mentioned markers, as previously reported. 11 The simultaneous occurrence of ⩾2 of the above-mentioned markers was considered combined markers.
All ICH volumes at initial and follow-up CTs were measured independently by radiologists (blinded to clinical information) with 10 and 5 years of CT experience respec-tively. In order to reach a consensus, both reviewed the final volume and used the mean of both to determine the final result. An experienced radiologist and stroke neurologist (with 10 and 5 years of experience, respectively), who were blinded to clinical information, independently reviewed the imaging markers. In cases of inconsistency, consensus was reached by a third senior neuroradiologist with 20 years of experience. To differentiate imaging markers from partial volume effect, especially hypodensities, if deemed neces-sary, manual adjustments were made in the coronal and sag-ittal positions.
Outcome
IVH growth was defined as either absolute IVH growth >1 mL by comparing the initial and follow-up CTs or any IVH on the follow-up CT but without the presence of IVH on the initial CT,3,6 while RHE was defined as IVH growth or the growth of intraparenchymal hematoma volume (absolute value > 6 mL or relative value > 33%) between the two CTs. Briefly, subjects with any one of the four types (a relative increase of >33% or an absolute increase of >6 mL in hematoma volume, or an absolute increase of >1 mL in IVH volume, or any IVH volume on follow-up CT) were classified as the “RHE” group.
Statistical analysis
Mean (standard deviation [SD]) and median (interquartile range [IQR]) were used to describe continuous variables, while count (%) for categorical data. The univariate analysis was performed using Student’s t-test, Mann–Whitney U test, Chi-squared test, or Fisher’s exact test as appropriate. Multivariate logistic regression analysis was performed to determine the associations between the FIM and IVH growth, FIM and RHE by including variables with p ⩽ 0.1 in the univariate analysis. Results for logistic regressions were expressed as odds ratio (OR) and 95% confidence interval (CI). The area under the receiver operating characteristic curve (AUC) with 95% CI, sensitivity, specificity, and positive and negative predictive values (PPVs and NPVs) were also calculated to evaluate the predictive performance of FIM for IVH growth or RHE. The best cutoff value for FIM was determined by the Youden index that defined as the sum of sensitivity and specificity minus 1. AUCs of the different predictors were compared using the DeLong’s test. All statistical tests were two-sided, with p < 0.05 indicating statistical significance. Statistical analyses were conducted in R statistical software (version 4.0.3).
Results
The baseline characteristics of inclusion and exclusion criteria were largely similar (Supplemental Table S1). In total, 1488 participants with ICH consisting of 962 males and 526 females, were included in this study. Participants’ mean (SD) age was 61.20 (12.42) years. There were 303 (20.36%) and 583 (39.18%) subjects in the IVH growth and RHE, respectively. The FIM values were significantly different between patients with no IVH growth and IVH growth groups (median, 0.22 [IQR, 0.00–0.58] vs. 0.62 [IQR 0.00–1.15], p < 0.001) or patients with no RHE and RHE groups (median, 0.00 [IQR, 0.00–0.38] vs. 0.76 [IQR 0.33–1.24], p < 0.001). The other imaging metrics as hypodensities, blend sign, island sign, presence of one or more marker, and combined markers were also markedly different between patients in the presence/absence of IVH growth or RHE, with the exception of blend sign for IVH growth. The full results of the univariable analyses based on the definitions of IVH growth or RHE are shown in Table 1.
Univariate analysis for IVH growth or RHE.
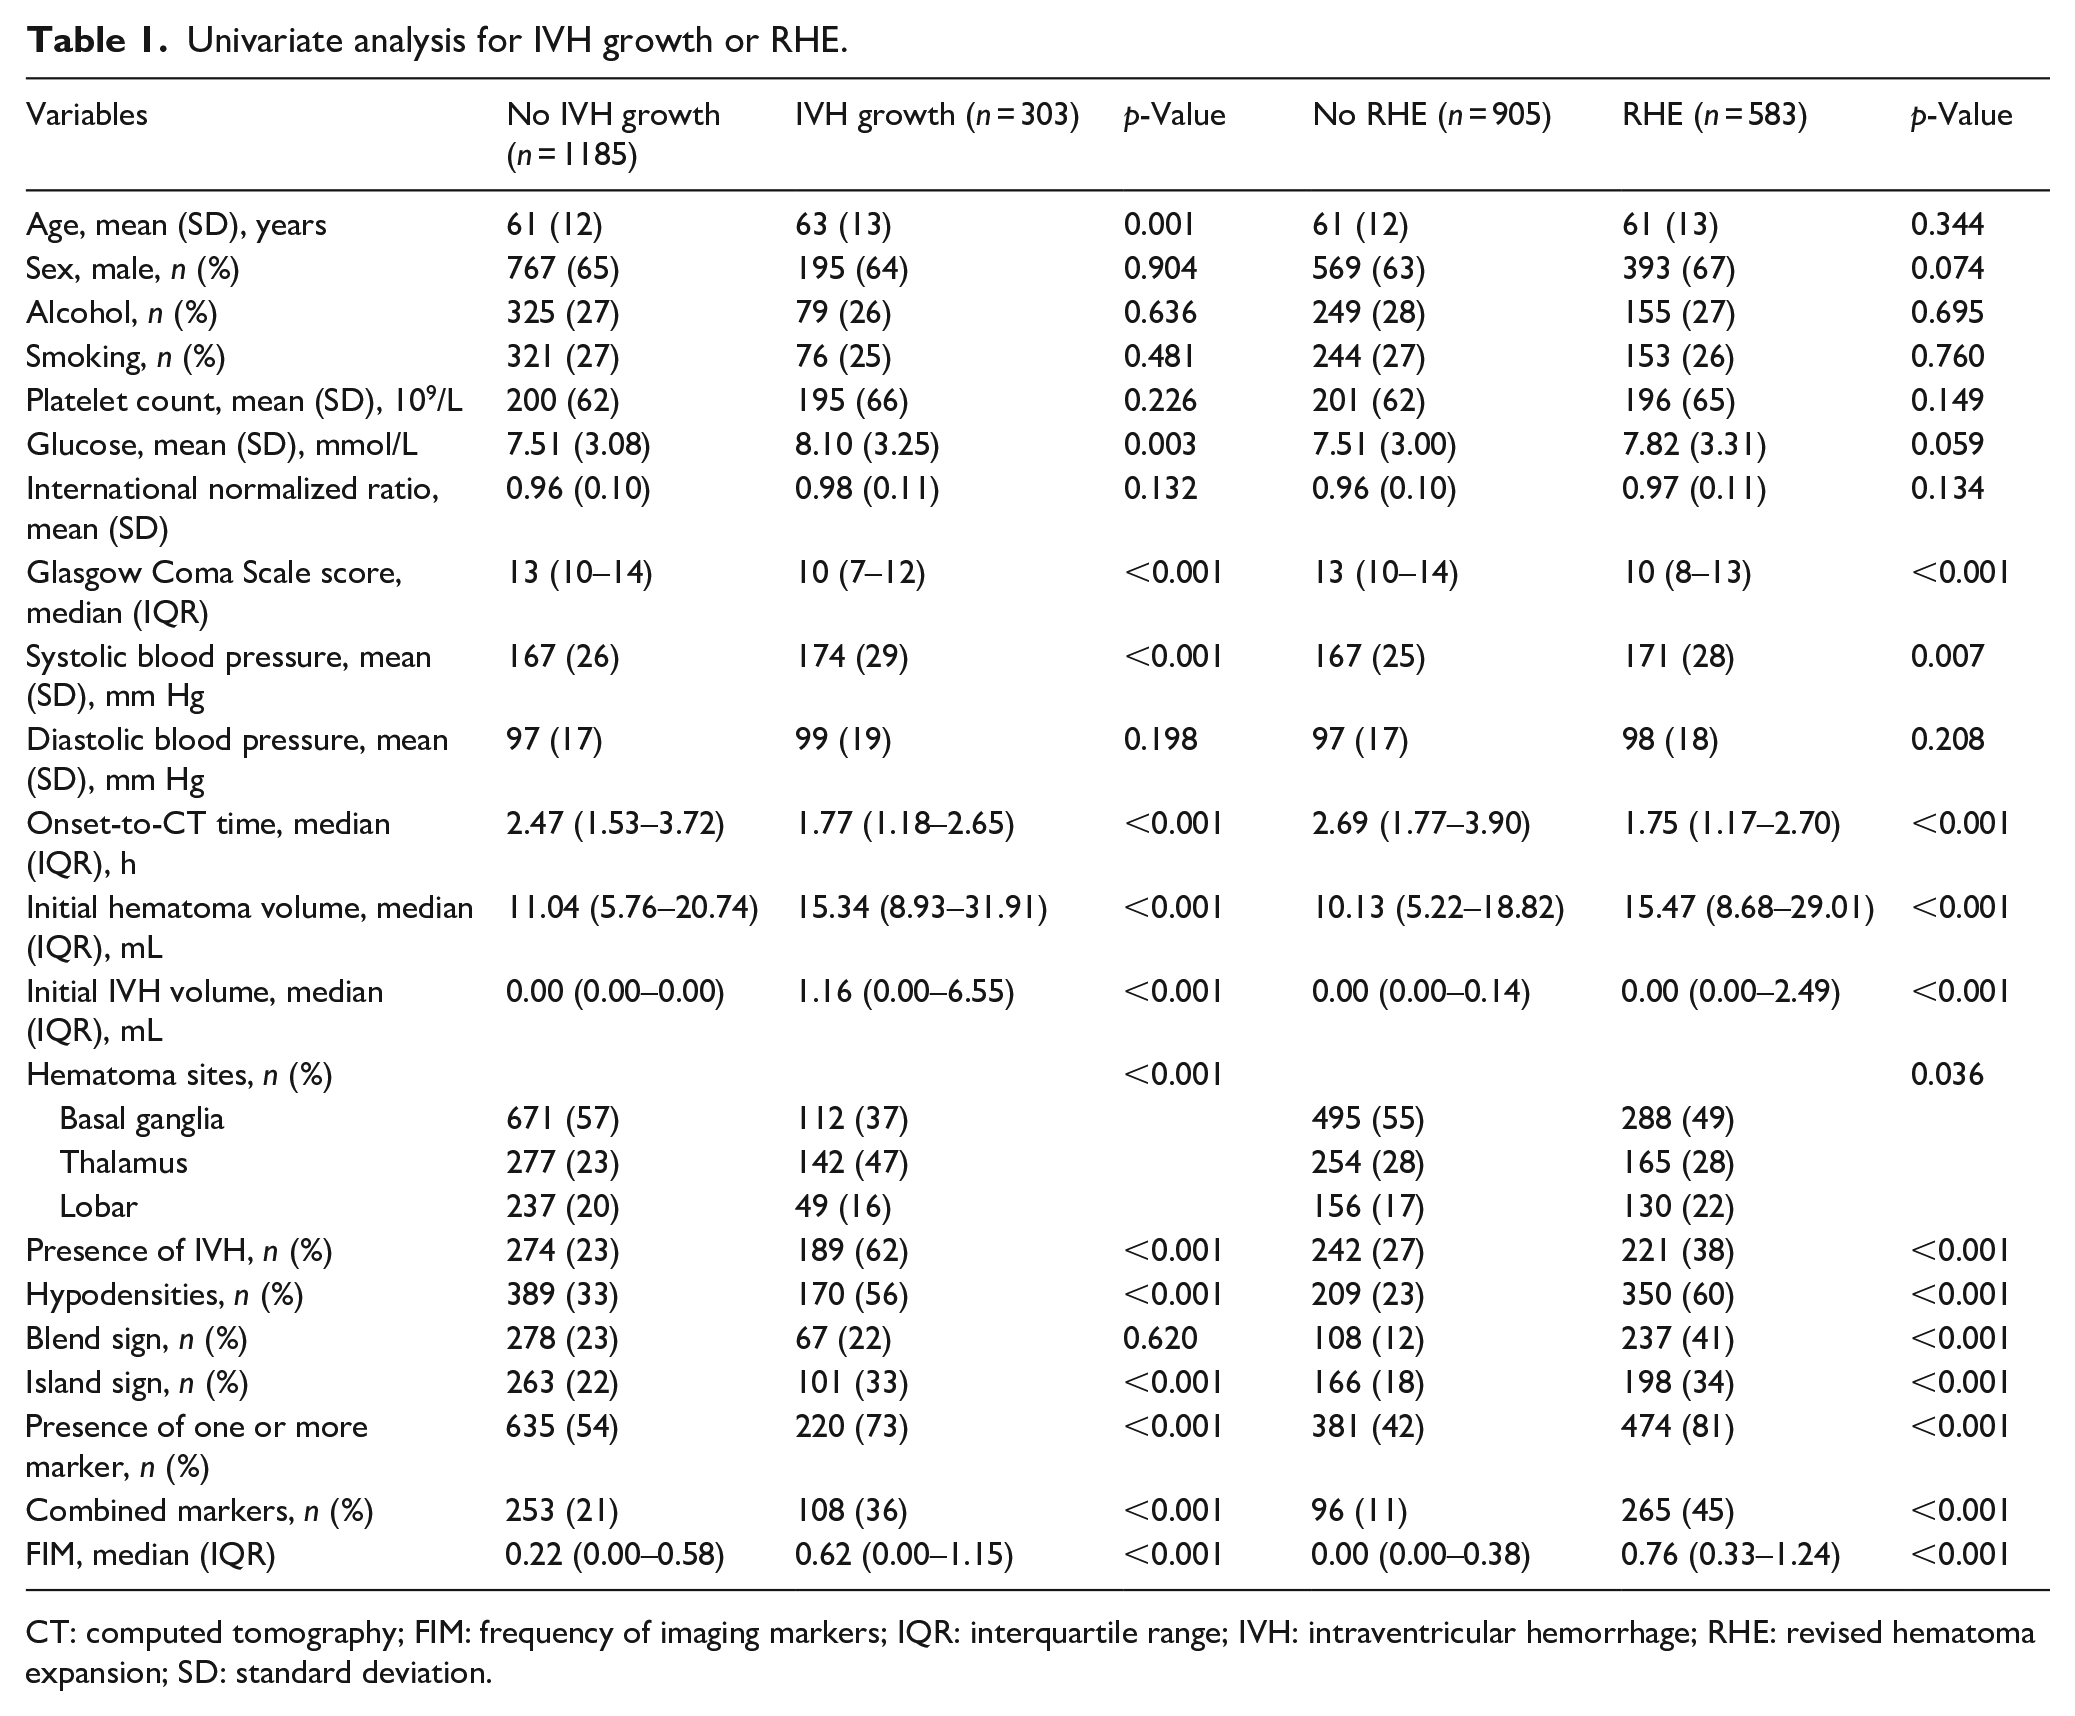
CT: computed tomography; FIM: frequency of imaging markers; IQR: interquartile range; IVH: intraventricular hemorrhage; RHE: revised hematoma expansion; SD: standard deviation.
Multivariate logistic regression analysis revealed the links (OR = 1.96 [95% CI = 1.60–2.39], p < 0.001 and OR = 15.01 [95% CI = 10.51–21.43], p < 0.001, respectively) between FIM and IVH growth and between FIM and RHE (see Table 2), after adjustment for potential confounding factors based on univariate results (p ⩽ 0.1). Meanwhile, the best cutoff values for FIM to predict IVH growth and RHE were 0.63 and 0.62, with AUC, sensitivity, specificity, PPV, and NPV of 0.66, 0.50, 0.78, 0.36, and 0.86 vs. 0.80, 0.60, 0.93, 0.84, and 0.78, respectively. Based on Delong’s test, FIM showed higher AUC both in predicting IVH growth or RHE than hypodensities, blend sign, island sign, presence of one or more marker, and combined markers (p < 0.05). The detailed predictive performances of the different predictors for IVH growth or RHE are summarized in Table 3 and Figures 1 and 2.
Multivariable analysis of factors associated with IVH growth or RHE.
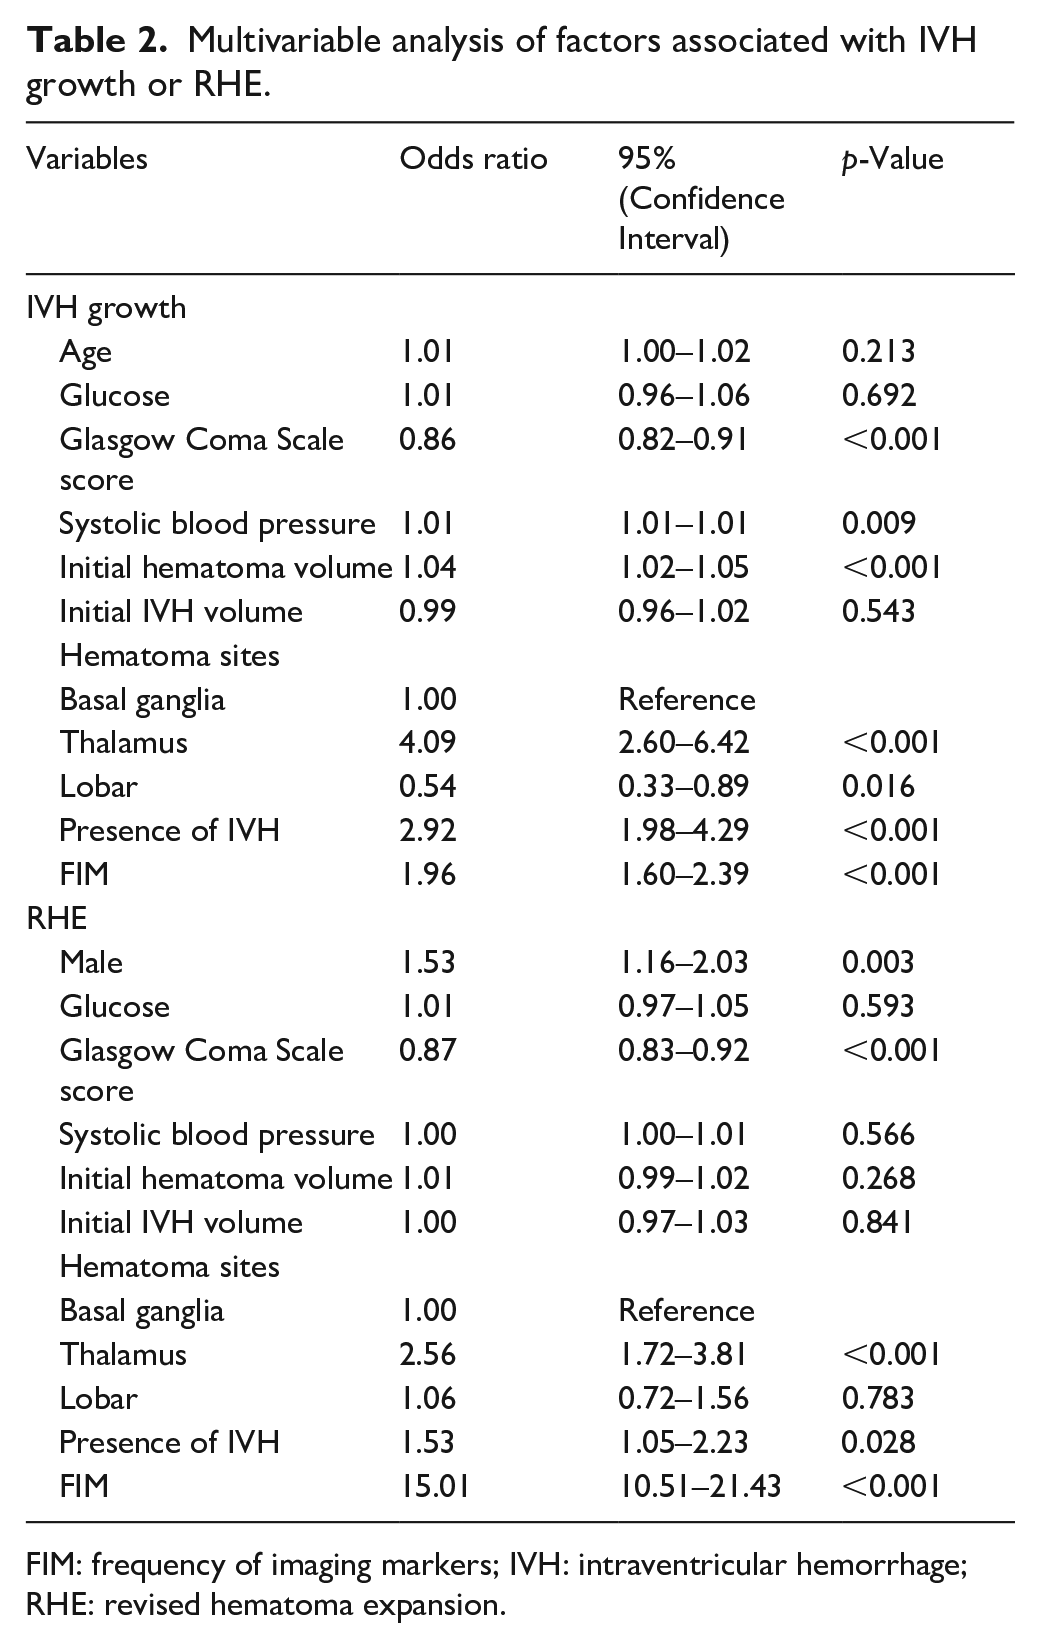
FIM: frequency of imaging markers; IVH: intraventricular hemorrhage; RHE: revised hematoma expansion.
Comparison of the predictive performance of FIM with other indicators.
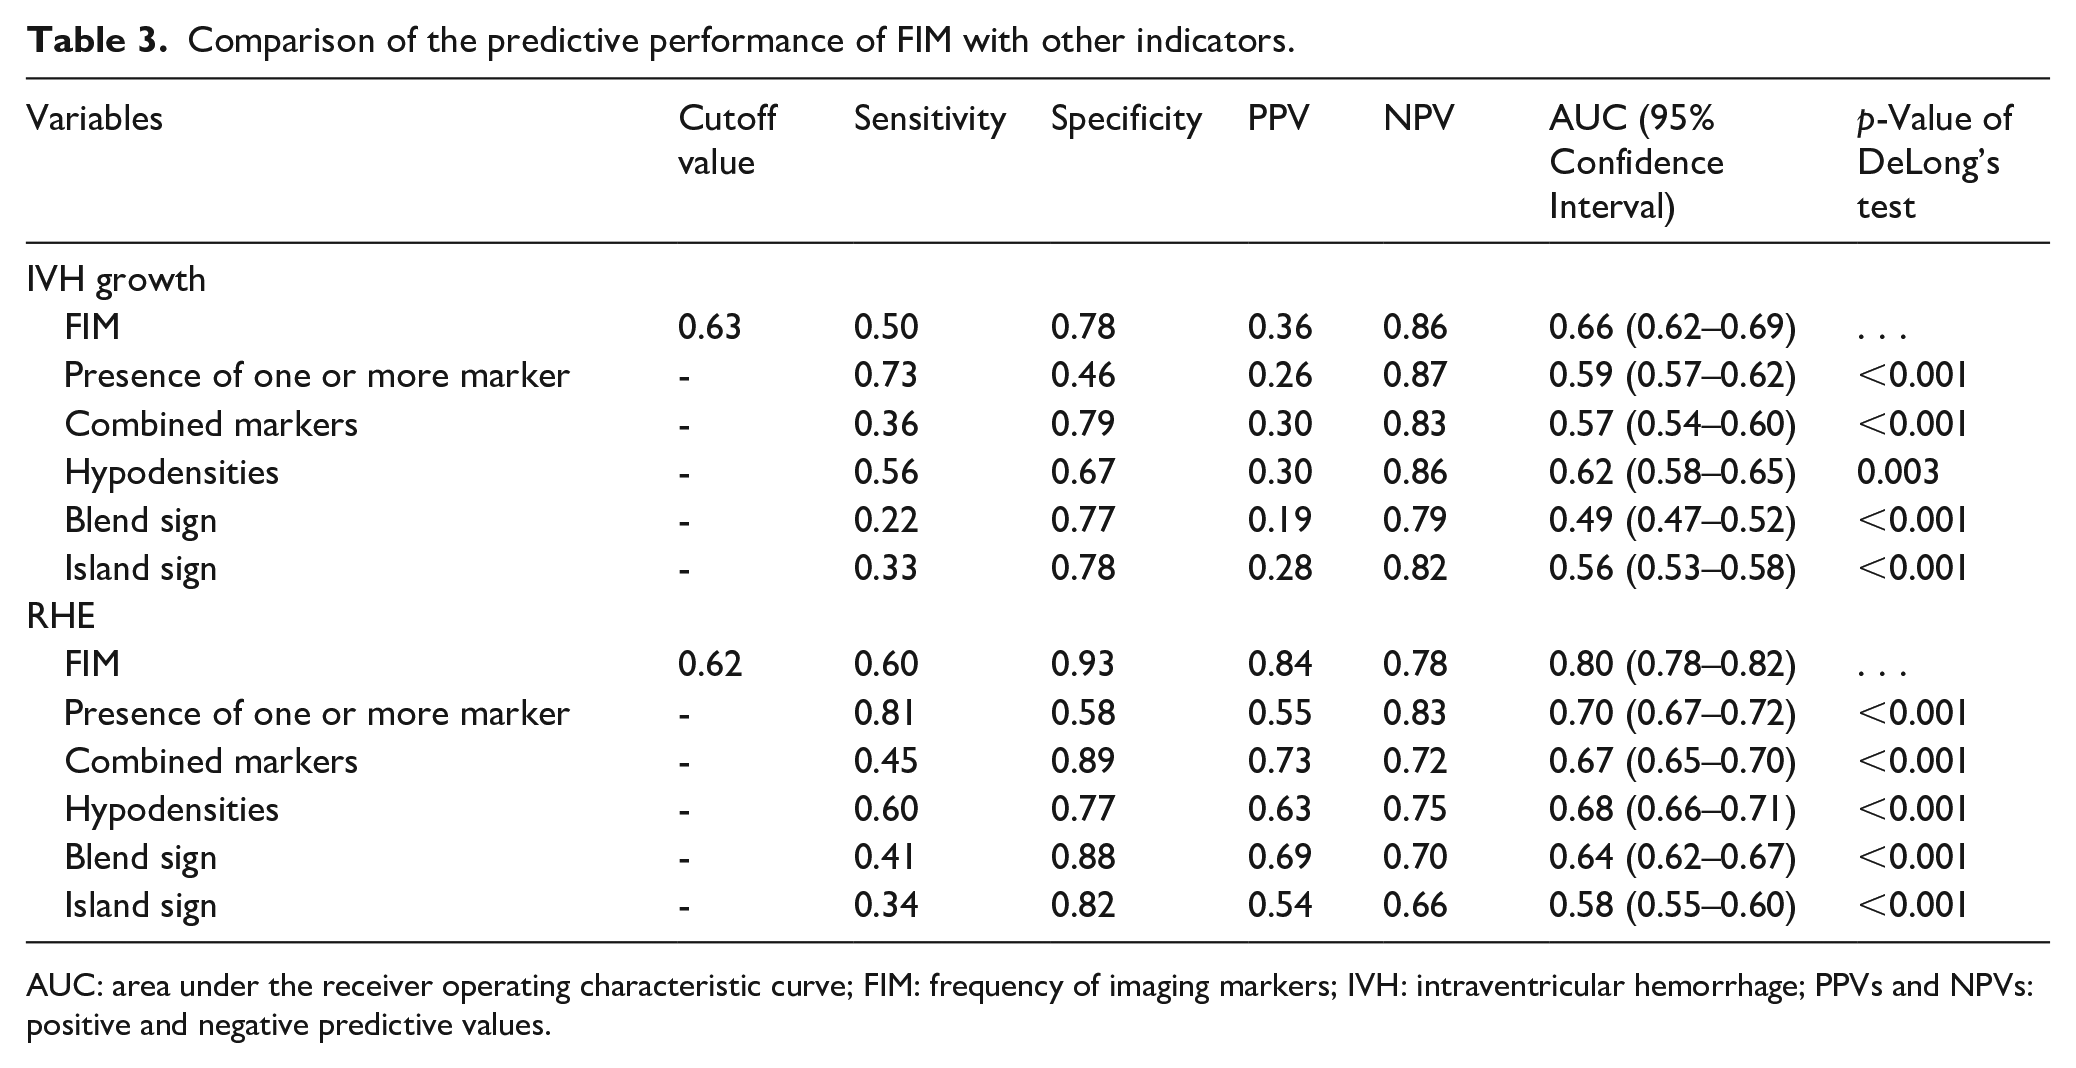
AUC: area under the receiver operating characteristic curve; FIM: frequency of imaging markers; IVH: intraventricular hemorrhage; PPVs and NPVs: positive and negative predictive values.
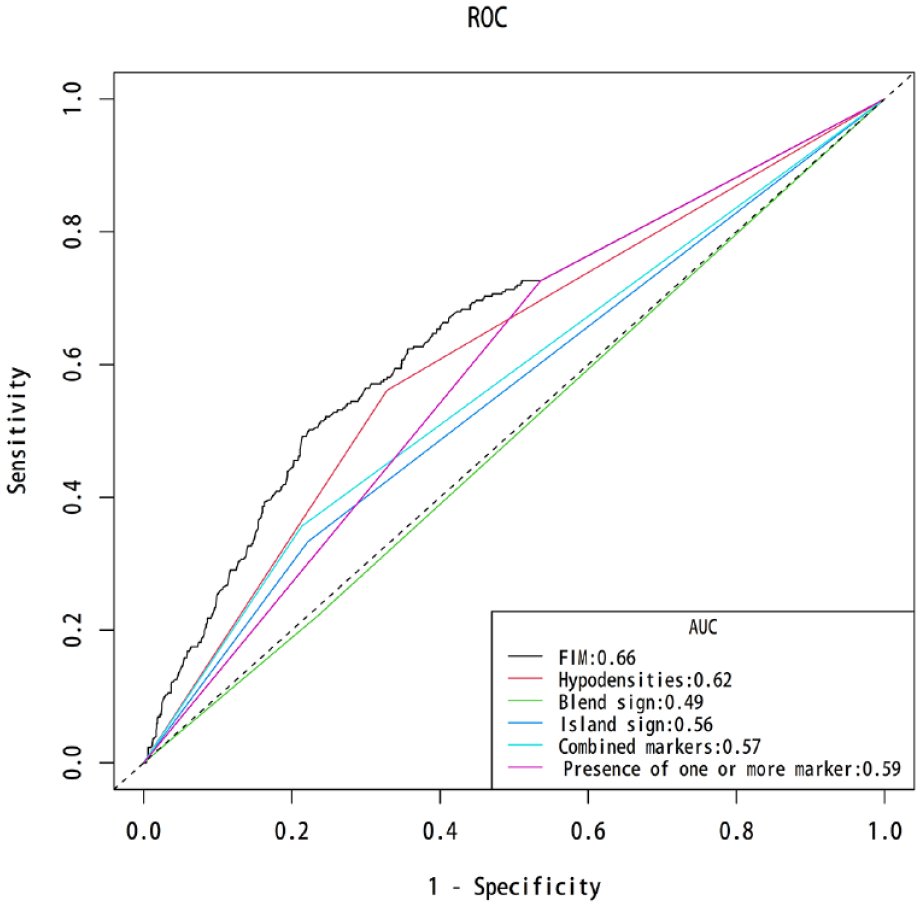
Area under the receiver operating characteristic curve comparisons across the different indicators for intraventricular hemorrhage growth.
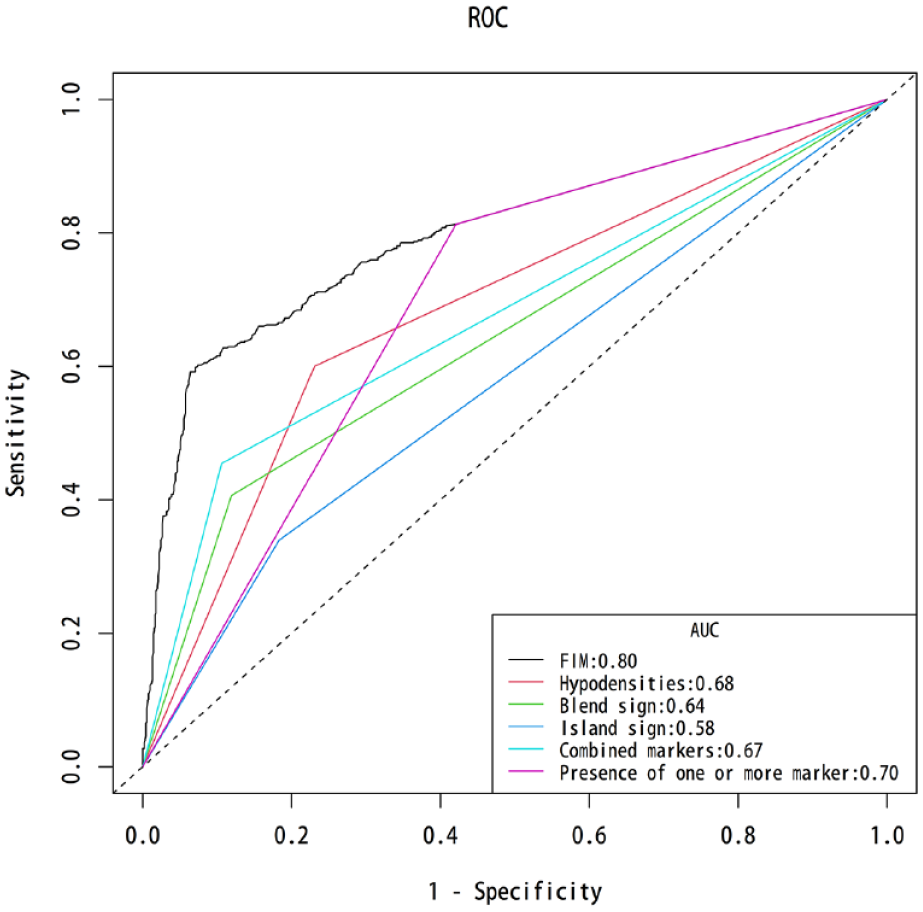
Area under the receiver operating characteristic curve comparisons across the different indicators for revised hematoma expansion.
Discussion
In this investigation, we confirmed that FIM not only served as an alternative to the prediction of IVH growth but also RHE. Overall, FIM performed significantly better for predicting two types than all the other predictors. The inclusion of IVH growth into the definition of hematoma expansion may yield better predictive performance. Patients with ICH may benefit from our findings in terms of risk stratification.
Consistently, hematoma expansion is believed to attribute to poor outcome after ICH. 12 Despite progress in curbing hematoma expansion, clinical trial interventions have not significantly improved patient outcomes.13,14 The presence of IVH occurs in 40% of ICH patients and is another factor that can contribute to dismal prognosis. 15 Previous studies have established that IVH growth (an increase of IVH volume by comparing the initial and follow-up CTs or as a delayed development of IVH on subsequent CT) is intimately tied to the with patients’ neurological outcomes.4,5 Yogendrakumar et al. 6 also proposed that the definition of RHE exhibit diagnostic accuracy in the prediction of worse outcome superior to the conventional definition of hematoma expansion. These studies collectively indicated that recognition of RHE is an important step toward precision medicine for treatment target with the potential to improve outcomes in patients with ICH.
The search for imaging markers that could predict the risk of hemorrhagic growth after ICH has been a hot research topic, such as density and shape features on non-contrast CT.16,17 Although attractive, the predictive performance of a single sign usually does not perform well. 17 A first proposal for FIM in 2023 was by Song et al., 7 which is defined as the ratio of imaging markers to onset-to-CT time. They found that the novel index positively predicts hematoma expansion, with a good performance when the optimal FIM cutoff value is 0.63. The FIM metric highlights the advantage of the number of imaging markers that simultaneously take onset-to-CT time into consideration. However, the predictive value of FIM for RHE remains unclear. Li et al. 18 found that shorter onset-to-CT time was associated with IVH growth. In our study, we have verified that FIM was still an independent predictive factor for IVH growth, although a predictive AUC value of 0.66. Surprisingly, the prediction performance did not significantly reduce based on the definition of RHE compared with the conventional definition of hematoma expansion (AUC = 0.80 vs. 0.83). 7 The findings of our study complement the influence of FIM on IVH growth and RHE, and facilitate stroke physicians identify individuals with a high-risk of hemorrhagic growth who may benefit from early intervention.
A number of clinical implications may arise from our findings. Identifying the non-contrast CT markers for RHE could help initiate timely and appropriate therapy. 5 FIM can further optimize and improve the performance of conventional imaging markers for RHE. 4 This predictor is both simple and practical. It may be used as a new tool for risk stratification and clinical decision-making for patients with ICH to acute stroke imaging in the emergency care setting. 19 It is, alternately, helpful for future trials to identify patients at higher risk for precise treatment by using this novel metric. 20
Some limitations of the current analysis also need to be taken into account when interpreting our results. First, the study design involved retrospective observation, which inevitably led to selection bias and confounding. Our findings must be further validated by prospective studies in multicenter clinical trials. Second, the present results were an updated analysis of our previous study. A strict set of inclusion and exclusion criteria may not represent the entire population of patients with ICH. For example, anticoagulant-associated ICH was excluded from our study. A higher proportion of patients (onset-to-CT time > 6 h) were excluded, also introducing a potential source of bias. Third, a lack of standardization was also found in multicenter and multi-device regarding imaging acquisition and protocol. Determining whether imaging markers’ detection is affected by the spatial resolution of the CT images can be challenging.
Supplemental Material
sj-docx-1-eso-10.1177_23969873241227321 – Supplemental material for Is the frequency of imaging markers still a predictor for revised intracerebral hemorrhage expansion?
Supplemental material, sj-docx-1-eso-10.1177_23969873241227321 for Is the frequency of imaging markers still a predictor for revised intracerebral hemorrhage expansion? by Lei Song, Hang Zhou, Jun Cheng, Wenmin Guo, Yu Ye, Rujia Wang, Jiao Chen, Hui Xiong, Ji Zhang, Dongfang Tang, Liwei Zou, Lianghong Kuang, Xiaoming Qiu and Tingting Guo in European Stroke Journal
Footnotes
Acknowledgements
Tingting Guo is a former radiologist and was a great help in the study design during the initial preparation for this study. Without her, this study would not be possible.
Declaration of conflicting interests
The author(s) declared no potential conflicts of interest with respect to the research, authorship, and/or publication of this article.
Funding
The author(s) disclosed receipt of the following financial support for the research, authorship, and/or publication of this article: This work was supported by the Hubei Provincial Natural Science Foundation Innovation and Development Joint Fund (2023AFD016).
Ethical statement
The six hospitals were located in the provinces of Hubei (Huangshi Central Hospital, Xiangyang Central Hospital, and Xiangyang No. 1 People’s Hospital), Anhui (The First Affiliated Hospital and the Second Affiliated Hospital of Anhui Medical University), and Hebei (Tangshan Gongren Hospital), respectively. The Institutional Review Board at the local ethics committees granted an exemption to obtain informed consent due to the use of deidentified data (Ethics Approval ID: 2022-22, 2021-036, XYYYE20220081, PJ2022-09-30, YX2023-134, and GRYY-LL-KJ2022-K820, respectively).
Informed consent/Patient consent
The Ethics Committee exempted informed consent because of the retrospective nature of this research.
Author contribution statements
Hang Zhou, Wenmin Guo, Yu Ye, Rujia Wang, Jiao Chen, Hui Xiong, Ji Zhang, dongfang Tang, and Liwei Zou collected data. Tingting Guo and Xiaoming Qiu revised the final revision of the manuscript and supervised the study. Jun Cheng performed the data analysis. Lei Song designed the study, analyzed the data, interpreted the findings, and wrote the manuscript.
Trial registration number/date
Not applicable.
Grant number
2023AFD016
Data availability statement
Available on request.
Supplemental material
Supplemental material for this article is available online.
References
Supplementary Material
Please find the following supplemental material available below.
For Open Access articles published under a Creative Commons License, all supplemental material carries the same license as the article it is associated with.
For non-Open Access articles published, all supplemental material carries a non-exclusive license, and permission requests for re-use of supplemental material or any part of supplemental material shall be sent directly to the copyright owner as specified in the copyright notice associated with the article.