
Abstract
Background:
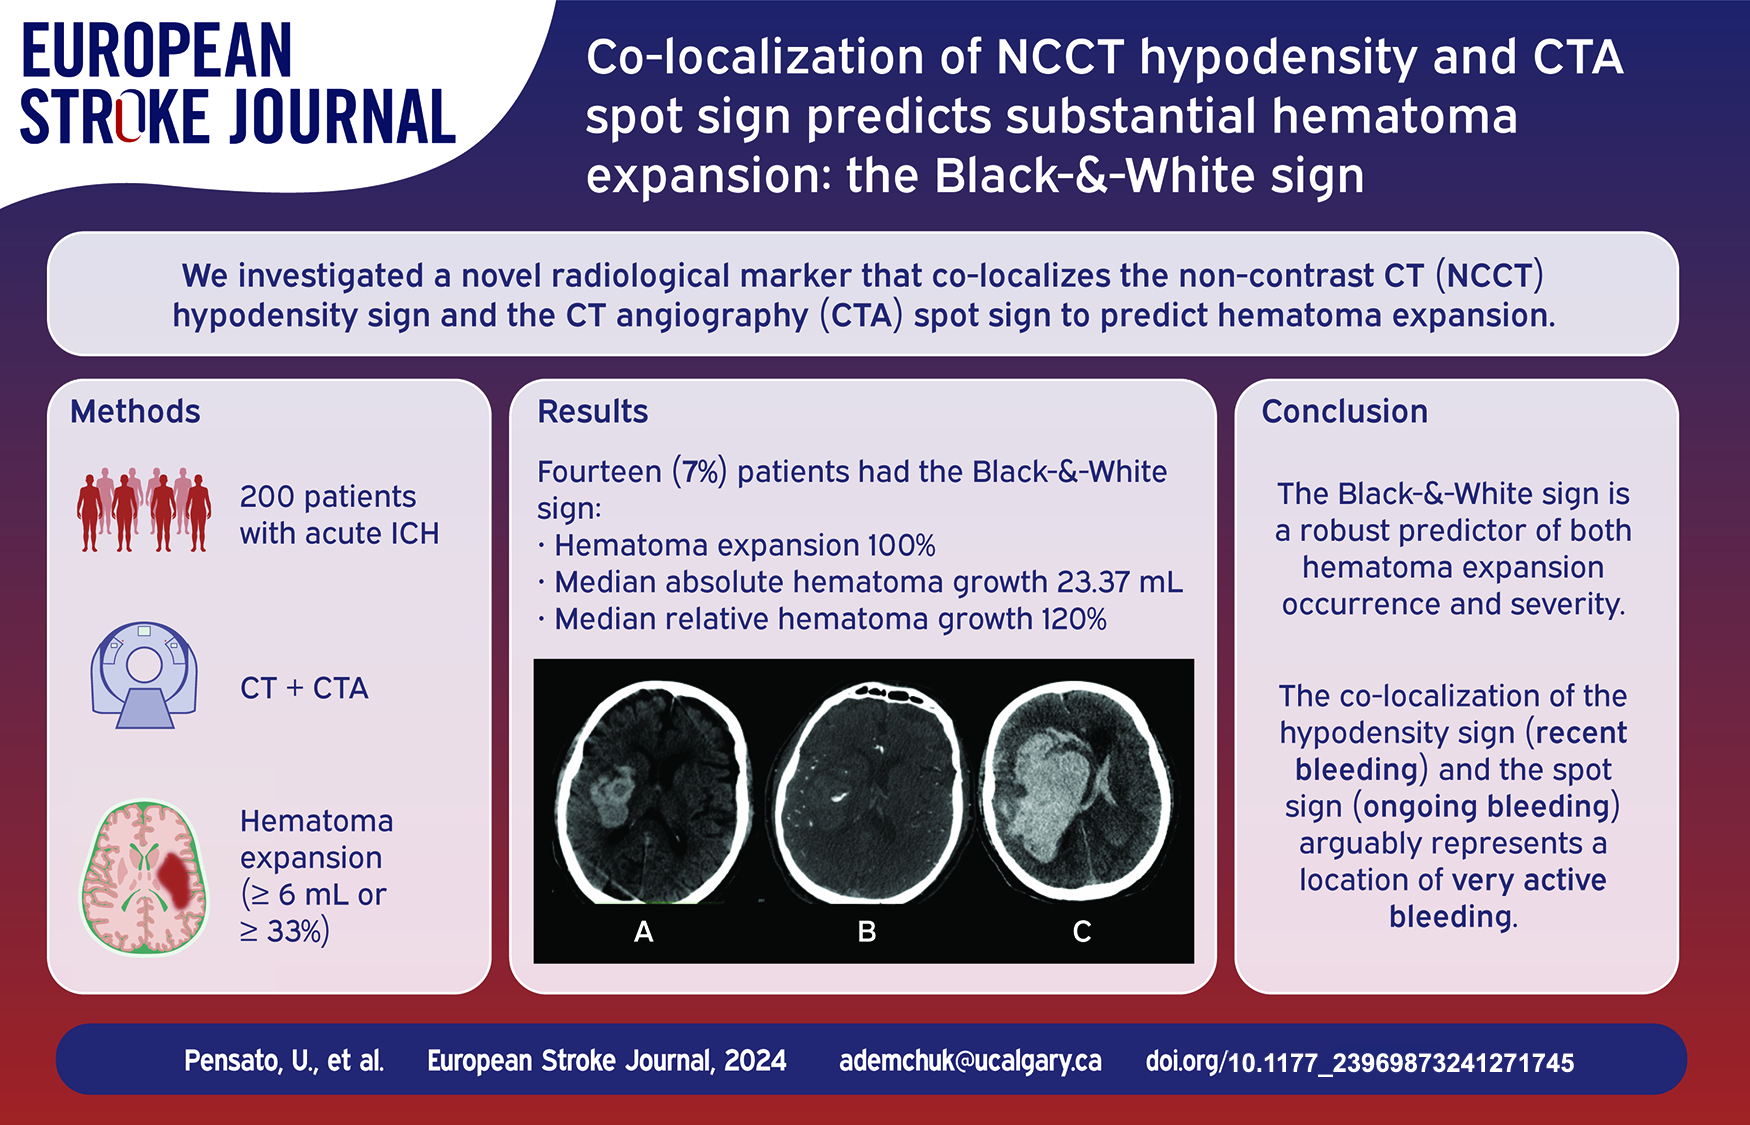
Existing radiological markers of hematoma expansion (HE) show modest predictive accuracy. We aim to investigate a novel radiological marker that co-localizes findings from non-contrast CT (NCCT) and CT angiography (CTA) to predict HE.
Methods:
Consecutive acute intracerebral hemorrhage patients admitted at Foothills Medical Centre in Calgary, Canada, were included. The Black-&-White sign was defined as any visually identified spot sign on CTA co-localized with a hypodensity sign on the corresponding NCCT. The primary outcome was hematoma expansion (⩾6 mL or ⩾33%). Secondary outcomes included absolute (<3, 3–6, 6–12, ⩾12 mL) and relative (0%, <25%, 25%–50%, 50%–75%, or >75%) hematoma growth scales.
Results:
Two-hundred patients were included, with 50 (25%) experiencing HE. Forty-four (22%) showed the spot sign, 69 (34.5%) the hypodensity sign, and 14 (7%) co-localized both as the Black-&-White sign. Those with the Black-&-White sign had higher proportions of HE (100% vs 19.4%, p < 0.001), greater absolute hematoma growth (23.37 mL (IQR = 15.41–30.27) vs 0 mL (IQR = 0–2.39), p < 0.001) and relative hematoma growth (120% (IQR = 49–192) vs 0% (0–15%), p < 0.001). The Black-&-White sign had a specificity of 100% (95%CI = 97.6%–100%), a positive predictive value of 100% (95%CI = 76.8%–100%), and an overall accuracy of 82% (95%CI = 76%–87.1%). Among the 14 patients with the Black-&-White sign, 13 showed an absolute hematoma growth ⩾12 mL, and 10 experienced a HE exceeding 75% of the initial volume. The inter-rater agreement was excellent (kappa coefficient = 0.84).
Conclusion:
The Black-&-White sign is a robust predictor of hematoma expansion occurrence and severity, yet further validation is needed to confirm these compelling findings.
Keywords
Introduction
Intracerebral hemorrhage (ICH) is a devastating condition with high rates of mortality and morbidity.1,2 Hematoma expansion (HE), a complication presenting in 20%–30% of ICH patients, has emerged as a compelling therapeutic target.3,4 Recent trials investigating hemostatic pharmacological treatments aiming to limit HE have consistently failed to demonstrate significant clinical benefits.3,5–9 This disappointing outcome might be attributed to early HE before drug administration, 10 suboptimal patient selection,3,11 and potential side effects of treatments. 12 Therefore, reliably identifying patients who would benefit most from these treatments is crucial to demonstrate their effectiveness.
Several non-contrast CT (NCCT) markers have been proposed as predictors of HE.3,13–17 These markers offer insights into the dynamic nature of certain hematomas, reflecting that bleeding might have occurred in diverse locations (heterogenous shape) and multiple times (heterogenous density), thereby increasing the risk of rebleeding and expansion.3,13,16 Additionally, a CT angiography (CTA) marker characterized by the extravasation of contrast within the hematoma – the spot sign – also predicts HE.18,19 However, clinical trials using CTA spot sign for patient selection have not yielded conclusive clinical benefits for HE-targeted treatments.5,20 A previous study showed that the co-presence of CTA spot sign and NCCT hypodensities offer additional predictive value in the stratification of HE risk compared to the presence in isolation of these signs, 21 though their co-localization has not been explored.
We aim to investigate a novel radiological marker that co-localizes the NCCT hypodensity sign and the CTA spot sign to predict HE.
Materials and methods
Patient sample
This single-center retrospective study included consecutive adult patients admitted to the Foothills Medical Centre in Calgary, Canada, between February 2012 and May 2020 with confirmed ICH. Inclusion criteria were: (i) baseline NCCT and CTA performed within 12 h from symptoms onset, (ii) minimal delay (<10 min) between NCCT and CTA, (iii) and adequate quality follow-up neuroimaging (CT or MRI) between 12 and 72 h post-baseline. Exclusion criteria were: (i) a secondary etiology (i.e. tumor or trauma), (ii) isolated intraventricular hemorrhage, (iii) neurosurgery intervention before follow-up neuroimaging, (iv) or enrolment in clinical trials evaluating hemostatic therapies. Anticoagulation reversal was administered as necessary.
Image acquisition and analysis
All patients underwent a comprehensive acute stroke imaging protocol, including NCCT and multiphase CTA using Discovery CT 750HD or Revolution CT (GE Healthcare, Milwaukee, WI). The CTA was performed using a bolus-tracking technique, with 70 mL of non-ionic iodinated contrast (68% ioversol, Optiray 320, Mallinckrodt, St Louis, MO) injected at a rate of 6 mL/s. Only the first phase (arterial phase) of multiphase CTA was evaluated, corresponding to a typical single-phase CTA. Axial images were acquired with a section thickness of 0.625 mm and reconstructed with a 1 mm overlapping section. Scanning parameters included a tube voltage of 120 kV and an auto tube current ranging from 10 to 625 mA.
Hematoma volumes at baseline (initial volume) and follow-up (final volume) were quantified using the semi-automatic segmentation software Quantomo (Cybertrial Inc, Calgary, Canada), which has been validated for accurate ICH volume analysis. 22 Both intraparenchymal and intraventricular components were included in the total ICH volume. To maintain consistency and avoid negative growth results, cases where the final hematoma volume was smaller than the initial volume were defined as having 0 mL growth.
The hypodensity sign was defined according to the International NCCT ICH Study Group standards as any visually identified hypodense region within the hematoma volume on baseline NCCT without connection with the surrounding brain parenchyma.13,14 The spot sign was defined as any visually identified contrast extravasation within the hematoma volume during the first phase of CTA, with a density greater than 120 Hounsfield units, regardless of shape or size.13,18 The Black-&-White (B&W) sign was defined as any visually assessed CTA spot sign localized within or adjacent to a hypodensity sign on the corresponding NCCT. The B&W name refers to the co-localization of the black appearance on NCCT (hypodensity) with the white appearance on CTA (spot sign).
Two independent readers (UP and KT), both stroke researchers and neurologists with 3 and 15 years of experience, respectively, evaluated the baseline radiological features on axial images, blinded to clinical and imaging outcomes. A third reader (AMD), a stroke researcher and neurologist with over 25 years of experience, resolved any disagreements. One reader (UP) reviewed the baseline radiological features twice, with a two-week interval between readings.
For further analyses, the study population was stratified based on the different combinations of spot sign and hypodensity sign into the following subgroups: (i) no spot sign and no hypodensity sign (SS−HS−), (ii) no spot sign and presence of hypodensity sign (SS−HS+), (iii) presence of spot sign and no hypodensity sign (SS+HS−), (iv) presence of both spot sign and hypodensity sign but not co-localized (SS+HS+), and (v) co-localized spot sign and hypodensity sign (B&W+). The presence of other shapes or density NCCT markers was not evaluated.
Outcomes
The primary outcome was hematoma expansion, defined as ICH volume growth of at least 6 mL or 33% between the initial and final volumes. Secondary outcomes included hematoma expansion based on both ⩾6 mL and ⩾33%, severe hematoma expansion (⩾12.5 mL or ⩾66%), 23 absolute and relative hematoma growth as continuous variables, final hematoma volume, functional outcome using the 90-days modified Rankin Scale (mRS), and mortality. Additionally, we included absolute and relative hematoma expansion scales: Intracranial Hemorrhage Expansion Scale (ICrHES) cut-offs (<3, 3–6, 6–12, ⩾12 mL) 24 and Percentage Hematoma Expansion Shift (%HES) with quintiles (no expansion; <25%; 25%–50%; 50%–75%, and >75%). 25
Statistical analysis
Continuous variables were presented as medians and interquartile ranges (IQR), while categorical variables were reported as counts and percentages. Baseline clinical and radiological features, as well as outcomes, were compared between patients with and without the B&W sign on baseline CT. Univariable comparisons were conducted using Fisher’s exact test for categorical variables and the Wilcoxon rank-sum test for continuous variables.
The diagnostic performance of the B&W sign, along with possible combinations of the spot sign and hypodensity sign, for predicting HE was assessed using sensitivity, specificity, positive and negative predictive value, positive and negative likelihood ratio, and overall accuracy.
As part of a sensitivity analysis, we assessed the association between the possible combinations of radiological markers (SS−HS+, SS+HS−, SS+HS+, or B&W) and the hematoma expansion scales (ICrHES and %HES).
Inter-rater and intra-rater agreement for scoring the B&W sign was assessed using the Cohen kappa coefficient in the group of patients with positive spot sign. All calculated p-values were two-tailed. Statistical significance was assumed at p < 0.05. The statistical analysis was performed with Stata (Version 18.0).
Results
Patient characteristics
A total of 200 acute ICH patients were enrolled in the study. Table 1 summarizes the demographics, medical history, and baseline clinical-radiological features. The median age was 69 years (IQR = 59–79.5) and 78 (39%) were female. The median baseline NIHSS was 10 (IQR = 5–20), the median time from symptoms onset to imaging was 212 min (IQR = 160–338), and the median initial hematoma volume was 19 mL (IQR = 5.6–34.9). Sixty-nine (34.5%) patients exhibited the hypodensity sign, 44 (22%) the spot sign, and 14 (7%) the B&W sign. No significant differences were observed between patients with and without the B&W sign (Table 1).
Demographics, medical history, and baseline features in the full cohort.
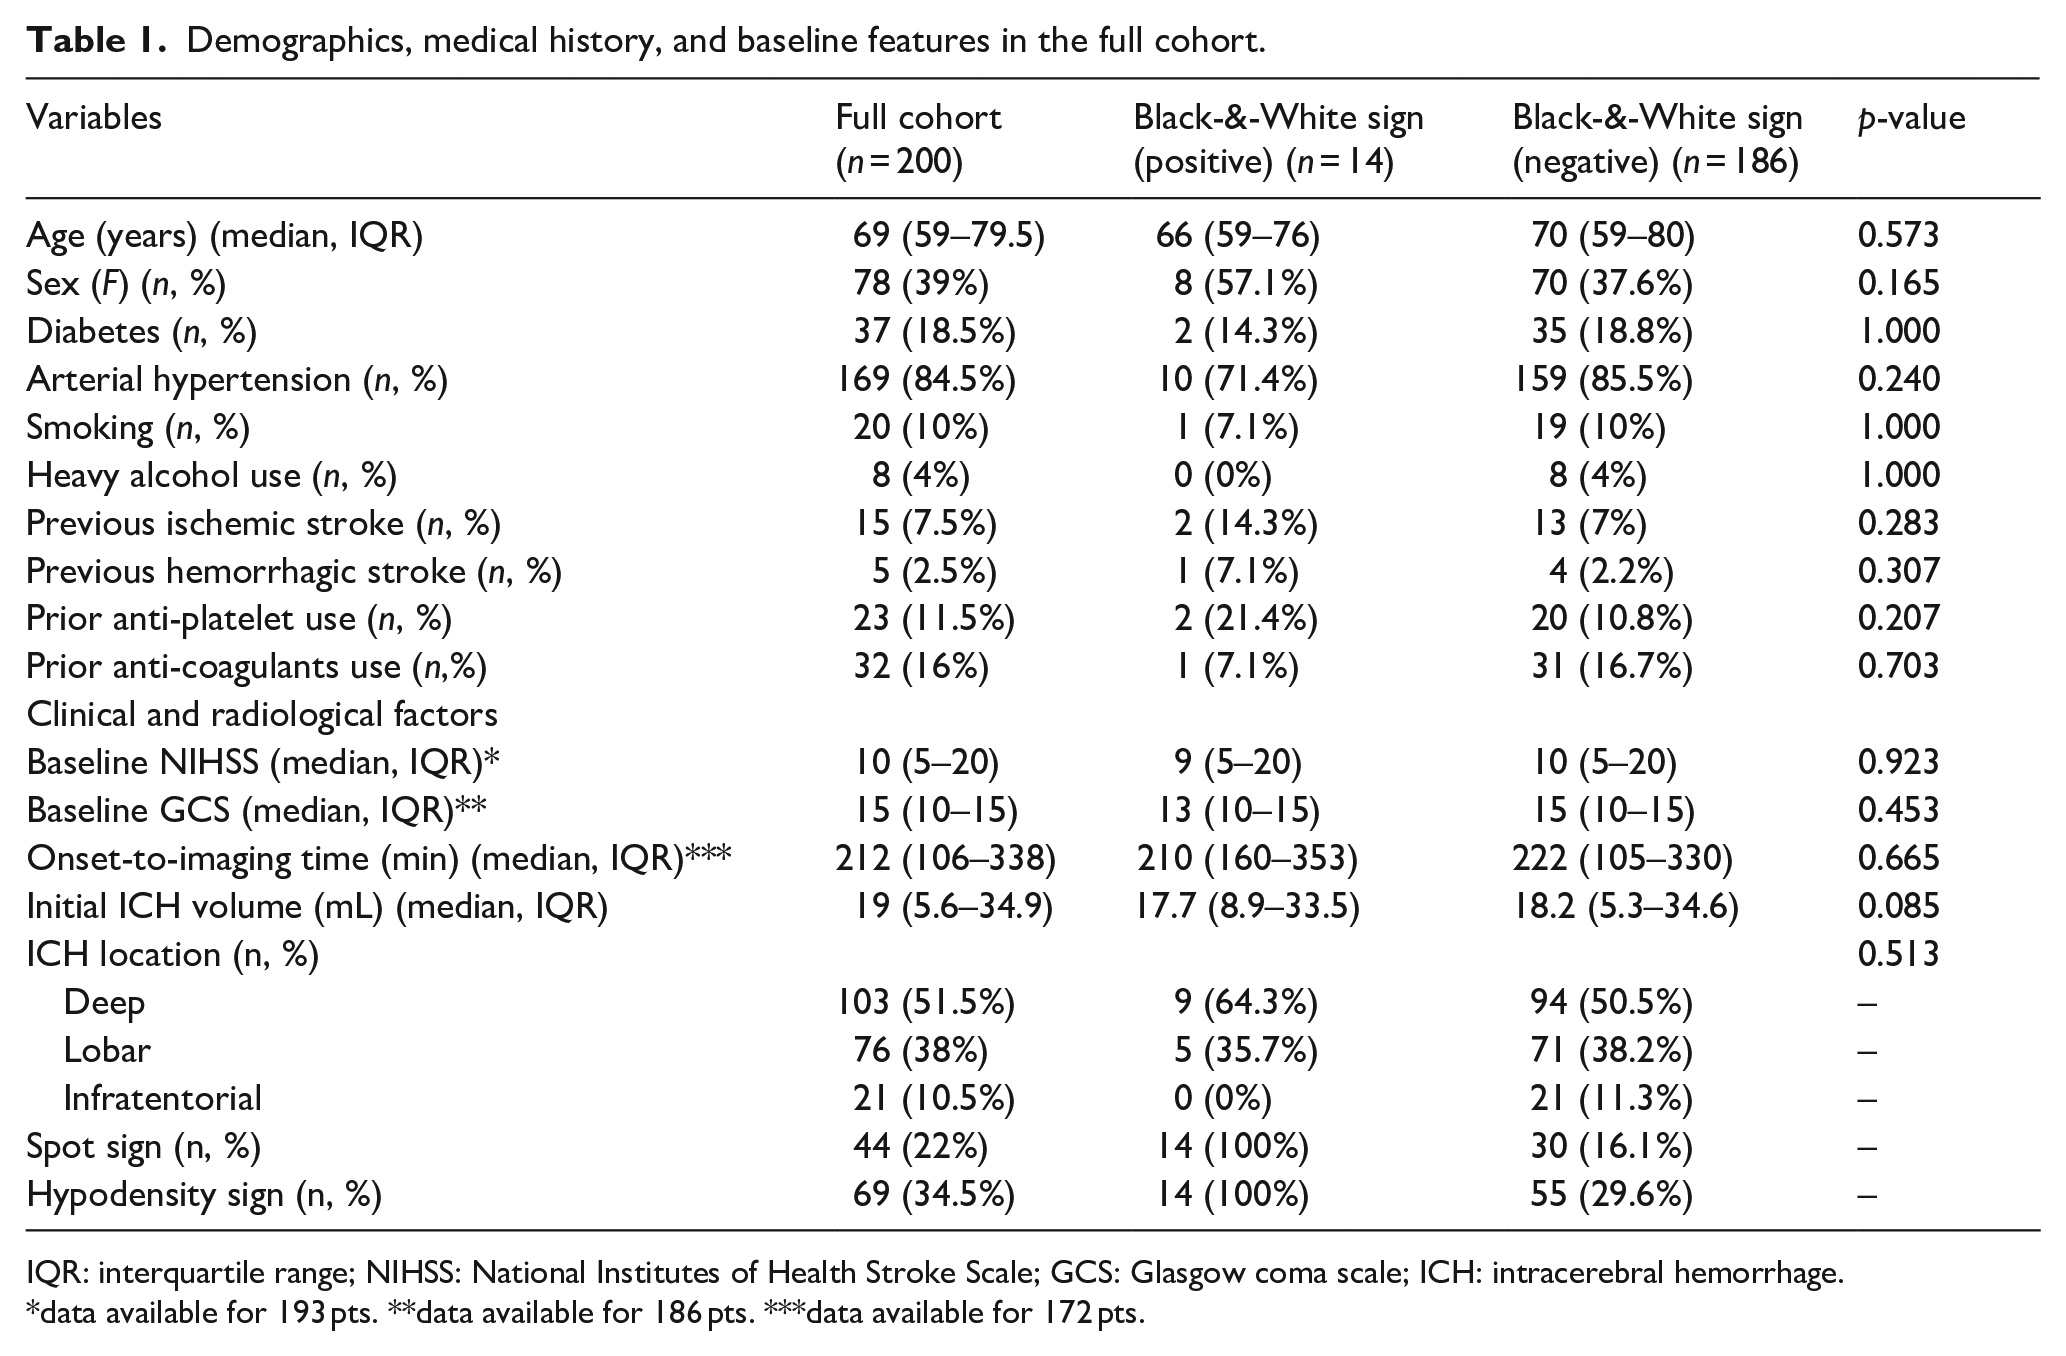
IQR: interquartile range; NIHSS: National Institutes of Health Stroke Scale; GCS: Glasgow coma scale; ICH: intracerebral hemorrhage.
data available for 193 pts. **data available for 186 pts. ***data available for 172 pts.
Radiological and clinical outcomes
The clinical and radiological outcomes are summarized in Table 2. Hematoma expansion occurred in 50 (25%) patients, with a median absolute hematoma growth of 0.2 mL (IQR = 0–4.8) and median relative growth of 1% (IQR = 0–22%). Patients with the B&W sign had significantly higher proportions of hematoma expansion (100% vs 19.4%, p < 0.001) and severe hematoma expansion (85.7% vs 12.4%, p < 0.001) compared to those without the sign. Additionally, they exhibited greater hematoma absolute growth (23.4 mL (IQR = 15.4–30.3) vs 0 mL (IQR = 0–2.4), p < 0.001), relative growth (120% (IQR = 49–192) vs 0% (0–15%), p < 0.001), and final hematoma volume (50.2 mL (IQR = 38.6–80.4) vs 21 mL (IQR = 6.2–41), p < 0.001).
Radiological and clinical outcomes in the full cohort.
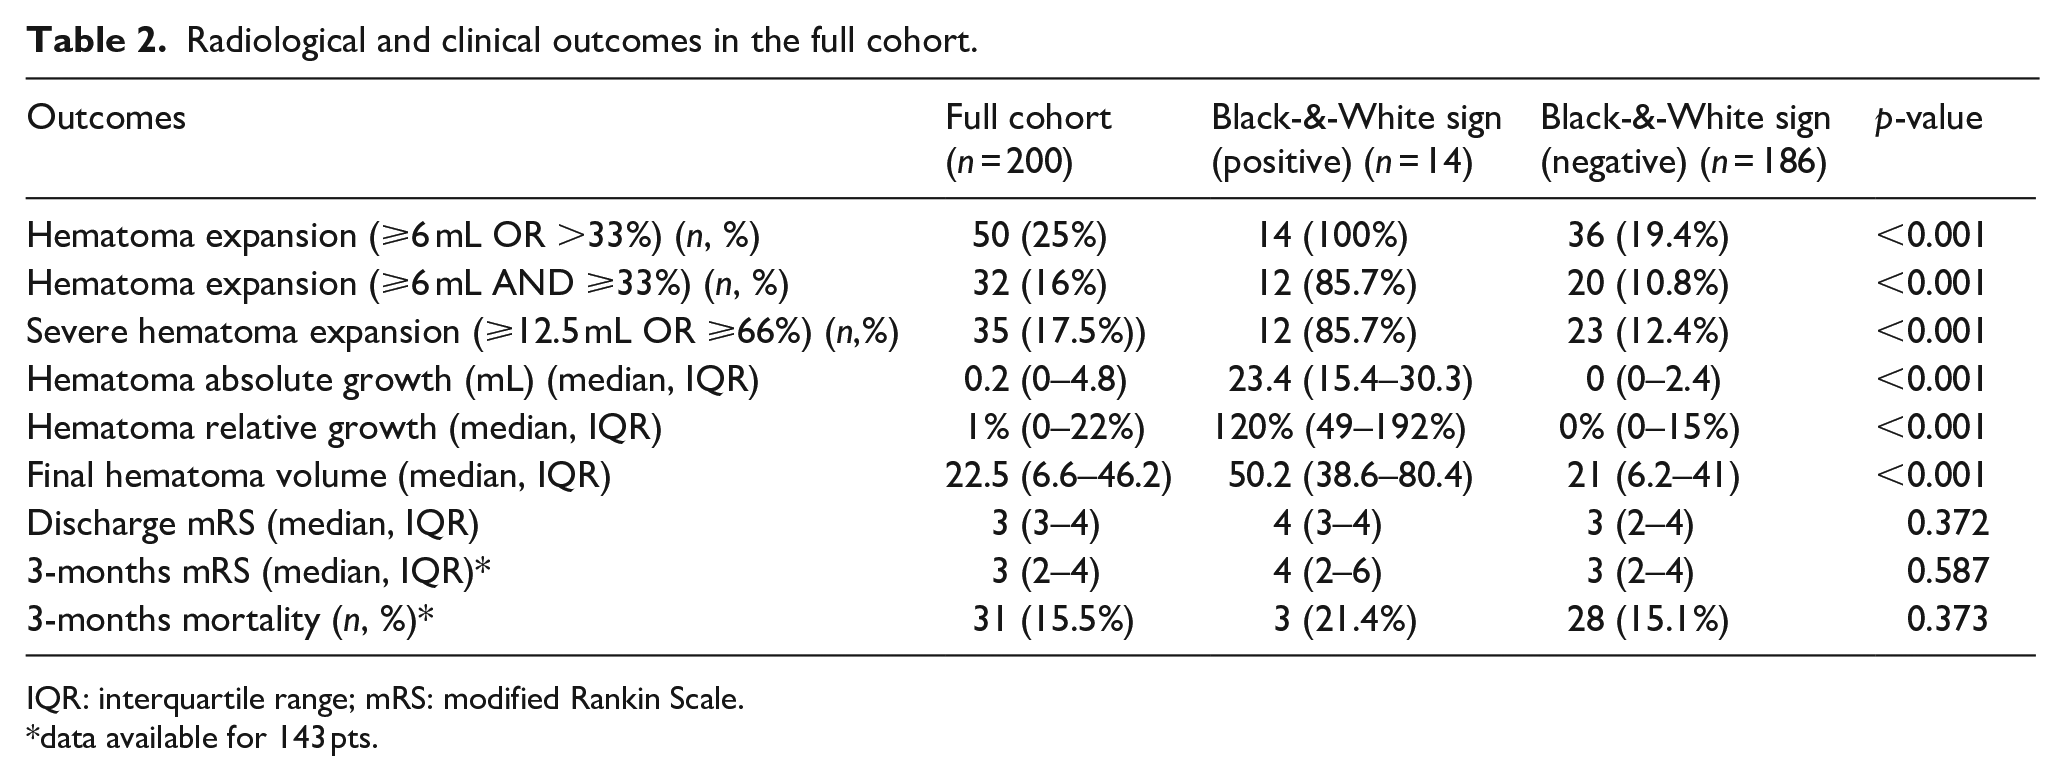
IQR: interquartile range; mRS: modified Rankin Scale.
data available for 143 pts.
There were no significant differences in clinical outcomes between the two subgroups. Illustrative cases are shown in Figure 1 and Supplemental Figure 1.
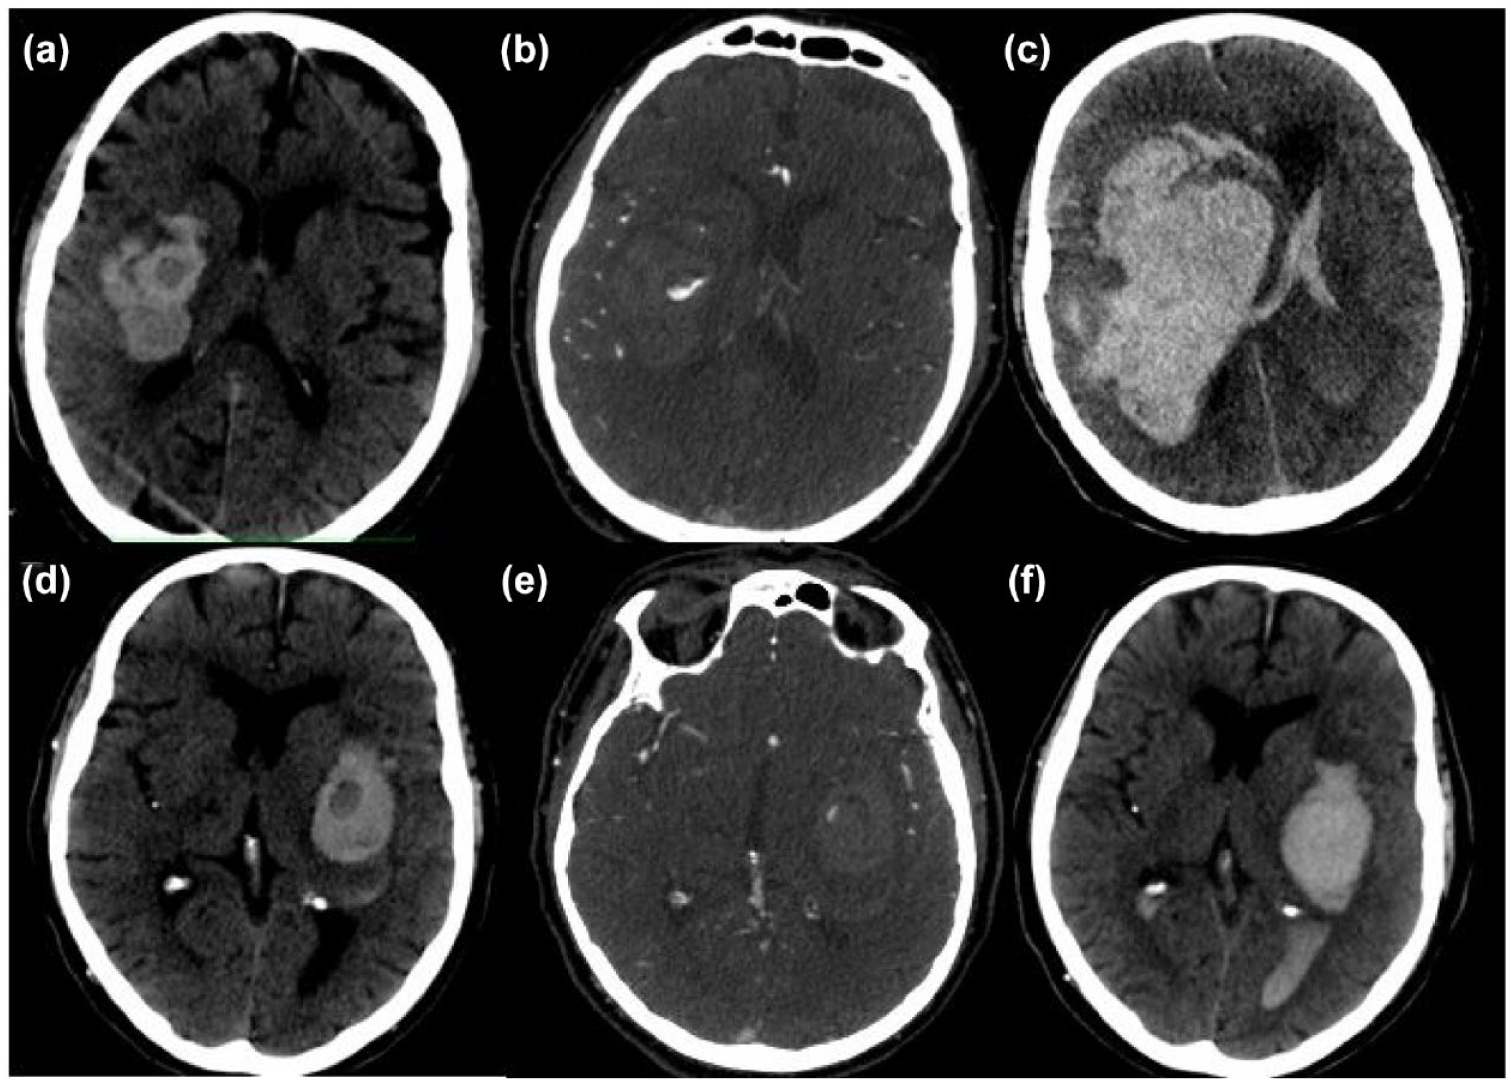
Exemplary cases of patients with Black-&-White signs: Patient 1: a round-shaped hypodensity sign on non-contrast CT (a) with a half-moon-shaped spot sign in its inferior portion on CT angiography (b). A follow-up non-contrast CT showed a hematoma expansion of 196.51 mL (c). Patient 2: an oval-shaped hypodensity sign on non-contrast CT (d) with a comma-shaped spot sign in its superior edge on CT angiography (e). A follow-up non-contrast CT showed a hematoma expansion of 12.46 mL (f).
Diagnostic performance of the Black-&-White sign
For predicting hematoma expansion, the B&W sign yielded a sensitivity of 28% (95%CI = 16.2%–42.5%), specificity of 100% (95%CI = 97.6%–100%), positive predictive value of 100% (95%CI = 76.8%–100%), negative predictive value of 80.7% (95%CI = 77.8%–83.2%), and an overall accuracy of 82% (95%CI = 76%–87.1%). For predicting severe hematoma expansion, the B&W sign yielded a sensitivity of 34.3% (95%CI = 19.1%–52.2%), specificity of 98.8% (95%CI = 95.7%–99.9%), positive predictive value of 85.7% (95%CI = 58.4%–96.2%), negative predictive value of 87.6% (95%CI = 84.8%–90%), and an overall accuracy of 87.5% (95%CI = 82–1%–91.7%). Analysis of the different spot sign and hypodensity sign combinations showed progressive improvement in diagnostic performances (Table 3 and Supplemental Table 1).
Accuracy of spot sign and hypodensity sign at various combinations in predicting hematoma expansion (⩾6 mL or ⩾33%).
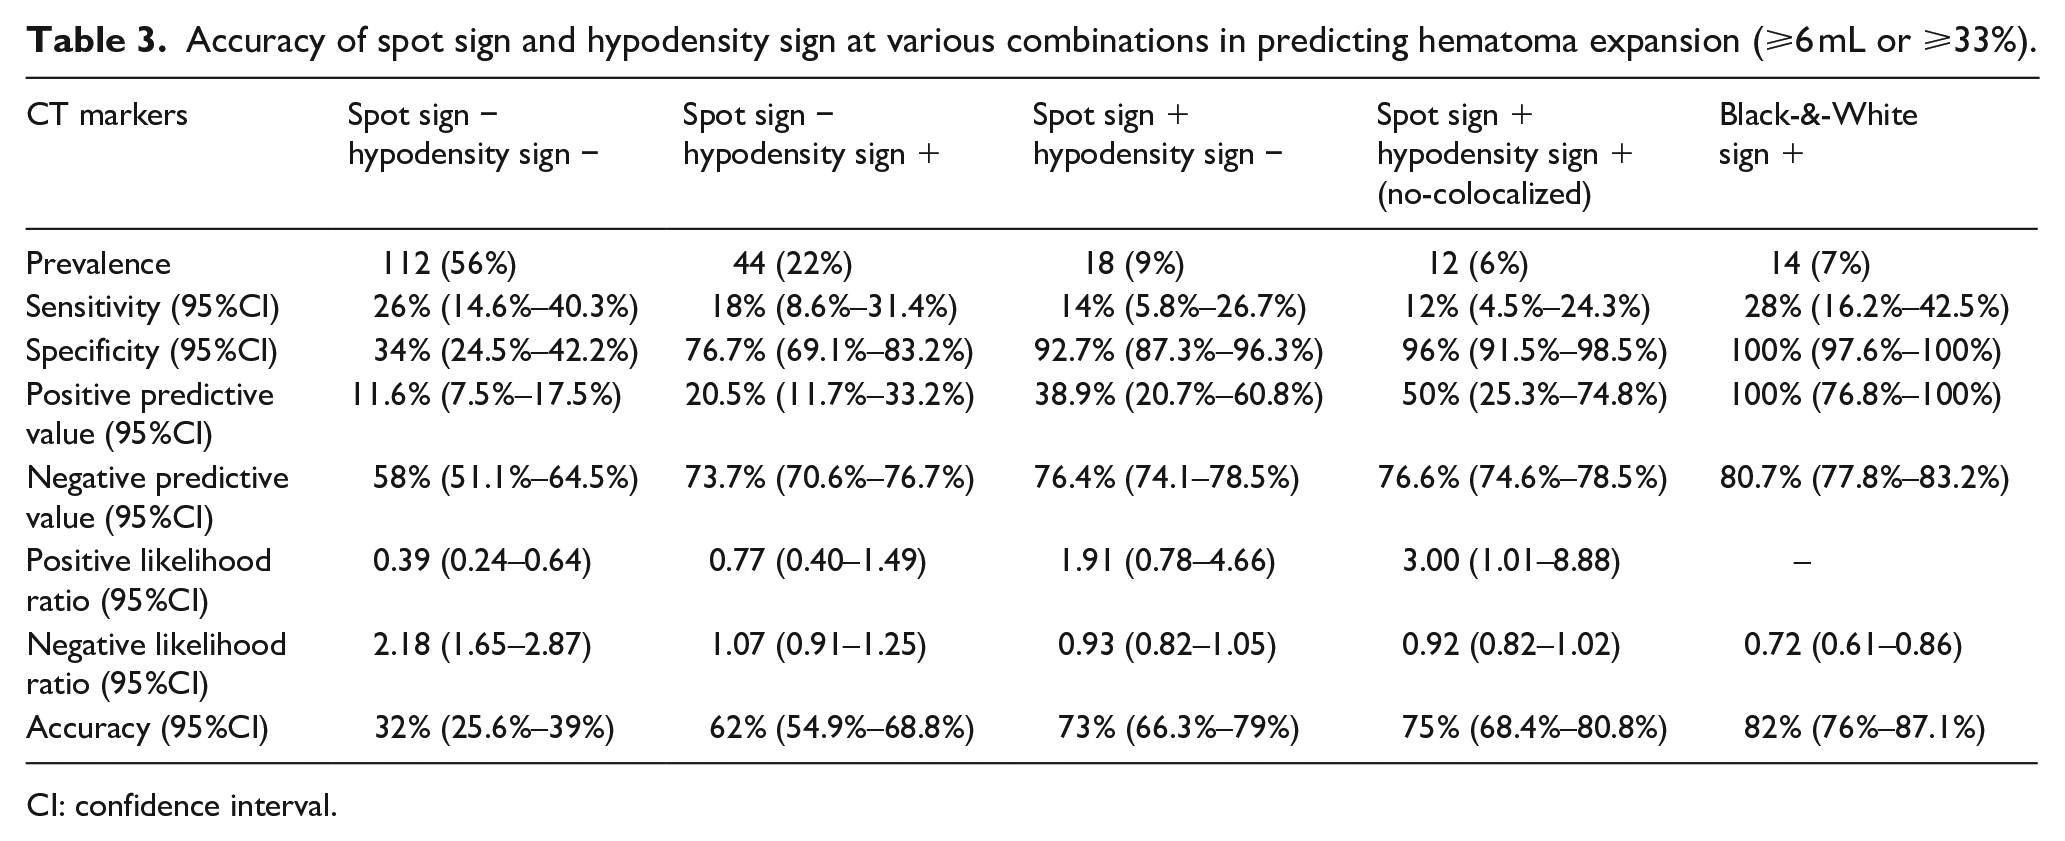
CI: confidence interval.
Sensitivity analysis for relative and absolute hematoma growth scales
There was a statistically significant association between different combinations of radiological markers (SS−HS+, SS+HS−, SS+HS+, or B&W) and the Intracranial Hemorrhage Expansion Scale (ICrHES) (p < 0.001). Specifically, in the subgroup with positive B&W sign, 13 patients exhibited an absolute hematoma expansion ⩾12 mL, while one patient showed an expansion of 6–12 mL (Figure 2).
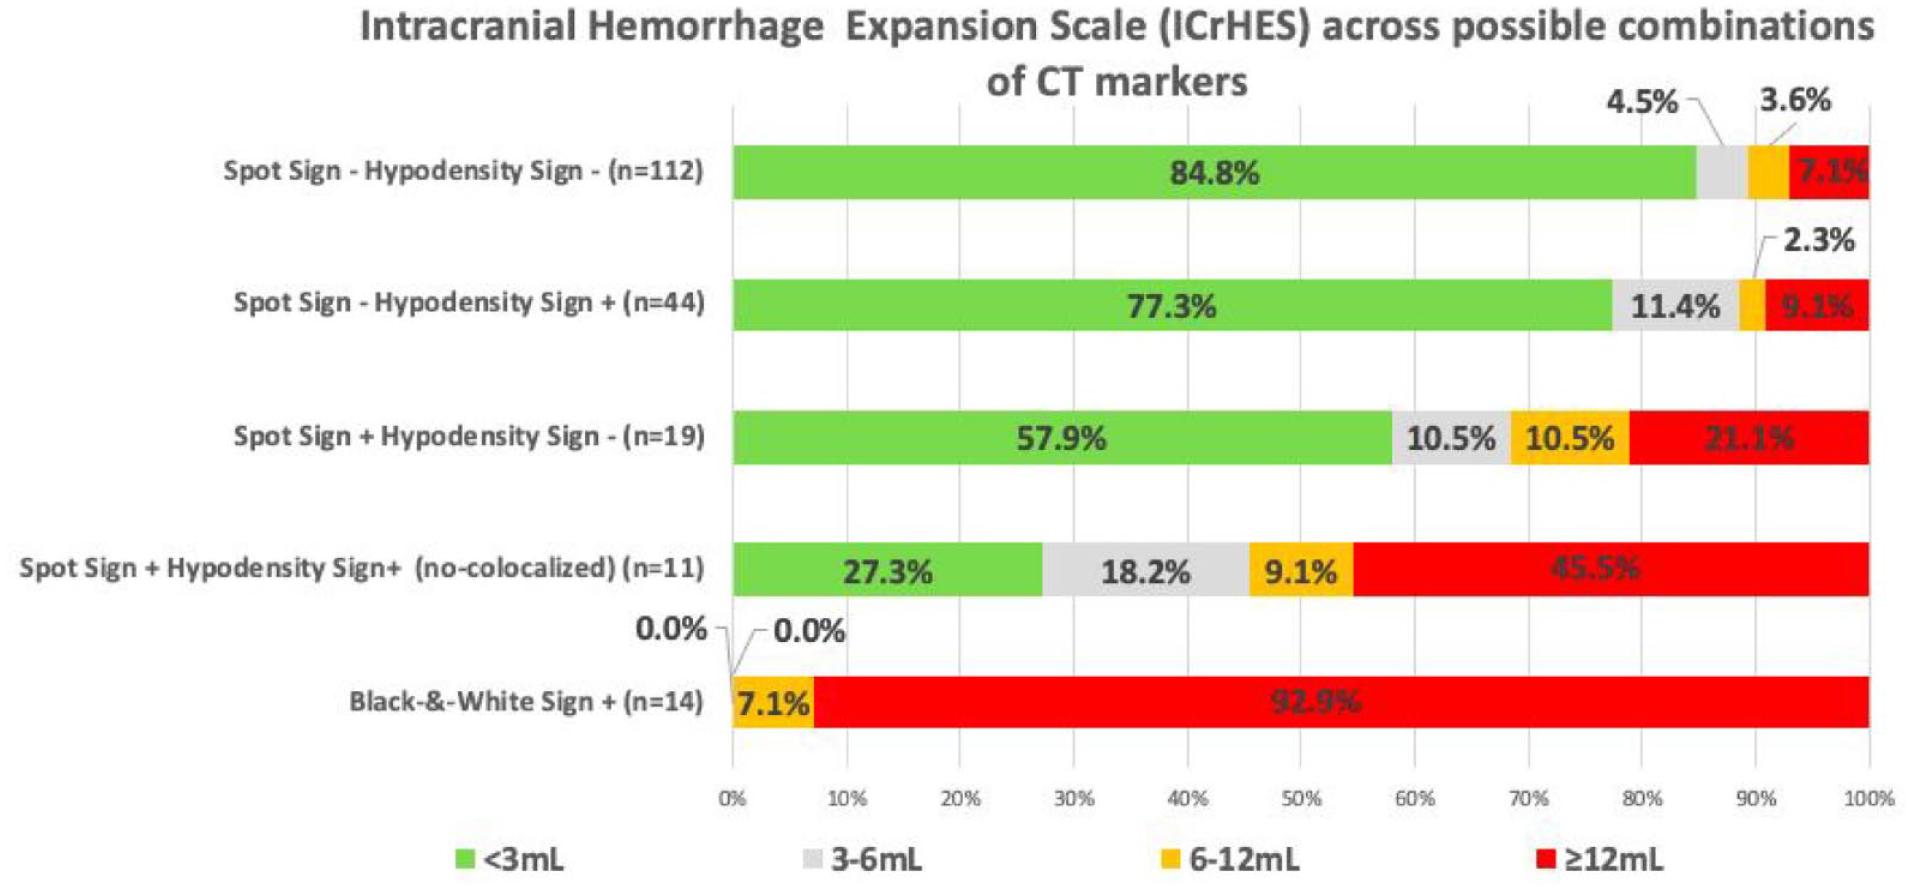
Distribution of absolute hematoma expansion across spot sign and hypodensity sign possible combinations.
There was a statistically significant association between different combinations of radiological markers (SS−HS+, SS+HS−, SS+HS+, or B&W) and the Hematoma Expansion Scale (%HES) (p < 0.001). Specifically, in the subgroup with positive B&W sign, 10 patients exhibited a relative hematoma expansion >75%, three patients showed an expansion between 25% and 50%, and one patient had an expansion <25% (Figure 3).
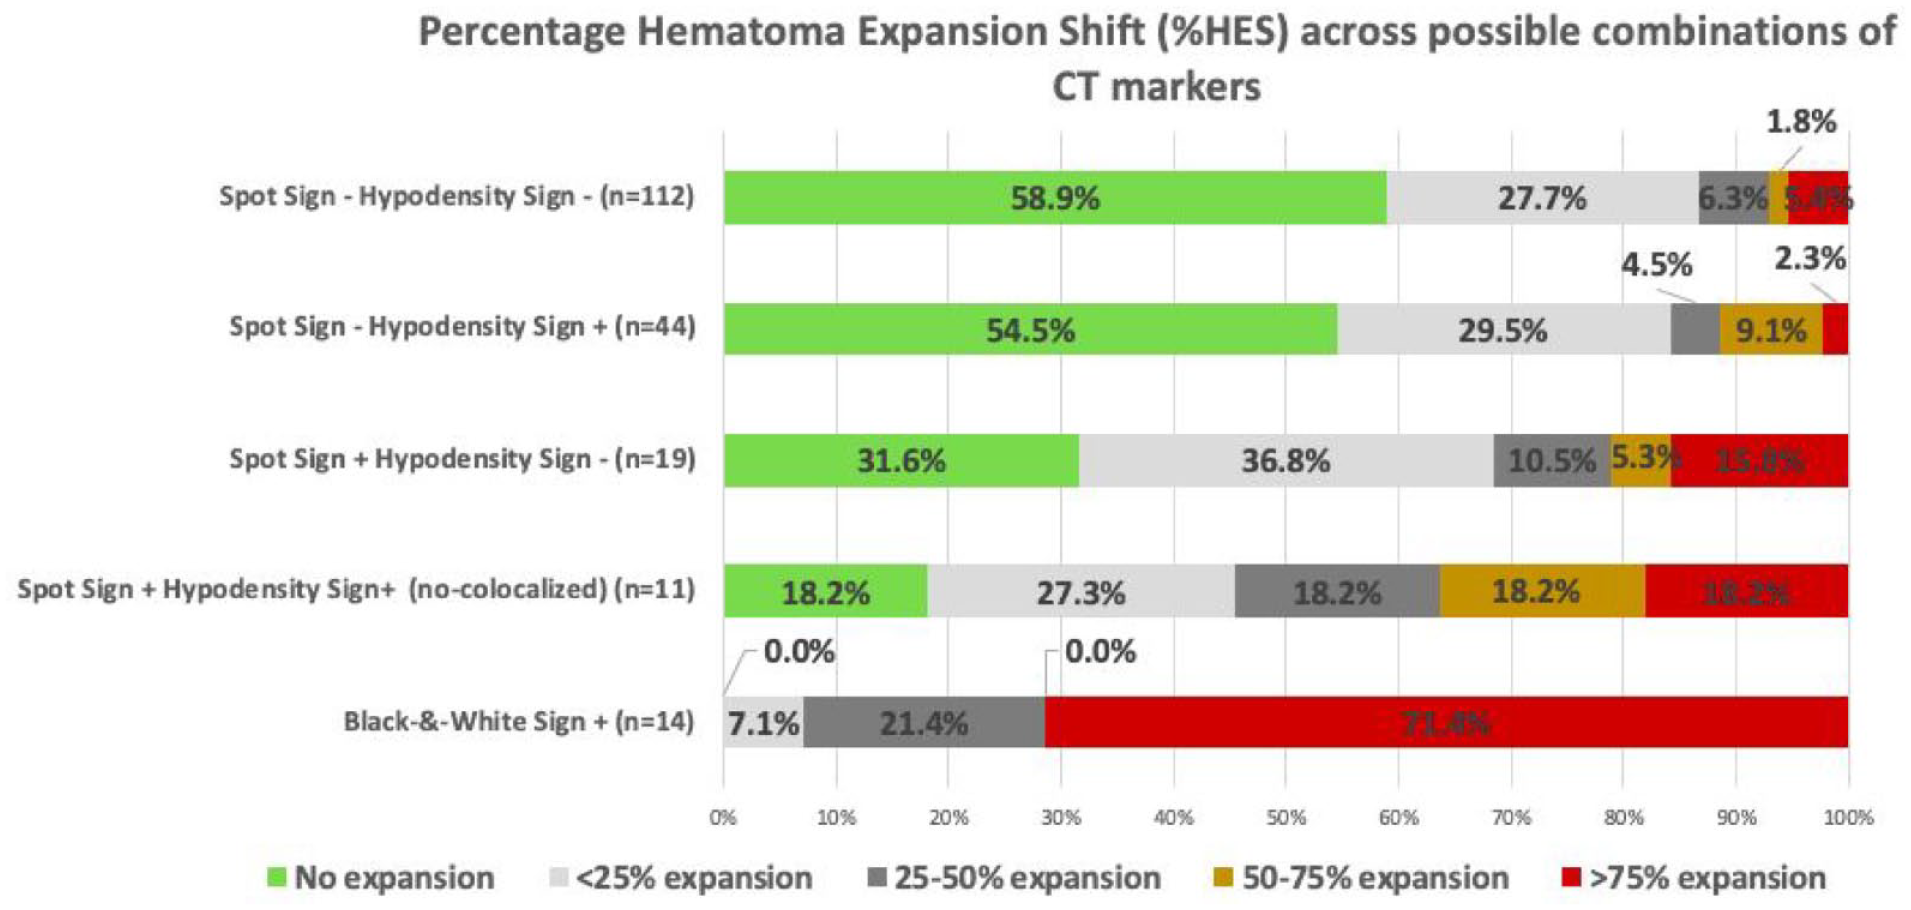
Distribution of relative hematoma expansion across spot sign and hypodensity sign possible combinations.
Inter-rater and intra-rater agreement
The assessment of the inter-rater agreement yielded almost perfect agreement among readers, with a kappa coefficient of 0.84. The intra-rater agreement yielded almost perfect agreement with a kappa coefficient of 0.90.
Discussion
We describe a novel radiological marker − the Black-&-White sign− which integrates NCCT and CTA markers to predict substantial hematoma expansion by identifying the co-localization of the hypodensity sign and spot sign. The B&W sign was identified in 7% of our cohort. Its presence was a consistent indicator of HE in all patients in our study, with the majority of them experiencing a substantial volume increase, underscoring the potential of the B&W sign as a reliable predictor for both the occurrence and severity of HE.
The spot sign has a positive predictive value for HE of 53%, decreasing to 33% in late presenters. 26 Previous studies have shown improved diagnostic accuracy when combining CTA and NCCT markers to predict HE.21,27 However, the co-appearance of a swirl sign (hypodensity NCCT marker) and CTA spot sign has only been described in a single case report with no mention of co-localization and without a discussion of the underlying pathophysiology. 28 Our study stands out by systematically analyzing the concomitant occurrence and co-localization of NCCT and CTA markers in an observational cohort, delving into their pathophysiological interplay. We found a consistent progressive improvement in diagnostic performance for HE and severe HE when both markers are absent, individually present, both present but not co-localized, and co-localized.
We utilized the widely recognized definition of HE as a volume increase of ⩾6 mL or 33%. 13 While this binary classification is common, it oversimplifies the clinical impact of hematoma growth, as each 1 mL expansion correlates with a 5% higher risk of death or dependency.29,30 To provide a more granular assessment of HE severity related to the B&W sign,24,25 we performed sensitivity analyses examining the full spectrum of hematoma volume growth. Notably, among the 14 patients with the B&W sign, 13 showed an absolute hematoma growth ⩾12 mL, and 10 experienced a HE exceeding 75% of the initial volume.
The spot sign evaluated through multiphase CTA demonstrated superior diagnostic accuracy for predicting HE, yet this technique is not widely adopted worldwide for hemorrhagic stroke. 31 Therefore, despite conducting multiphase CTA on all patients per our local protocol, we evaluated the spot sign and B&W sign only on the first, arterial phase in this study to improve generalizability. For the same purpose, we did not align CTA and NCCT images with post-processing analysis, possibly reducing the preciseness of the co-localization. A simple estimation of co-localization is more practical and showed excellent inter-rater and intra-rater agreement.
From a pathophysiological perspective, the heterogeneity density observed in NCCT in some ICH, including the hypodensity sign, likely represents the simultaneous presence of acute and subacute blood stages.13,32 As clotting progresses, the clot retracts, and the serum is extruded, resulting in a more stable, hyperdense clot CT scans.32,33 Conversely, the spot sign represents contrast extravasation that can expand over a few seconds as observed by multiphase CTA and CT perfusion images, suggesting an ongoing process.34,35 Therefore, the co-localization of the hypodensity sign (indicating recent bleeding) and the spot sign (suggesting ongoing bleeding) arguably represents a location of very active bleeding.
Previous studies have highlighted the potential efficacy of recombinant factor VII across the entire spectrum of HE severity, 36 whereas intensive blood pressure-lowering strategies have shown more promise in populations at the highest risk of severe HE. 25 The B&W sign might stand out from other radiological signs, enabling a more granular stratification of patients into a category of severe HE risk. This may help select distinctive populations where specific treatment modalities are most effective, moving toward a personalized approach to managing HE.
Our study has several limitations. First, it was a single-center retrospective study with a relatively small sample size, which may limit the generalizability of our findings. Second, we did not validate the B&W sign in an independent cohort. Third, the low incidence of the B&W sign and the incomplete outcome data for some patients limited our analyses of the association with clinical outcomes. Finally, we didn’t evaluate the shape and density of NCCT markers of hematoma expansion beyond the hypodensity sign.
Conclusion
The Black-&-White sign, indicative of the concomitant and co-localized presence of the NCCT hypodensity sign and the CTA spot sign, is a pragmatic, robust radiological predictor of both hematoma expansion occurrence and severity. Validation is needed in other NCCT/CTA datasets of ICH. Future studies should also explore the relationship between spot signs co-localized with other NCCT density and shape markers.
Supplemental Material
sj-docx-1-eso-10.1177_23969873241271745 – Supplemental material for Co-localization of NCCT hypodensity and CTA spot sign predicts substantial intracerebral hematoma expansion: The Black-&-White sign
Supplemental material, sj-docx-1-eso-10.1177_23969873241271745 for Co-localization of NCCT hypodensity and CTA spot sign predicts substantial intracerebral hematoma expansion: The Black-&-White sign by Umberto Pensato, Koji Tanaka, MacKenzie Horn, Ericka Teleg, Abdulaziz Sulaiman Al Sultan, Linda Kasickova, Tomoyuki Ohara, Piyush Ojha, Sina Marzoughi, Ankur Banerjee, Girish Kulkarni, Dar Dowlatshahi, Mayank Goyal, Bijoy K. Menon and Andrew M. Demchuk in European Stroke Journal
Footnotes
Acknowledgements
We would like to thank the following individuals, who are part of the MCAHP Stroke Group, for their contribution to the study: Sanchea Wasyliw, Kennedy Horn, Amy Bobyn, Anneliese Neweduk, Nishita Singh, Wu Qiu, and David Rodriguez-Luna.
Declaration of conflicting interests
The author(s) declared no potential conflicts of interest with respect to the research, authorship, and/or publication of this article.
Funding
The author(s) received no financial support for the research, authorship, and/or publication of this article.
Ethical approval
The study was approved by the ethics committee at the University of Calgary (Approval number: REB17-0573).
Informed consent
Written informed consent was obtained from all enrolled patients for study participation and data publication.
Guarantor
AMD
Contributorship
UP, KT, and AMD conceived the study. UP drafted the manuscript. All Authors contributed to data acquisition, reviewed and edited the manuscript, and approved the final version of the study.
Supplemental material
Supplemental material for this article is available online.
References
Supplementary Material
Please find the following supplemental material available below.
For Open Access articles published under a Creative Commons License, all supplemental material carries the same license as the article it is associated with.
For non-Open Access articles published, all supplemental material carries a non-exclusive license, and permission requests for re-use of supplemental material or any part of supplemental material shall be sent directly to the copyright owner as specified in the copyright notice associated with the article.