
Abstract
Background:
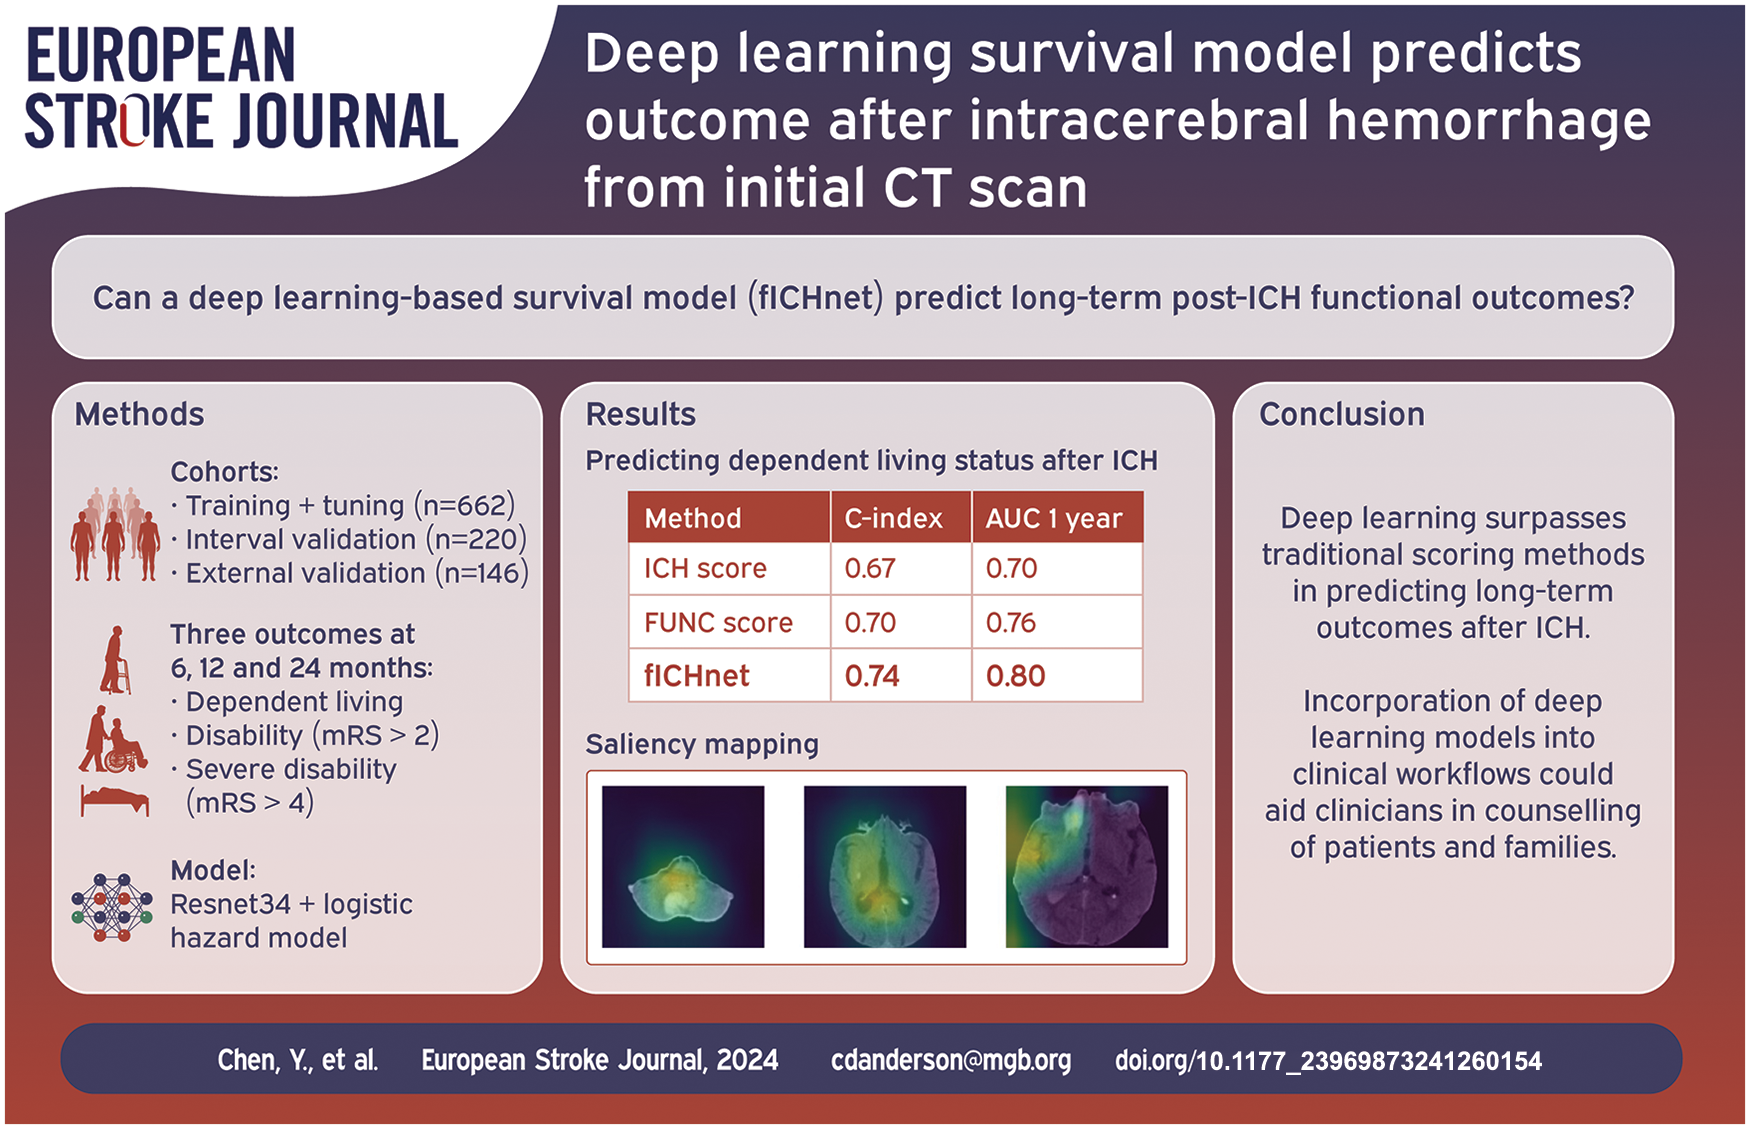
Predicting functional impairment after intracerebral hemorrhage (ICH) provides valuable information for planning of patient care and rehabilitation strategies. Current prognostic tools are limited in making long term predictions and require multiple expert-defined inputs and interpretation that make their clinical implementation challenging. This study aimed to predict long term functional impairment of ICH patients from admission non-contrast CT scans, leveraging deep learning models in a survival analysis framework.
Methods:
We used the admission non-contrast CT scans from 882 patients from the Massachusetts General Hospital ICH Study for training, hyperparameter optimization, and model selection, and 146 patients from the Yale New Haven ICH Study for external validation of a deep learning model predicting functional outcome. Disability (modified Rankin scale [mRS] > 2), severe disability (mRS > 4), and dependent living status were assessed via telephone interviews after 6, 12, and 24 months. The prediction methods were evaluated by the c-index and compared with ICH score and FUNC score.
Results:
Using non-contrast CT, our deep learning model achieved higher prediction accuracy of post-ICH dependent living, disability, and severe disability by 6, 12, and 24 months (c-index 0.742 [95% CI –0.700 to 0.778], 0.712 [95% CI –0.674 to 0.752], 0.779 [95% CI –0.733 to 0.832] respectively) compared with the ICH score (c-index 0.673 [95% CI –0.662 to 0.688], 0.647 [95% CI –0.637 to 0.661] and 0.697 [95% CI –0.675 to 0.717]) and FUNC score (c-index 0.701 [95% CI– 0.698 to 0.723], 0.668 [95% CI –0.657 to 0.680] and 0.727 [95% CI –0.708 to 0.753]). In the external independent Yale-ICH cohort, similar performance metrics were obtained for disability and severe disability (c-index 0.725 [95% CI –0.673 to 0.781] and 0.747 [95% CI –0.676 to 0.807], respectively). Similar AUC of predicting each outcome at 6 months, 1 and 2 years after ICH was achieved compared with ICH score and FUNC score.
Conclusion:
We developed a generalizable deep learning model to predict onset of dependent living and disability after ICH, which could help to guide treatment decisions, advise relatives in the acute setting, optimize rehabilitation strategies, and anticipate long-term care needs.
Introduction
Intracerebral hemorrhage (ICH) accounts for 10%–15% of all stroke cases yet half of stroke-related morbidity and mortality.1,2 ICH survivors often experience functional impairments that lead to disability and loss of independent living. 3 Accurate prognosis of long-term levels of functional impairment could substantially impact patients and caregivers in guiding treatment decisions, optimizing rehabilitation strategies, and planning lifestyle adjustments.
Within the multitude of clinical scores for outcome prediction, 4 the most well-established are the ICH score, 5 originally developed for comparison of ICH severities, and the FUNC score, created for the prediction of functional independence at 90 days after ICH. 6 Both scores included the patients’ age, hemorrhage volume, location, and Glasgow coma scale (GCS), with FUNC score additionally considering the pre-ICH cognitive status. Contemporary strategies have extended the prognostic toolkit by integrating radiomic features from admission CT scans to enhance prediction of functional impairment at discharge or 3 months post-ICH.7–11 However, the creation of tools for long-term prognosis of disability post-ICH has been challenging due to the interindividual variability in the affected brain structures, pre-existing disease, and other unique variables not captured by existing radiographic parameters such as hemorrhage location or volume. In recent years, deep learning models that excel at computer vision tasks have been developed. Those models outperform humans in some pattern recognition tasks, detecting subtle features in medical images too nuanced for human perception, or cryptic associations previously undiscovered by experts. 12
Developing a deep learning tool for long term ICH prognosis is challenging as patients are frequently lost to follow-up and are excluded in the development of existing ICH prognostic models.7–11 This leads to a lower sample size and cohort selection bias. Survival analysis, or time-to-event analysis, is well-suited to address differences in follow-up time, 13 by modeling the probability of onset of an event (e.g., death, disability) at each time point. By avoiding exclusion of patients with shorter follow-up, this approach could be more suitable for assessing both short- and long-term functional outcomes after ICH.
In this study, we integrated deep learning with survival analysis to predict long-term functional outcome after ICH from initial non-contrast CT (NCCT), the mainstay of ICH diagnosis. We developed and validated a deep learning-based survival analysis model, called fICHnet (functional outcome after ICH prediction network) to predict the probability of post-ICH functional impairment by 6, 12, and 24 months. We also assessed whether fICHnet, which was trained using the data from ICH survivors, was generalizable to ICH non-survivors. We hypothesized that fICHnet may capture additional prognostic information beyond traditional prognostic scores, potentially improving performance.
Methods
Cohorts descriptions
For training and internal validation of fICHnet, we used the MGH-ICH study, a single-center, longitudinal cohort of primary ICH patients at Massachusetts General Hospital (MGH) with prospective follow-up interviews between 1994 and 2019. 14 Patients were recruited prospectively during their admissions, when imaging and medical records were collected. Patients were followed up by phone interviews at 3, 6, 9, and 12 months, and every 6 months thereafter. Only patients with NCCT scans available at admission, and at least one follow-up interview were selected. For a small percentage of participants (Table 1), only comfort-related care was provided. Given the minimal contribution to the sample, they were not excluded. Hemorrhage location and intraventricular extension were available in this cohort as ascertained by the radiologists for prior studies. 14 ICH volume was extracted using the deepbleed package 15 and compared with manual volume ascertainment that had been performed in a subset of the cohort (Supplementary Methods and Supplementary Figure 1).
Baseline characteristics and post-ICH outcomes.
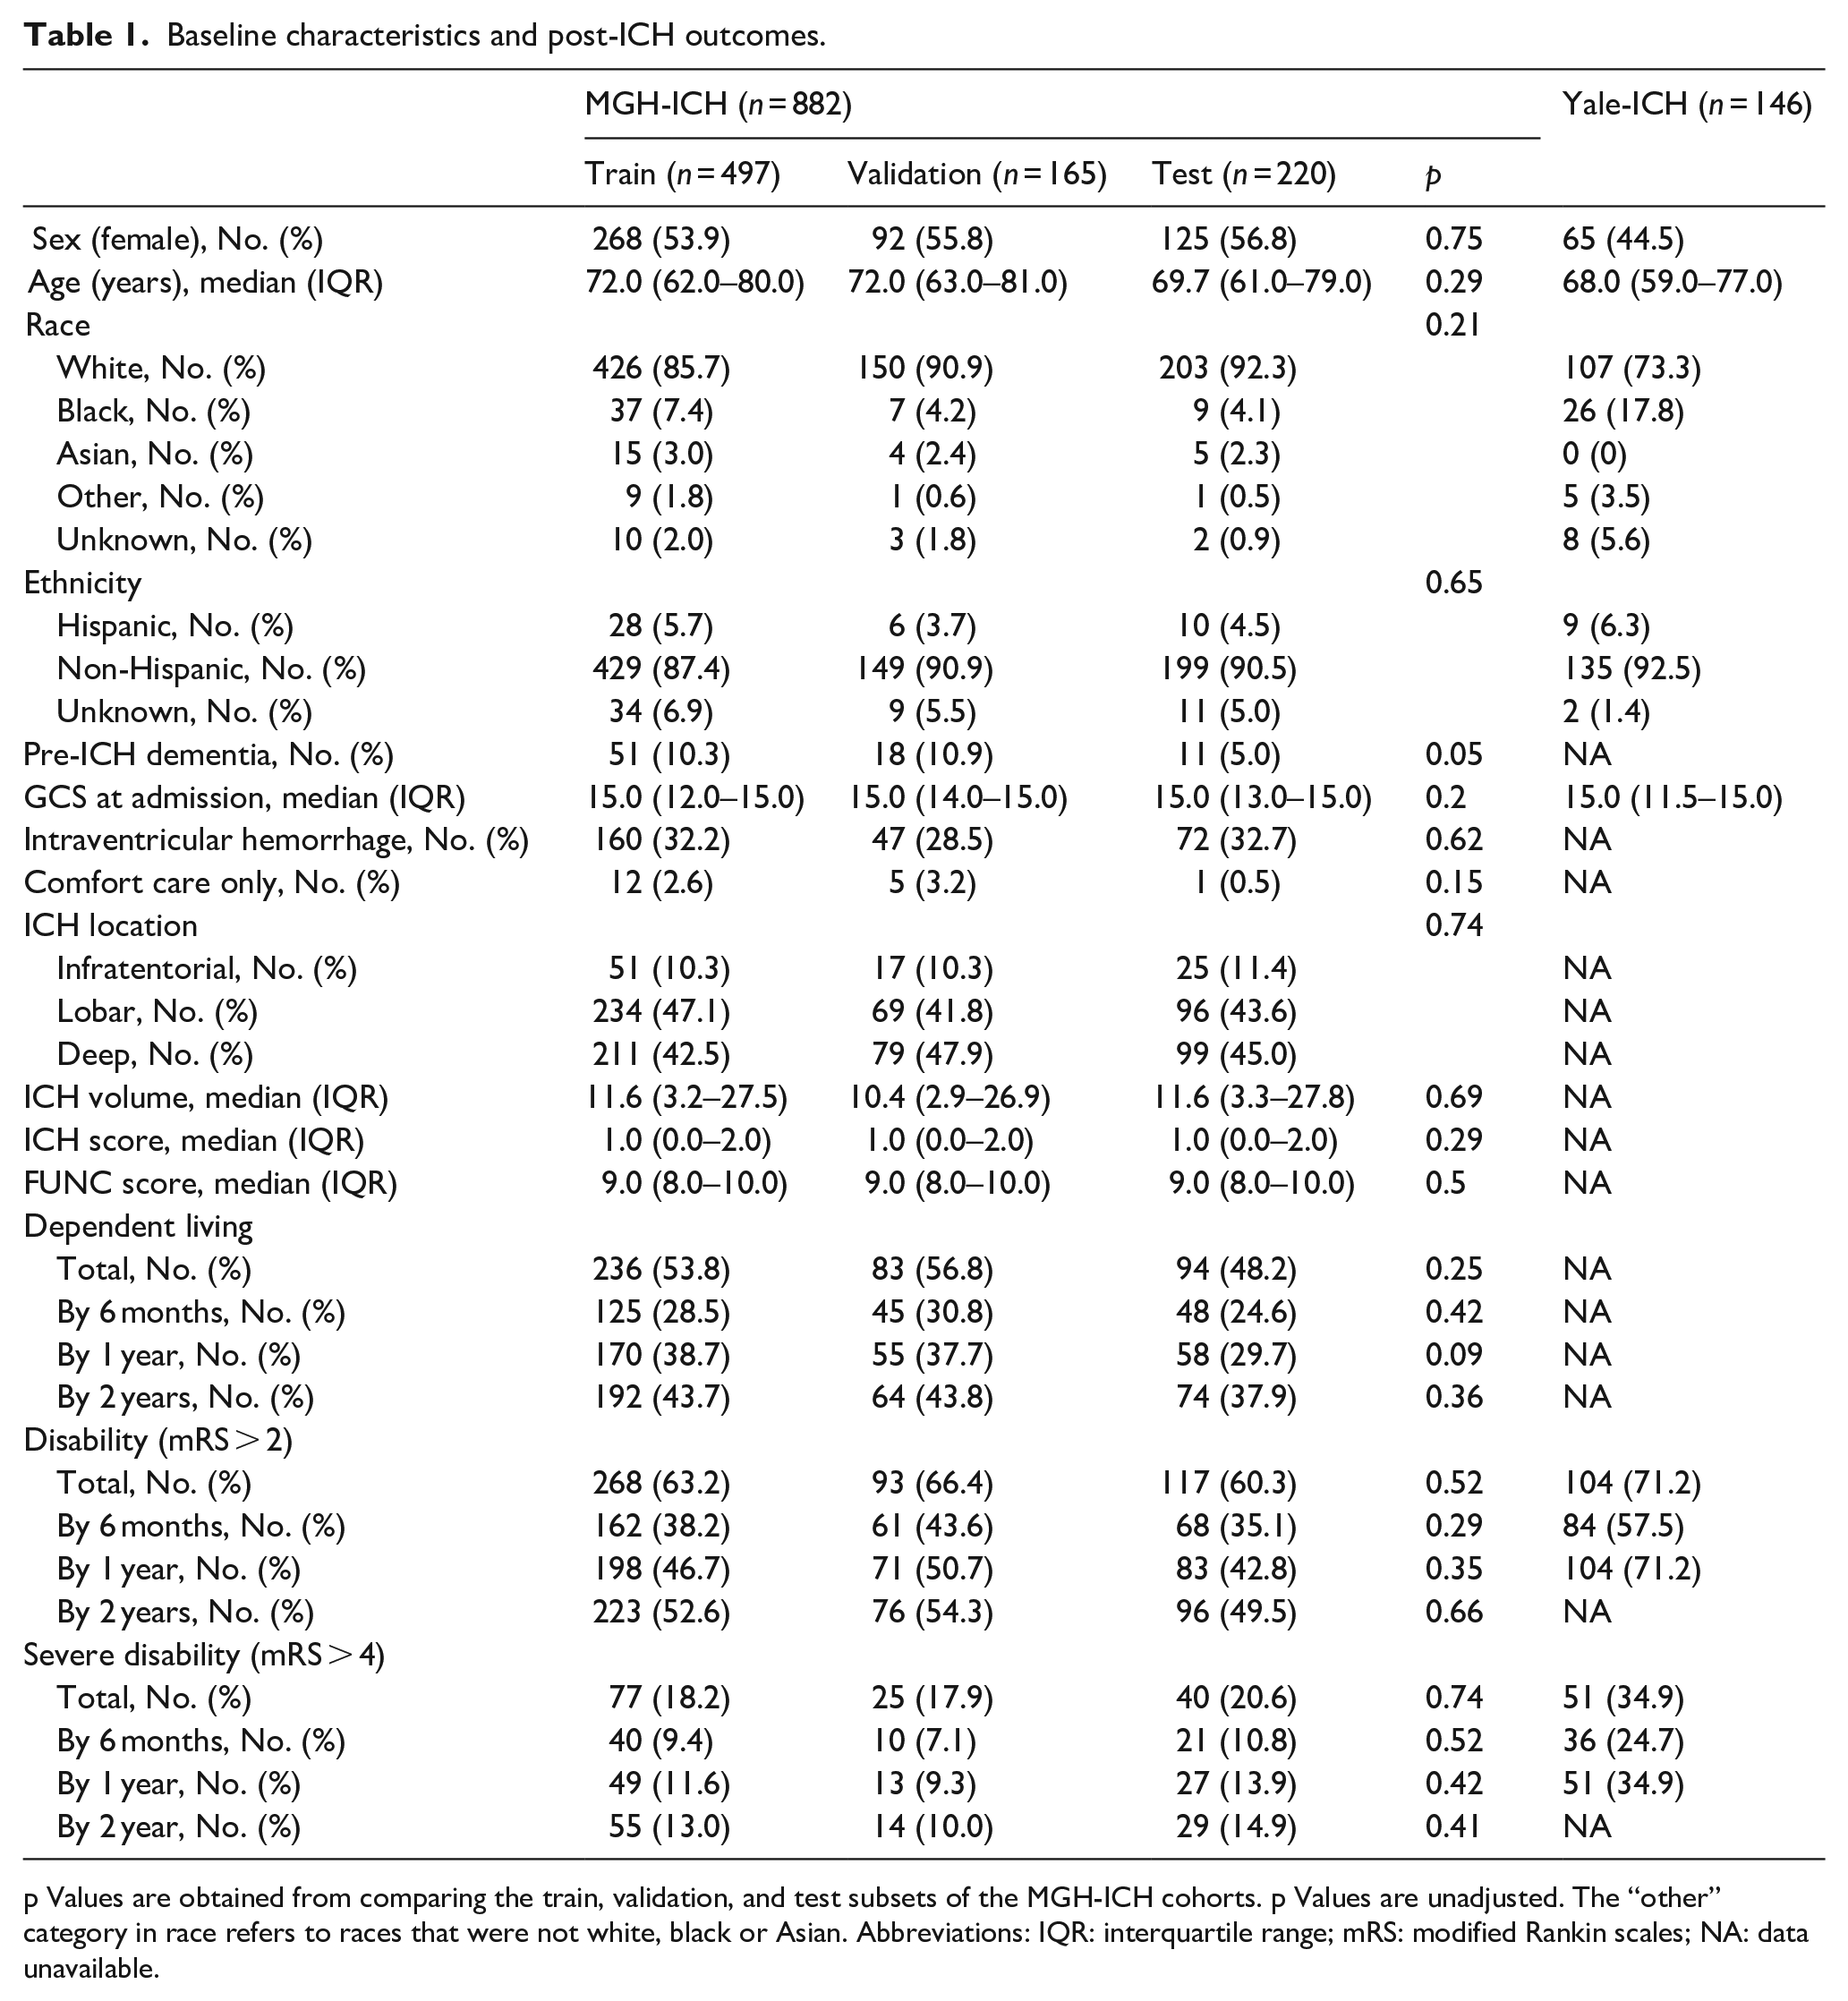
p Values are obtained from comparing the train, validation, and test subsets of the MGH-ICH cohorts. p Values are unadjusted. The “other” category in race refers to races that were not white, black or Asian. Abbreviations: IQR: interquartile range; mRS: modified Rankin scales; NA: data unavailable.
To test whether fICHnet is generalizable to one other center, we obtained performance metrics of the trained models in the Yale-ICH cohort, part of the Yale Longitudinal Study of Acute Brain Injury. This is an ongoing, prospective observational study of patients admitted to the Yale New Haven Hospital. All patients aged 18 years or older with ischemic stroke, hemorrhagic stroke, or traumatic brain injury are enrolled during the admitting process, unless patients opt out. Clinical data is collected through chart review and follow-up phone calls conducted by dedicated research staff every 6 months. Only patients with CT-confirmed primary ICH, NCCT scans available at admission, and at least one follow-up call were selected for this study.
To test the generalizability of fICHnet to patients that pass away from ICH in the early course of the disease, we compiled a cohort of ICH non-survivors from the Mass General Brigham (MGB) hospital network. We selected all patients with an ICD-code of I61 who were not part of the MGH-ICH study, were admitted since the introduction of the Epic electronic healthcare record system at MGB (Epic Systems Corporation Verona, WI, USA), and had a recorded death date in the Social Security Death Index within 6 months of ICH admission.
Outcome ascertainment
In the MGH-ICH cohort, during each of the follow-up interviews, investigators enquired the status of dependent living and assessed the functional status using the modified Rankin scale (mRS). 16 In the Yale-ICH cohort, mRS was assessed by chart review and follow up phone calls. In the MGH-ICH cohort, dependent living status was defined as participants living in a household with assistance from other people. In both cohorts, disability was defined as mRS > 2, 17 and severe disability as mRS > 4.
Training fICHnet
The MGH-ICH dataset was randomly split in a 12:3:4 ratio into train, validation, and test datasets. The validation dataset was used for hyperparameter optimization, and the best-performing model in the validation dataset was used in the test dataset to obtain performance metrics.
Each NCCT image was skullstripped to avoid the possibility of fICHnet overfitting to skull-related features instead of hemorrhage features and intrinsic brain features. To handle NCCT images of different resolutions, all images were resampled to a matrix size of 128 × 128 with 18 slices. Image registration was not performed as it reduced model performance in the validation dataset (Supplementary Results). The preprocessing pipeline is detailed in Supplementary Methods. Image augmentation was performed on the train dataset (Supplementary Methods).
Three separate deep learning models were trained to predict the probability of onset of the three outcomes: dependent living, disability, and severe disability by 6, 12, 18, and 24 months after the index ICH event. Onset time for each outcome was defined as the date of the interview at which the patient reported the outcome. The architecture of the network is depicted in Figure 1. Models were initialized with pre-trained available weights from the pytorch package version 2.0.1. Hyperparameter tuning is detailed in Supplementary Methods. The final setting was: the loss function being the logistic hazard function, the learning rate 0.0001, batch size 16, and the total number of training epochs 150. Different network architectures were tested in predicting different functional outcomes. In predicting dependent living and disability, resnet34 was the optimal architecture while in predicting severe disability, densenet121 was used.
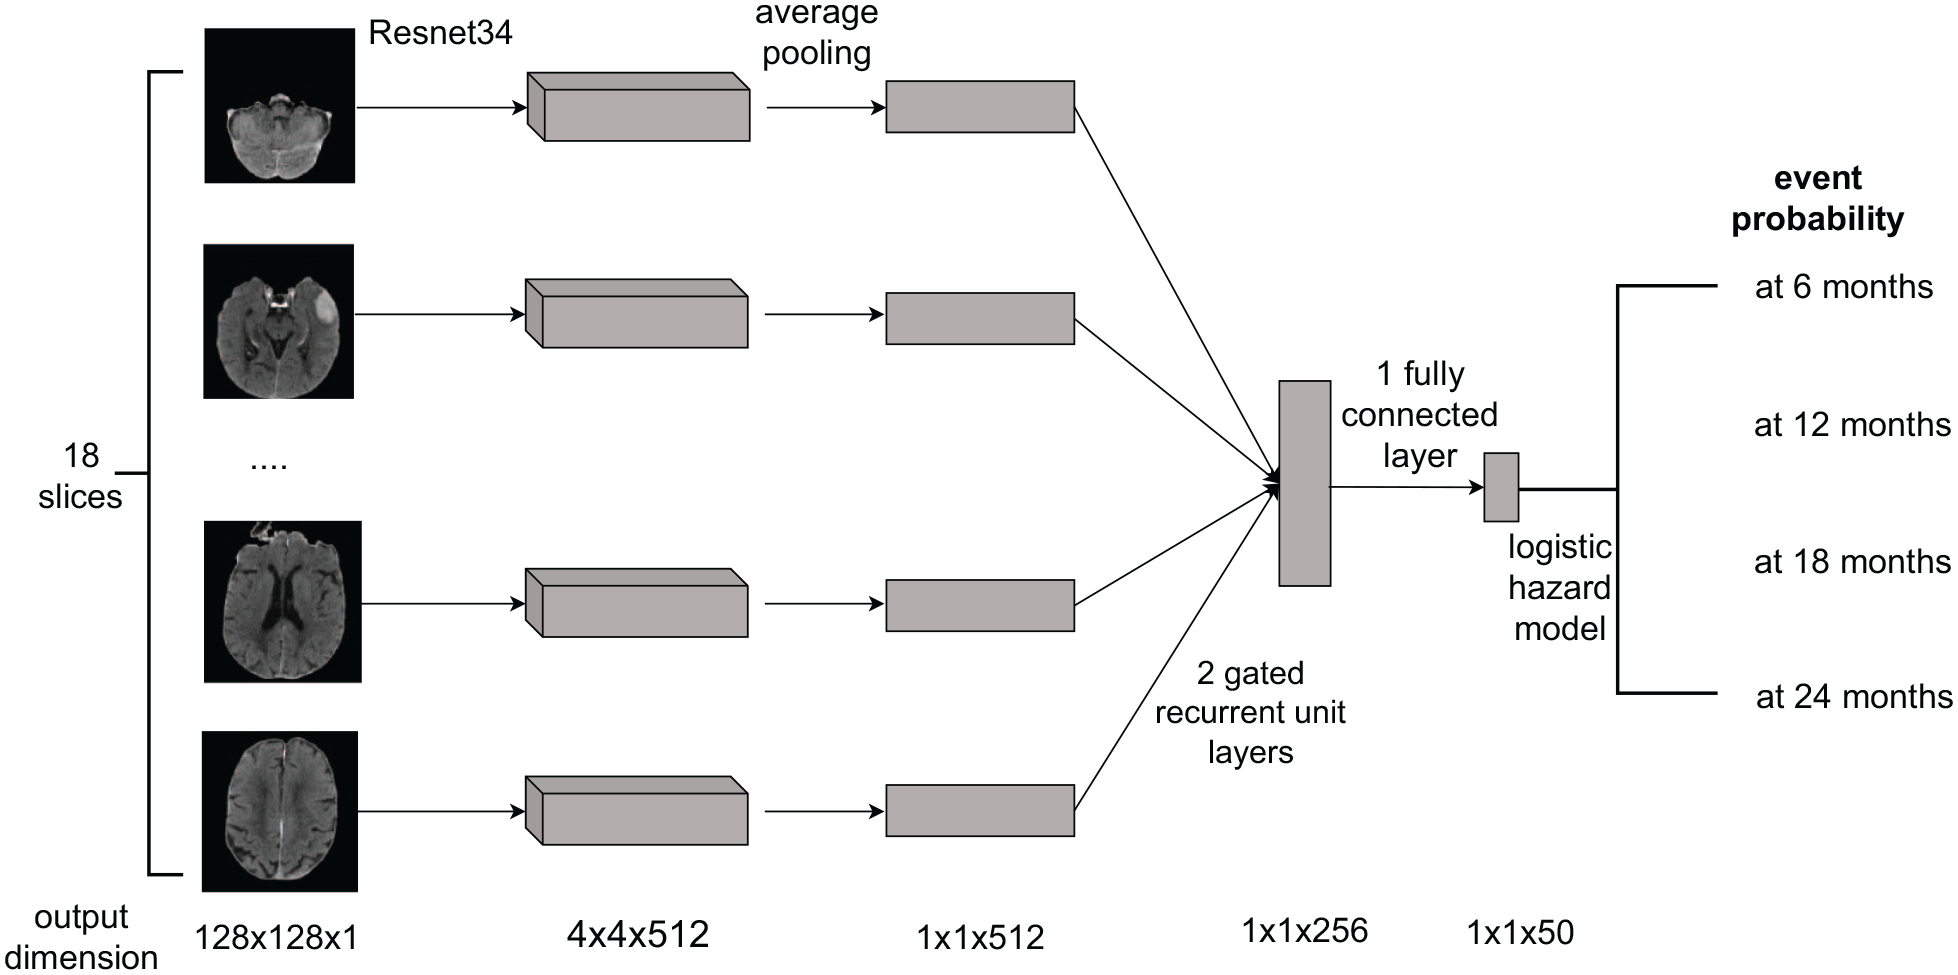
fICHnet architecture.
Statistics
Cohort characteristics
For normally distributed variables as assessed with the Shapiro–Wilk test, mean and standard deviation are reported, otherwise median and interquartile range (IQR). To compare training, validation, and test datasets, one-way ANOVA (for normally distributed), Kruskal–Wallis test (for not normally distributed), or Chi-square test with Yates correction were used. All hypothesis tests were performed two sided.
Development of deep learning models for prediction of outcomes: fICHnet
To compare the performance of fICHnet with ICH and FUNC scores, Cox proportional hazard models were constructed separately for ICH and FUNC scores to predict the probability of post-ICH outcomes at 6, 12, and 24 months.
The 95% confidence intervals of c-index, AUC, sensitivity, and specificity were calculated by 95% of the samples repeated 100 times.
To compare the c-indices of two different models, a similar approach to a previous study 18 was used. The mean and 95% confidence interval of the c-index were derived from bootstrapping. Assuming that c-index is normally distributed, 18 standard deviation was calculated by dividing 95% CI by 3.9. Welch’s t-test was performed by using the mean and standard deviation of the c-indices of two different models. To compare the AUC of two different models, DeLong’s test was applied.
The maximal Youden’s Index (sum of sensitivity and specificity-1) in the train subset of the MGH-ICH cohort was used to threshold the event probability output from the Cox models into a dichotomized measure of whether a patient develops a particular event. The threshold was determined separately for each model and each time point. The dichotomized measure was used to compute sensitivity and specificity. To compare the sensitivity and specificity of two different models, McNemar’s test was used.
In the Yale-ICH dataset, ICH score and FUNC score could not be calculated due to missing information of pre-ICH cognitive status, ICH location, and IVH status. In all datasets, participants whose ICH or FUNC score could not be calculated due to missing information were excluded from analyses related to ICH or FUNC score.
Calibrations of fICHnet in predicting the three studied post-ICH outcomes were detailed in Supplemental Methods.
Gaining insight into relevant brain areas for prediction: saliency mapping
To decipher the radiological correlates of the predicted outcome by fICHnet and improve its interpretability, we employed saliency maps, which indicate the voxels that the deep learning models weigh on when predicting post-ICH outcome. In a voxel, higher values indicate greater model emphasis on that voxel. Saliency maps were generated separately for each functional outcome using gradcam. 19 Three patients with lobar, deep, and infratentorial hemorrhage respectively were randomly selected for viewing.
To avoid the bias of randomly viewing saliency maps, we quantified the relationship between the hemorrhage and locations with high saliency values. The hemorrhagic area was segmented by the deepbleed package. 15 For each image in the train dataset, the CT slice containing the largest area of hemorrhage was selected. We calculated the Euclidean distance between the “center of mass” of the saliency values and the hemorrhage center, and divided the distance by the radius of the hemorrhage. Distribution of the distance was computed for each subtype of hemorrhage (lobar, deep, and infratentorial).
Sensitivity analysis
In the test set of the MGH-ICH cohort, the AUC of predicting each functional outcome was compared at each time point between each subgroup: age > 70 years versus age ⩽70 years, males vs females, lobar vs non-lobar ICH. Comparison was performed using DeLong’s test.
Evaluating the performance of fICHnet in ICH non-survivors
We input the scans from ICH non-survivors into fICHnet and calculated the probability of developing each post-ICH functional outcome. The results were compared with the probability of developing those outcomes in the MGH-ICH cohort (ICH survivors) using Wilcoxon rank sum test.
Softwares
Image analyses, Cox model, and deep learning model developments were performed using python version 3.8.11 using pytorch 20 and H2O 21 on CentOS Linux 7 on one NVIDIA Tesla V100 graphic processing unit (GPU). Statistical analyses were performed on R version 4.1.0 on Ubuntu 22.04. This manuscript followed the Guidelines for Developing and Reporting Machine Learning Predictive Models. 22
Results
Cohort characteristics
Between July 1994 and October 2019, 1,073 patients from the MGH-ICH study were eligible for analysis. After excluding 18 patients without follow-up outcomes, 162 without NCCT and 11 with incompletely covered brains on NCCT scans, 882 patients remained (Figure 2). Participants who were excluded had significantly higher age and more of them had disabilities after ICH (Supplementary Table 1). The median follow up time for dependent living was 2.9 years (interquartile range (IQR) 1.1–5.8) and for disability and severe disability was 2.8 years (IQR 0.6–5.9). There were no significant differences in characteristics of the 497 patients in the train, 165 in the validation, and 220 in the test dataset, demonstrating sufficient randomization (Table 1).
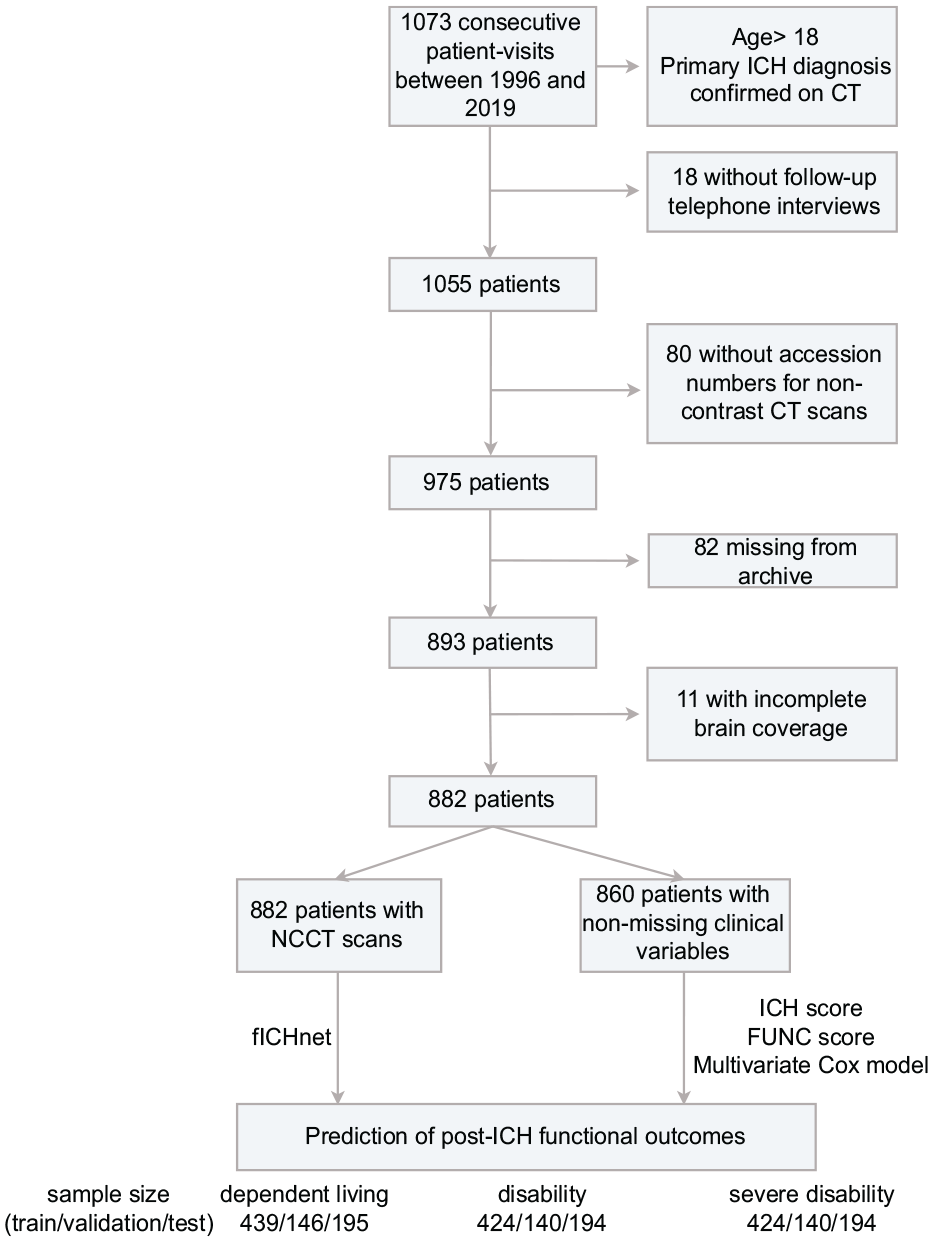
Patient selection flowchart in the MGH-ICH cohort.
We identified 159 eligible patients in the Yale-ICH cohort to measure performance of selected models, of which we excluded 13 due to missing follow up (Table 1).
The independent non-survivor cohort comprised 485 ICH patients who died within 6 months after ICH (Supplementary Figure 2 and Supplementary Table 2). Patients in the non-survivor cohort were on average older than in the MGH-ICH training cohort (75.0 years, (IQR 63.5–84.0), vs 71.0 years, (IQR 62.0–80.0); p < 0.001), less likely to be female (43.3% vs 55.0%; p < 0.001), and less likely to be White and Non-Hispanic (77.9% vs 88.3% and 81.4% vs 88.8%, respectively; both p < 0.001).
Development of deep learning models for prediction of outcomes: fICHnet
fICHnet was trained separately in predicting each of the post-ICH outcomes. In each prediction task, the 95% CI of the c-indices and AUCs were consistently above 0.5, which is the accuracy of a random classifier.
Dependent living status
In predicting the development of dependent living, fICHnet achieved a c-index of 0.742 (95% confidence interval (CI) 0.700–0.778) in the test dataset (Table 2). This was significantly higher than the c-index for ICH score (0.673 (95% CI 0.662–0.688), p < 0.001) and FUNC score (0.701 (95% CI 0.698–0.723), p < 0.001) respectively. Regarding the AUC of predicting dependent living at 6 months, 1 and 2 years after ICH, we found no significant difference in the performance of fICHnet compared with ICH and FUNC scores (Figure 3). The sensitivity of predicting dependent living was significantly higher in fICHnet compared to ICH/FUNC scores in each timepoint, except between fICHnet and ICH score 1 year after ICH (Supplementary Table 3). However, the specificity was significantly lower in fICHnet in each timepoint, except between fICHnet and ICH score 1 year after ICH (Supplementary Table 4).
Performance of different methods in predicting post-ICH outcomes in the test set of the MGH-ICH dataset, and the Yale-ICH dataset.
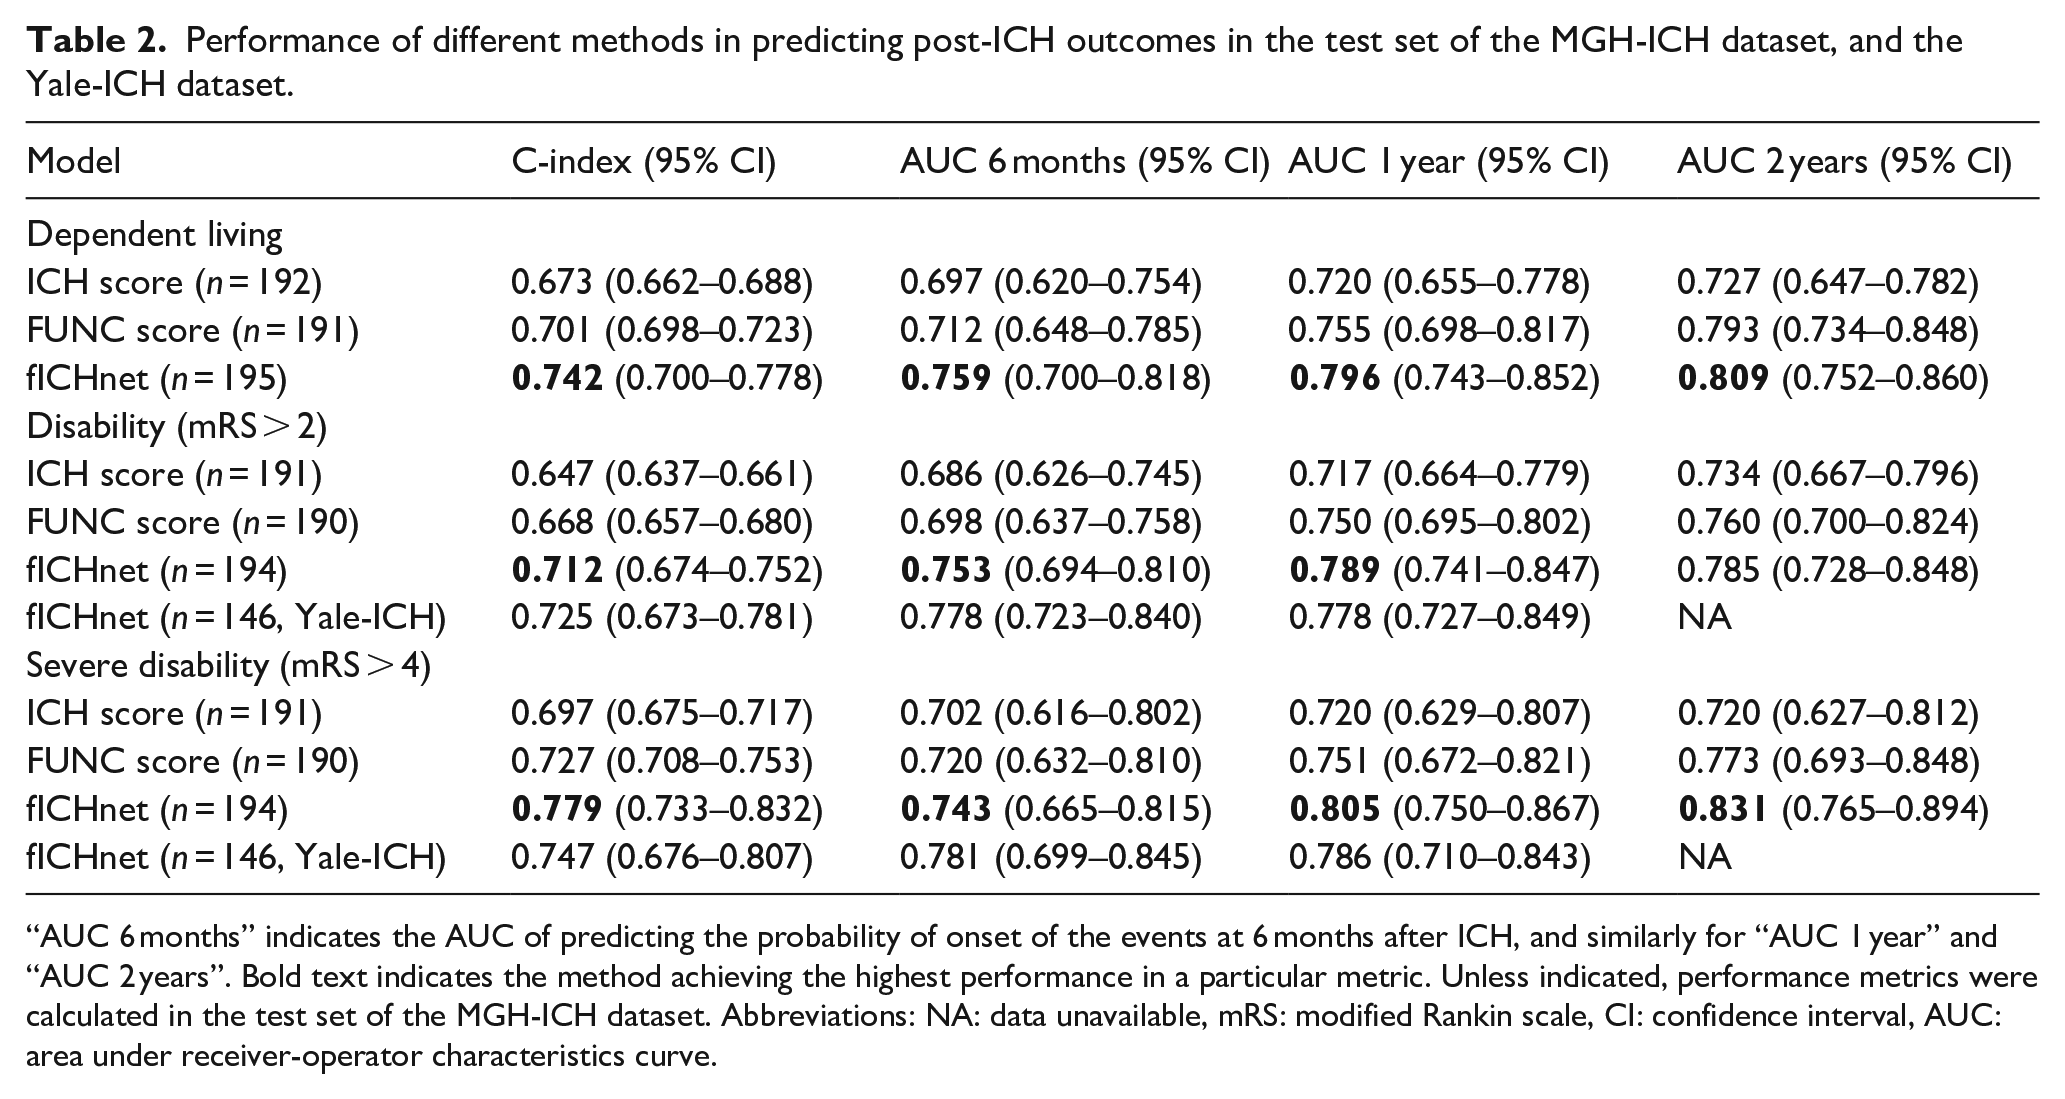
“AUC 6 months” indicates the AUC of predicting the probability of onset of the events at 6 months after ICH, and similarly for “AUC 1 year” and “AUC 2 years”. Bold text indicates the method achieving the highest performance in a particular metric. Unless indicated, performance metrics were calculated in the test set of the MGH-ICH dataset. Abbreviations: NA: data unavailable, mRS: modified Rankin scale, CI: confidence interval, AUC: area under receiver-operator characteristics curve.
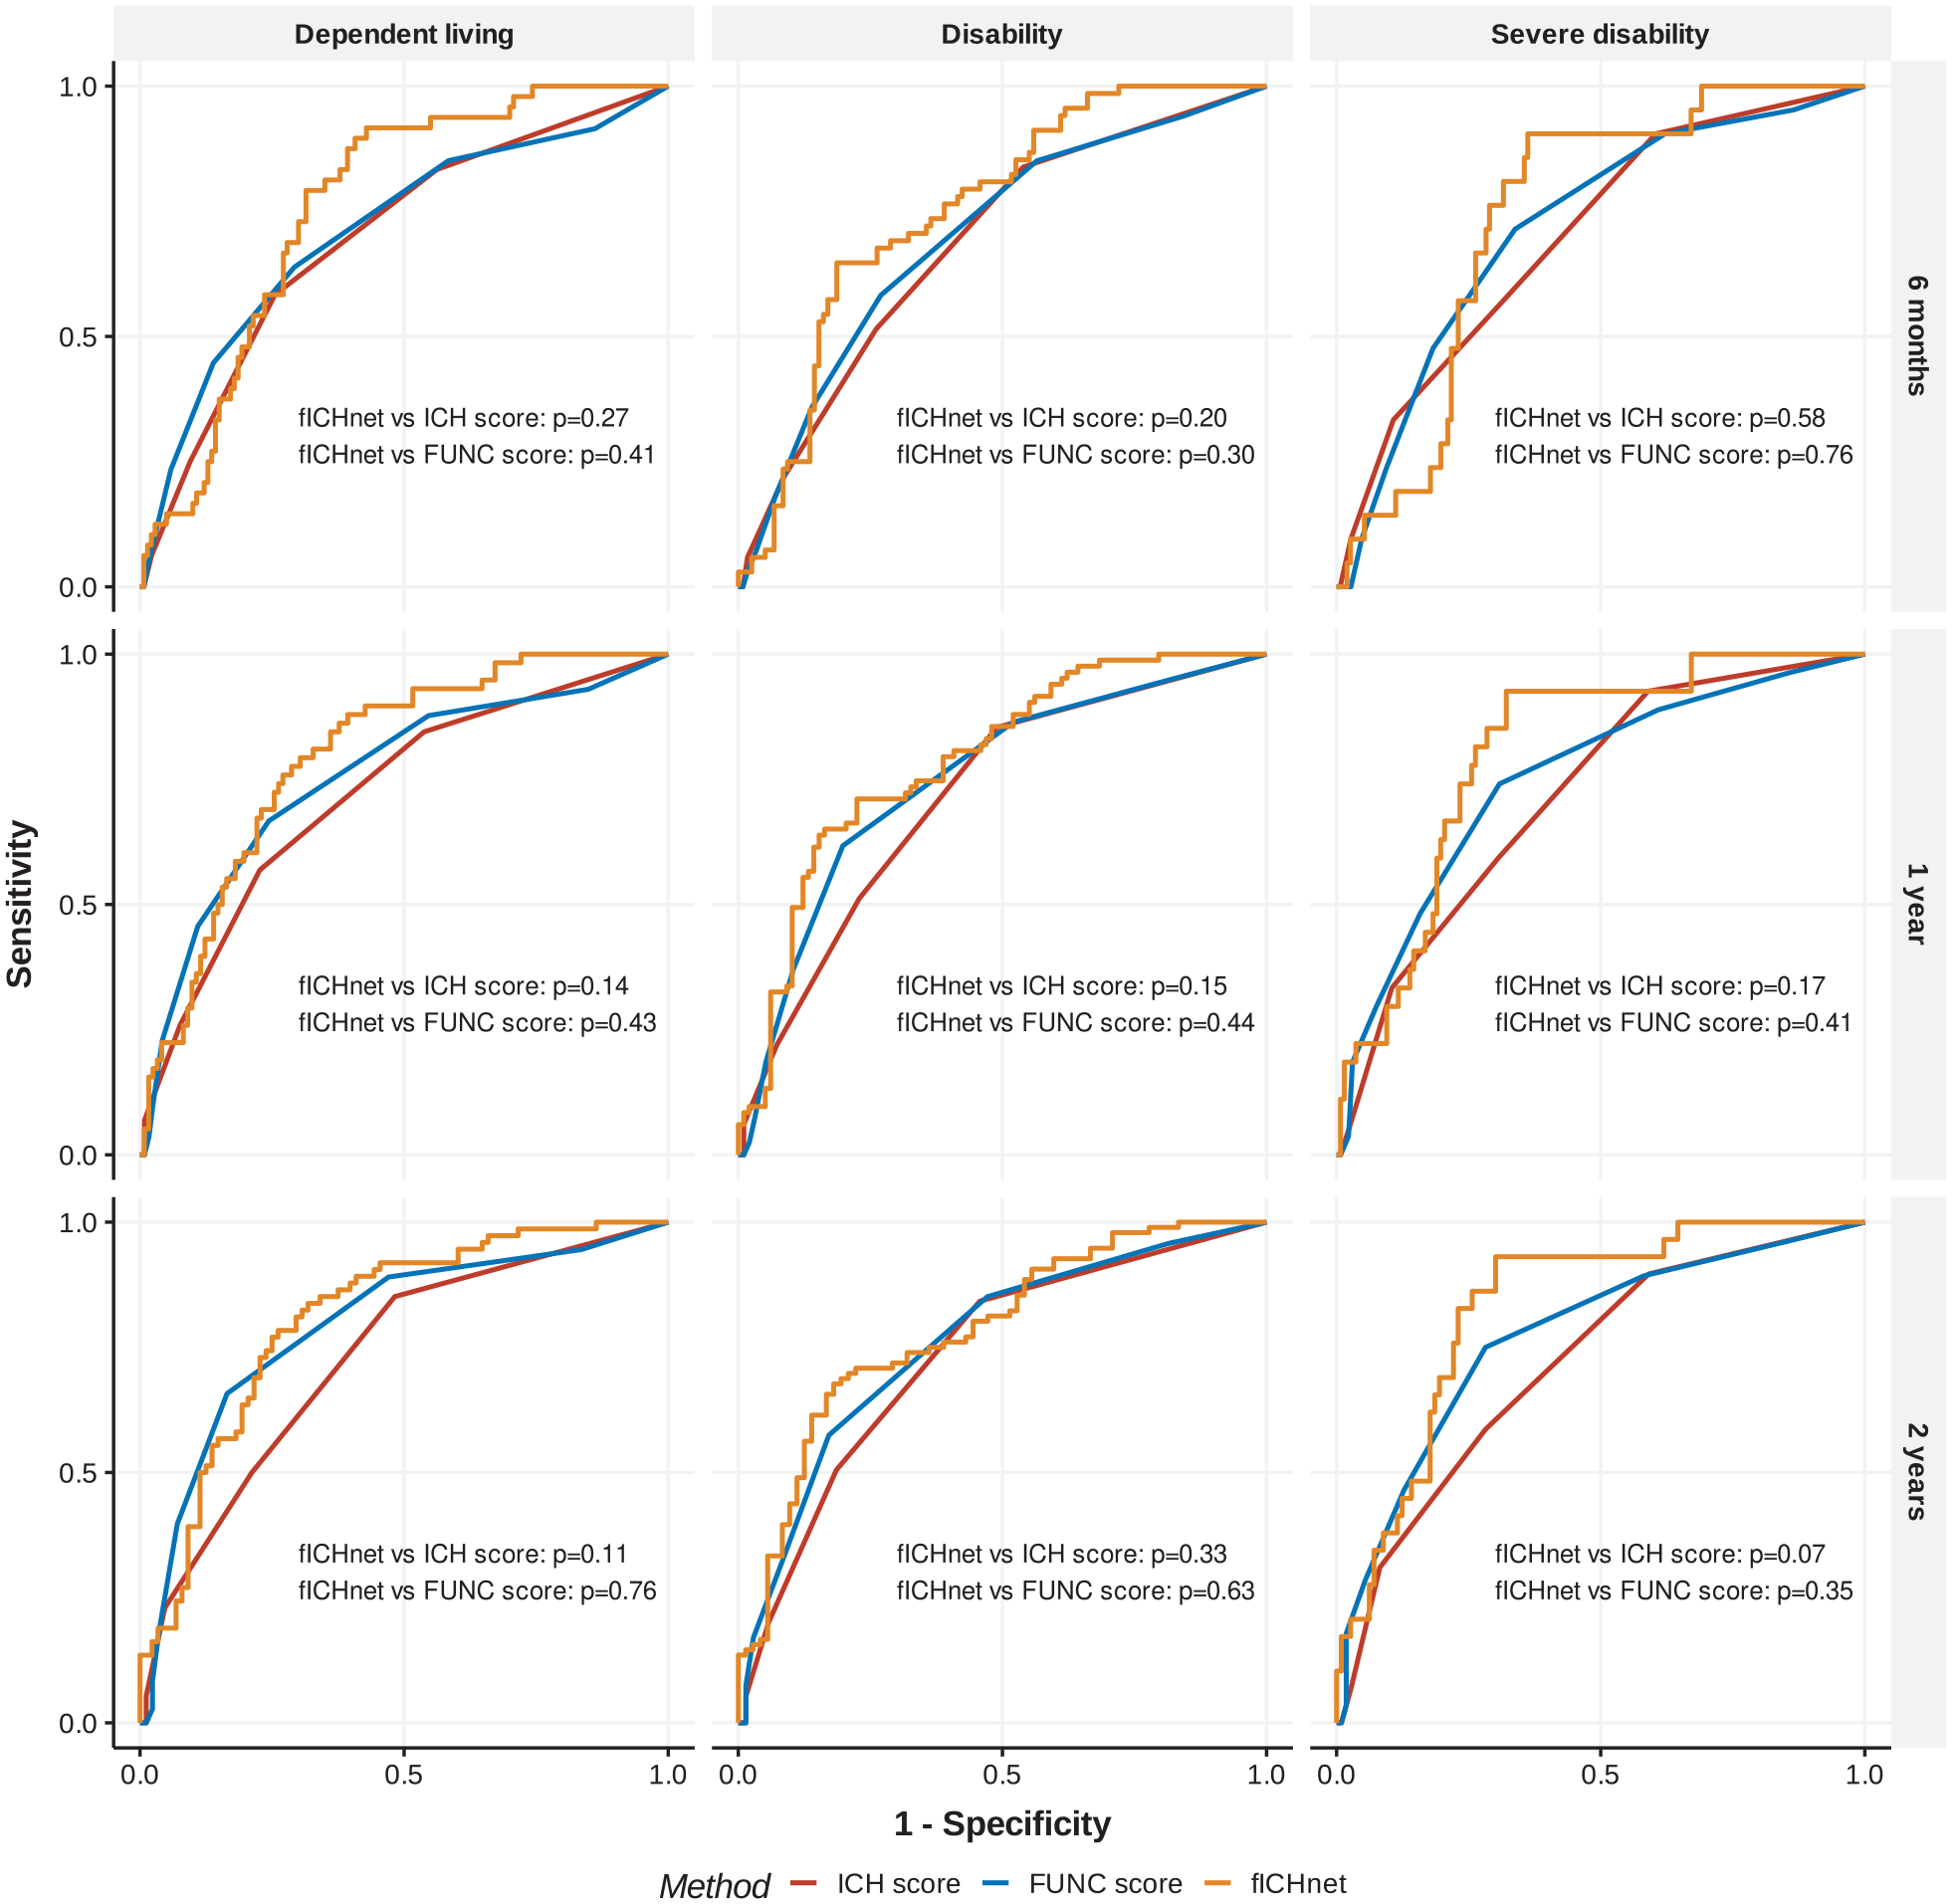
Receiver operator characteristics (ROC) curve for prediction models of post-ICH functional outcomes at different time points.
Disability status
We found the c-index of fICHnet was 0.712 (95% CI 0.674–0.752) in predicting disability and 0.779 (95% CI 0.733–0.832) in predicting severe disability. We applied fICHnet to the independent Yale-ICH cohort and replicated the performance metrics for predicting the onset of disability (c-index 0.725 [95% CI 0.673–0.781]) and severe disability (c-index 0.747 [95% CI 0.676–0.807]). fICHnet displayed higher performance compared with ICH scores (c-index 0.647 [95% CI 0.637–0.661], p < 0.001 in t-test between fICHnet and ICH score) and FUNC scores (c-index 0.668 [95% CI 0.657–0.680], p < 0.001). Regarding the AUC of predicting disability and severe disability at 6 months, 1 and 2 years after ICH, we found no significant improvement of fICHnet compared with ICH score and FUNC score (Figure 3), suggesting similar performance. The sensitivity of predicting disability and severe disability was significantly higher in fICHnet compared to ICH/FUNC scores in each timepoint (Supplementary Table 3). However, the specificity was significantly lower in fICHnet in each timepoint, except between fICHnet and FUNC score 2 years after ICH (Supplementary Table 4). We found a good calibration of fICHnet in predicting disability, with a tendency towards underestimating the frequency of severe disability (Supplementary Figure 3). The computation time to process one NCCT scan was 2.2 ± 0.4 s on 3 Intel Xeon CPUs with 8G of random access memory.
Gaining insight into relevant brain areas for prediction: saliency mapping
Saliency mapping showed that fICHnet relied upon both ICH regions and non-ICH regions when predicting post-ICH outcomes. Across all patients in the training dataset, the models weighed on the hemorrhage in patients with infratentorial hemorrhage, but outside the hemorrhage in patients with deep and lobar hemorrhage (Supplementary Figure 4). When examining three randomly selected patients with lobar, deep, and infratentorial hemorrhage, respectively, for prediction of severe disability, fICHnet focused on the hemorrhage in patient one, on the thalamus not affected by hemorrhage in patient two, and on the hemorrhage and other cortical regions in patient three (Figure 4).
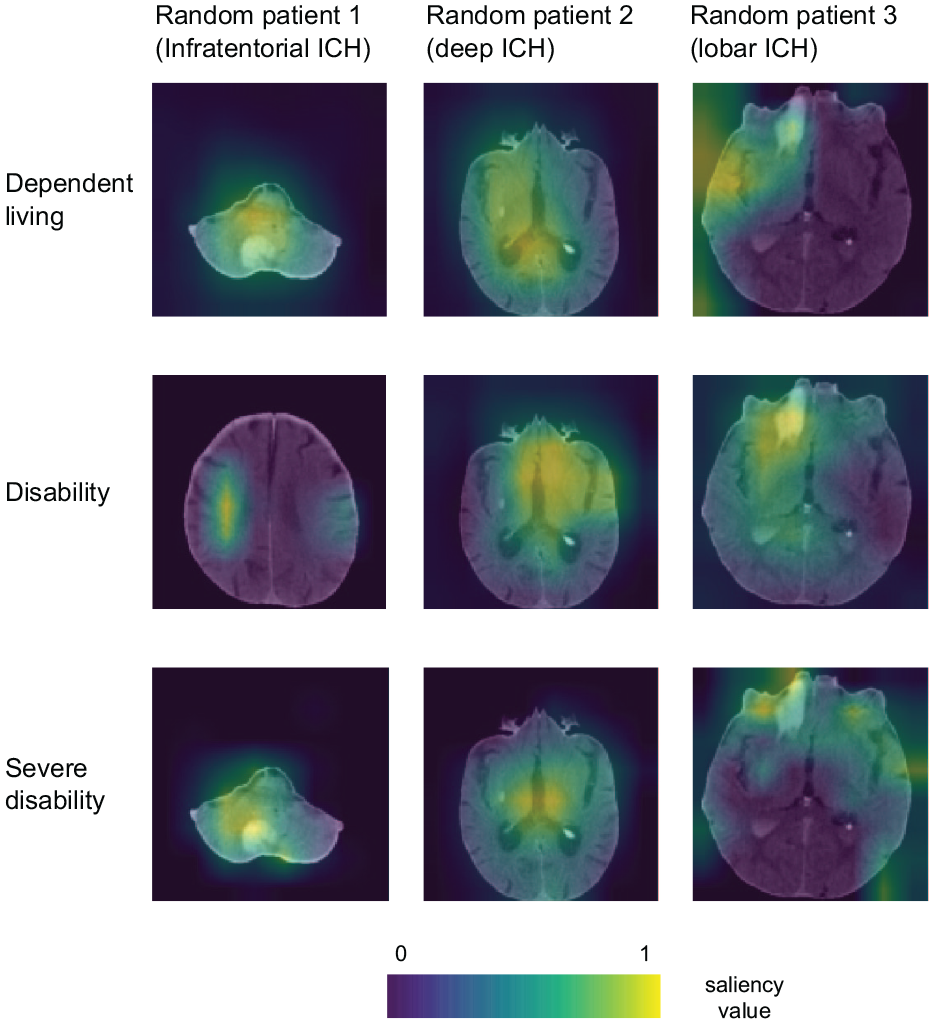
Saliency maps superimposed on the NCCT scans.
Sensitivity analysis
In predicting the development of post-ICH disability 6 months after ICH, the AUC of fICHnet was significantly lower in the older age group (>70 years) (0.667 [95% CI 0.571–0.801]) compared with the younger age group (0.815 [95% CI 0.710–0.893], p = 0.043) (Supplementary Table 5). The AUC was also lower for prediction of dependent living and severe disability, however these differences were not significant. There were no significant differences in prediction accuracy between female and male patients, or between lobar and non-lobar ICH.
Evaluating the performance of fICHnet in ICH non-survivors
Applying fICHnet on the CT scans of ICH non-survivors, the mean predicted probabilities of dependent living, disability, and severe disability were significantly higher than in the MGH-ICH cohort (Supplementary Figure 5).
Discussion
We report the development and performance of fICHnet, a deep learning-based survival analysis model that predicts both short and long term outcomes after ICH. Using the information from admission NCCT to predict post-ICH functional outcomes, fICHnet showed a significantly higher c-index compared with traditional clinical prognostic scores and similar AUC of predicting these outcomes 6 months, 1 and 2 years after ICH. Among ICH non-survivors, fICHnet predicted a higher likelihood of dependent living and disability compared with ICH survivors, consistent with the observed early mortality of these patients.
fICHnet is fully automatic and with a computational speed of 2.2 s per scan, it is not resource-demanding. It does not require additional manual segmentation or interpretation on the input NCCT scans, whereas existing scoring systems require user-ascertained information about ICH location, volume, and IVH.11,23 The use of admission NCCT scans means a lower barrier of utilizing our method for ICH prognosis, compared with methods that require specific blood tests24,25 or imaging sequences. 26 Despite being trained on an ICH survivor cohort, our model is applicable to both survivors and non-survivors in predicting the onset of dependent living and disability. Taken together, the advantages of our model include its automatic nature, the use of routinely available imaging information, and low survival bias.
We attempted to reduce cohort selection bias by employing a large longitudinal cohort as the training dataset, a separate ICH survivor cohort as validation, and another cohort of ICH non-survivors, representing patients from 9 different hospitals and 42 different CT scanner models. In contrast to prior studies that employed methods that require exclusion of patients with missing follow-up data, our survival analysis framework allowed incorporation of those patients into training the prediction model, which could reduce cohort selection bias.
fICHnet addresses the current lack of machine learning tools that predict post-ICH functional outcomes both in the short and long terms. Although a growing body of NCCT-based ICH prognostic models have been developed to predict post-ICH disability with an AUC between 0.80 and 0.85,9–11 to date they are limited to ICH outcomes at a single time point either at 3 months post-ICH or at discharge. In contrast, fICHnet enables prediction of functional outcomes at multiple time points in a single model.
By performing saliency mapping, we provide insight and interpretability into the radiographic correlates utilized by fICHnet to ascertain post-ICH outcomes. These saliency maps demonstrate that in infratentorial hemorrhage, fICHnet weighs the hemorrhage itself most strongly in prediction of post-ICH outcome. For lobar and deep ICH, the most salient areas lie adjacent to or outside the ICH. This could indicate ICH-induced mass effect or perihematomal edema, which is associated with worse functional outcome.27–29 These saliency mapping results could provide directions for future research into mechanisms of post-ICH disability.
There are limitations to our study that warrant consideration. First, although fICHnet achieved higher c-index and AUC of prediction, the improvement in AUC was not statistically significant. This lack of a significant AUC improvement may be due to the relatively lower fICHnet performance in patients above the age of 70, which reduced the overall accuracy. Because participants who were excluded due to a lack of CT scans tended to be older and have more severe ICH, the MGH-ICH dataset skewed toward relatively younger patients (72 years on average) with relatively milder ICH, hindering our model’s exposure to older, sicker patients. Future studies should include an ICH survivor population of a more diverse age group and ICH severity to further improve the prognostic accuracy of fICHnet.
Secondly, NCCT images underwent various preprocessing steps including skullstripping, cropping, and resizing to automatically fit images of different resolutions and fields of view from different scanners into a standard format for analysis. The impact of these individual preprocessing steps on fICHnet performance was not fully explored. To reduce the need for preprocessing, future research should explore ways to make fICHnet contrast-invariant and scale-invariant such as using a generative model. 30
Third, survival analysis can only predict binary outcomes, for example, survival versus death, disabled or non-disabled. It cannot predict ordinal variables such as mRS. Our approach of dichotomizing mRS at mRS > 2 (disability) and mRS > 4 (severe disability) may lose prognostic information. 4
Fourthly, fICHnet was trained to predict onset of events such as disability but not what happens after the onset, such as whether the patient’s disability will improve or deteriorate. The inability to model patient recovery is a general issue with survival models upon which fICHnet is based. In the MGH-ICH cohort, 26.5% patients recovered from a temporary status of dependent living after ICH, 15% from disability, and 20% from severe disability. Multiple factors contribute to patients’ recovery such as the extent of rehabilitation therapy 31 and patients’ expectations of recovery. 32 Future research could leverage a similar survival framework as fICHnet to predict ICH functional recovery through multiple state changes. In general, prognosis after ICH is probably better than predicted using existing clinical and novel deep learning-based tools such as fICHnet. This is due to “self-fulfilling prophecy” as life-sustaining measures 32 are differentially applied in patients with large ICH on admission, which biases the observation of true outcomes in the clinical setting.
Lastly, a previous study has shown that the modified ICH score calculated in the first 72 h of ICH outperformed the score at baseline in predicting functional outcomes. 33 To further improve the prognostic accuracy of fICHnet, future studies should apply fICHnet on CT scans obtained 72 h after ICH, and combine the prognostic information from baseline and follow-up scans.
In conclusion, fICHnet is a validated, fast, and automatic tool to predict long term outcomes after ICH, and with further developments could become valuable in guiding the treatment and disposition of ICH patients.
Non-standard abbreviations and acronyms
AUC: area under curve
CI: confidence interval
CT: computed tomography
ICH: intracerebral hemorrhage
IQR: interquartile range
fICHnet: functional outcome after ICH prediction network
IVH: intraventricular hemorrhage
GCS: Glasgow coma scale
GPU: graphic processing unit
MGB: Mass General Brigham
MGH: Massachusetts General Hospital
mRS: modified Rankin scale
NCCT: non-contrast computed tomography
Supplemental Material
sj-docx-1-eso-10.1177_23969873241260154 – Supplemental material for Deep learning survival model predicts outcome after intracerebral hemorrhage from initial CT scan
Supplemental material, sj-docx-1-eso-10.1177_23969873241260154 for Deep learning survival model predicts outcome after intracerebral hemorrhage from initial CT scan by Yutong Chen, Cyprien A Rivier, Samantha A Mora, Victor Torres Lopez, Sam Payabvash, Kevin N Sheth, Andreas Harloff, Guido J Falcone, Jonathan Rosand, Ernst Mayerhofer and Christopher D Anderson in European Stroke Journal
Footnotes
Acknowledgements
We thank the radiology departments at MGB and Yale for organizing the CT scans for this study.
Declaration of conflicting interest
The author(s) declared the following potential conflicts of interest with respect to the research, authorship, and/or publication of this article: J.R. reports compensation from National Football League for expert witness services from Takeda Development Center Americas and Boehringer Ingelheim for consultant services, all unrelated to this work. C.D.A. has received sponsored research support from Bayer AG and has consulted for ApoPharma unrelated to this work. E.M. is now a full-time employee of Regeneron Pharmaceuticals.
Funding
The author(s) disclosed receipt of the following financial support for the research, authorship, and/or publication of this article: C.D.A is supported by NIH R01NS103924, U01NS069673, AHA 18SFRN34250007, AHA-Bugher 21SFRN812095, and the MGH McCance Center for Brain Health. J.R. receives research grants from NIH and the American Heart Association-Bugher Foundation. A.H. is supported by the Berta-Ottenstein-Program for Advanced Clinician Scientists, Faculty of Medicine, University of Freiburg, Germany.
Ethical approval
The use of the MGH-ICH cohort was approved by the Mass General Brigham (MGB) Institutional Review Board (IRB2006P000570). The use of the MGB-ICH cohort was approved by the MGB Institutional Review Board (IRB2015P000046). The use of the Yale-ICH cohort was approved by the local Institutional Review Board (IRB1405014045).
Informed consent
Informed consent was not sought for the present study because the MGB and Yale IRB approved our use of anonymized patient information.
Trial registration
Not applicable because this study was not a clinical trial.
Guarantor
C.D.A
Contributorship
Y.C., E.M., and C.D.A conceived the study. E.M. and S.M. collected the data from the MGH-ICH and non-survivor cohorts. C.R., V.T., and S.P. collected the data for the Yale-ICH cohort. Y.C. developed the deep learning model. Y.C. and E.M. performed all the statistical analyses. C.R. performed validations of the model on the Yale-ICH cohort. Y.C. and E.M. drafted the initial version of the manuscript. C.D.A revised the manuscript. All authors read and revised the manuscript.
Data availability
Supplemental material
Supplemental material for this article is available online.
References
Supplementary Material
Please find the following supplemental material available below.
For Open Access articles published under a Creative Commons License, all supplemental material carries the same license as the article it is associated with.
For non-Open Access articles published, all supplemental material carries a non-exclusive license, and permission requests for re-use of supplemental material or any part of supplemental material shall be sent directly to the copyright owner as specified in the copyright notice associated with the article.