
Abstract
Introduction:
The role of serum uric acid (UA) levels in the functional recovery of ischemic stroke remains uncertain. To evaluate whether UA could predict clinical outcomes in patients with ischemic stroke.
Patients and methods:
A three-stage study design was employed, combining a large-scale prospective cohort study, a meta-analysis and a Mendelian randomization (MR) analysis. Firstly, we conducted a cohort study using data from the Nanjing Stroke Registry Program (NSRP) to assess the association between UA levels and 3-month functional outcomes in ischemic stroke patients. Secondly, the meta-analysis was conducted to integrate currently available cohort evidence. Lastly, MR analysis was utilized to explore whether genetically determined UA had a causal link to the functional outcomes of ischemic stroke using summary data from the CKDGen and GISCOME datasets.
Results:
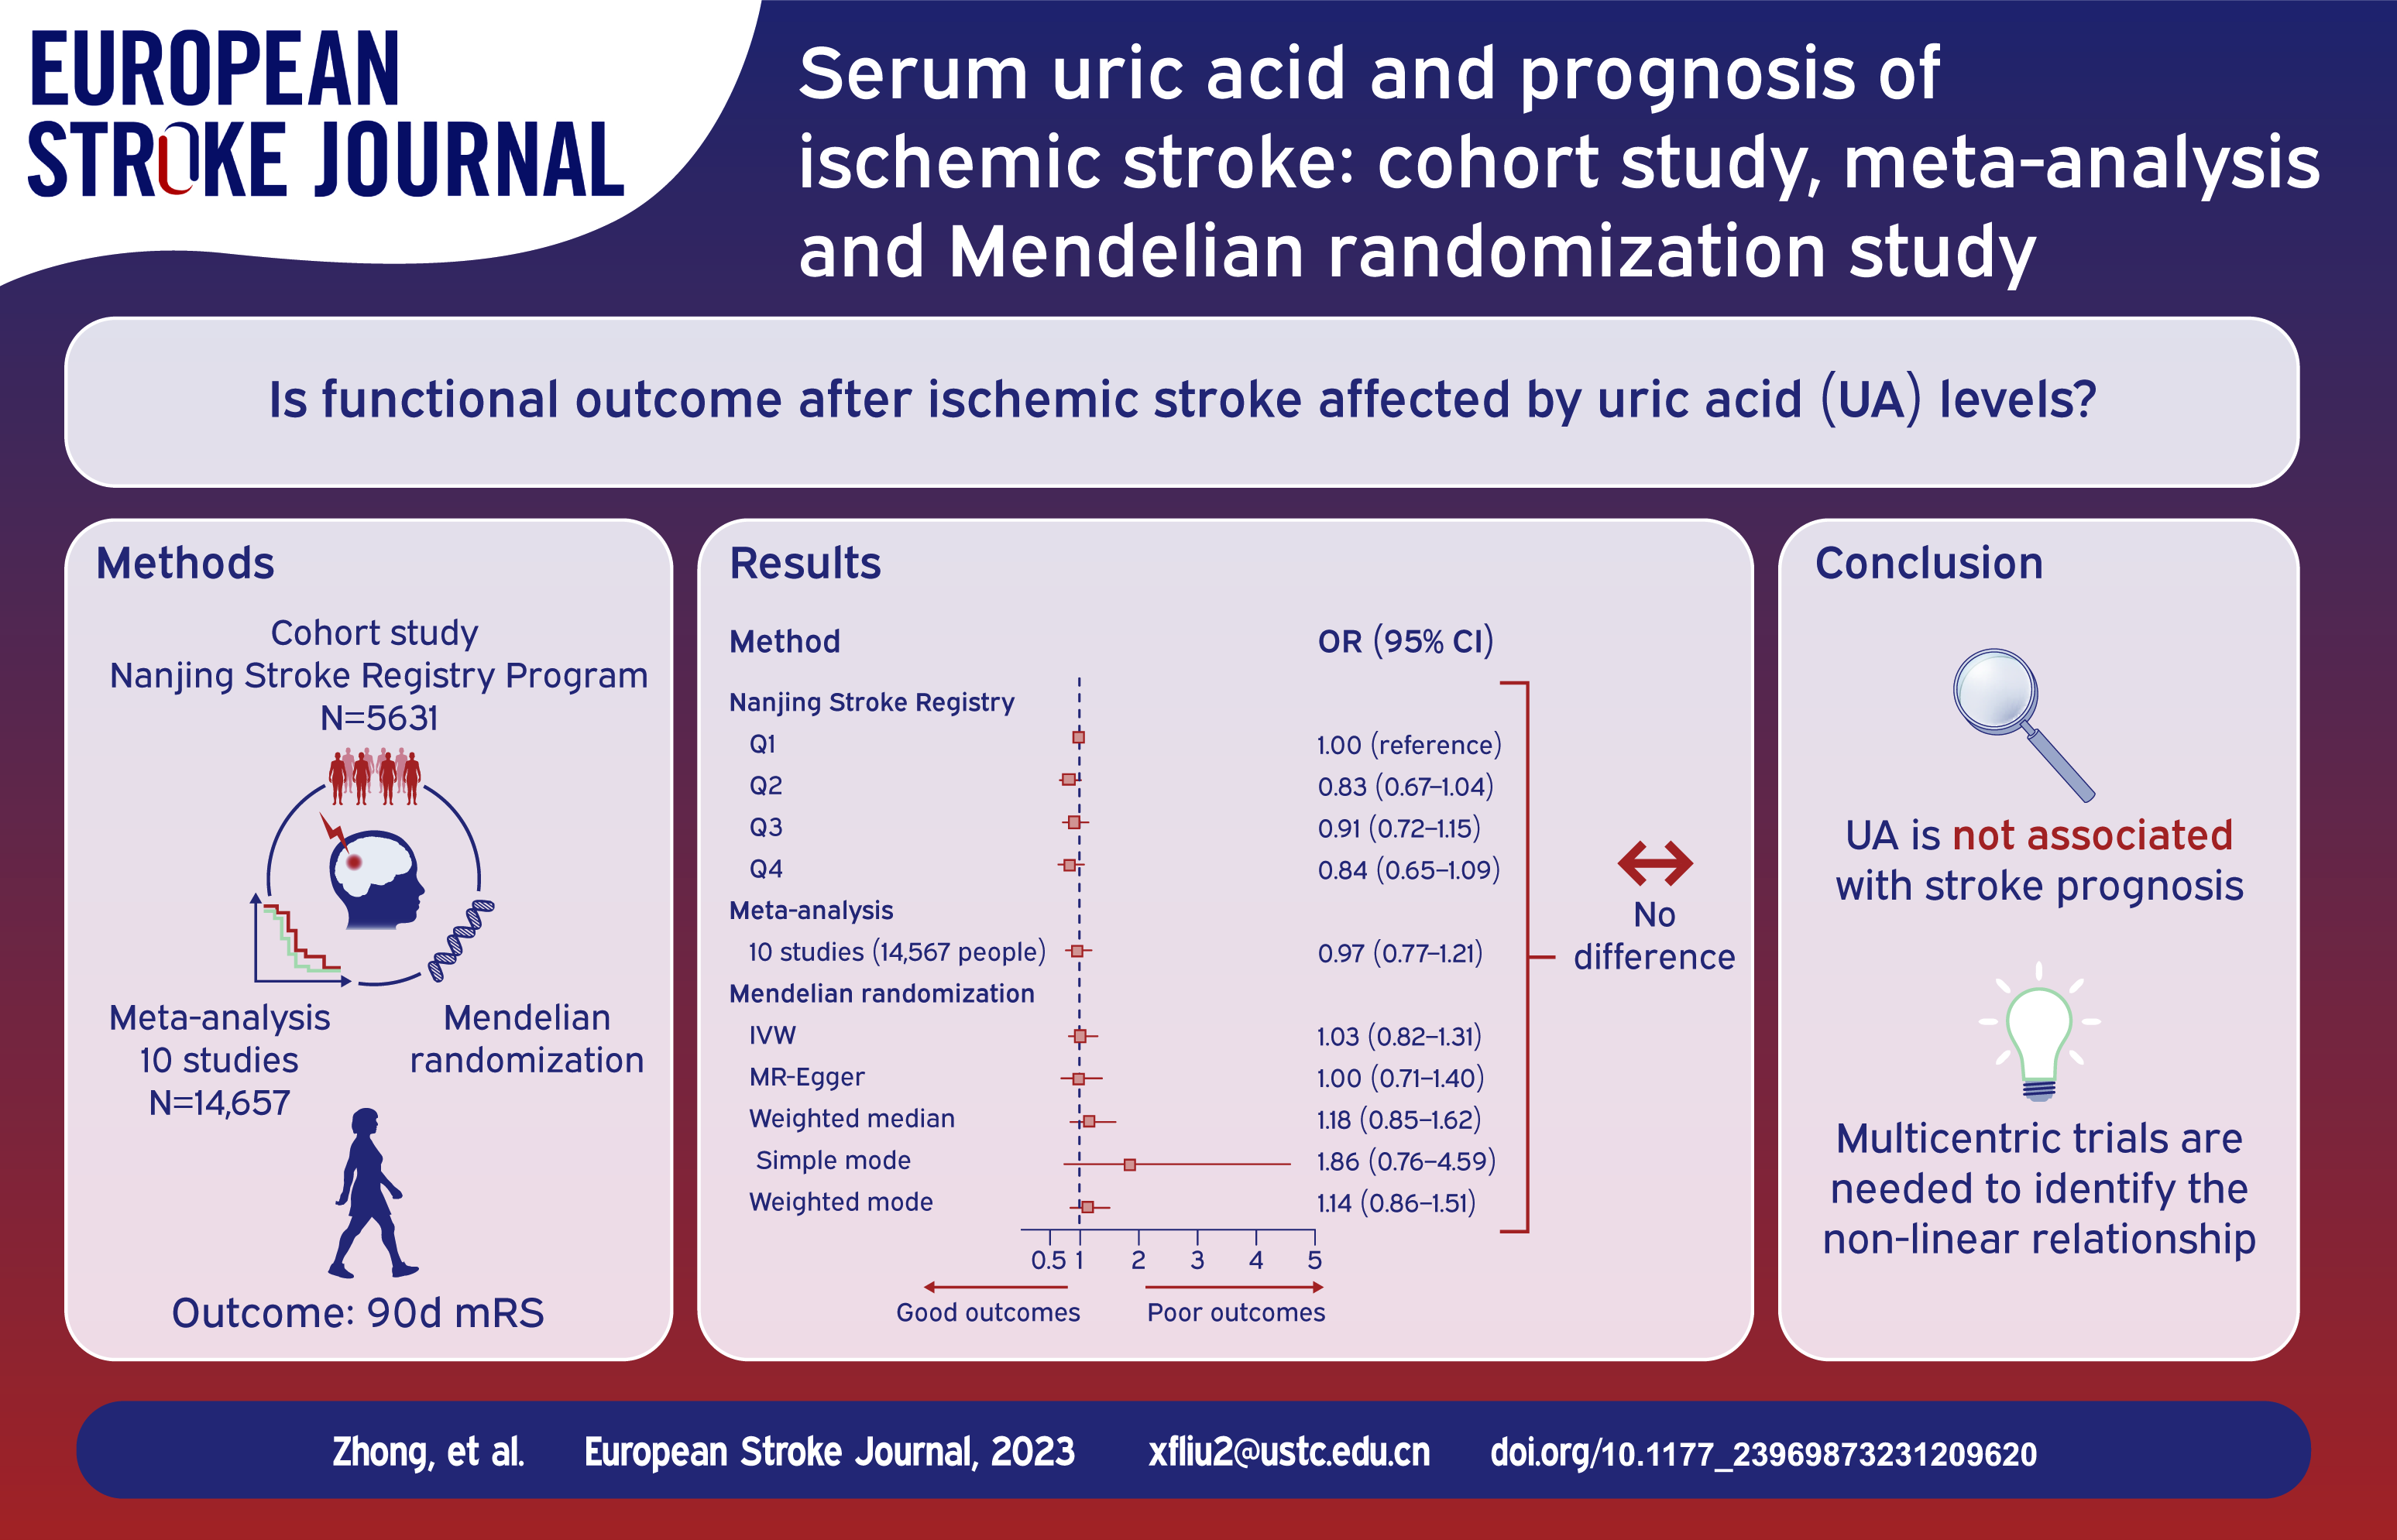
In the first stage, the cohort study included 5631 patients and found no significant association between UA levels and functional outcomes at 3 months after ischemic stroke. In the second stage, the meta-analysis, including 10 studies with 14,657 patients, also showed no significant association between UA levels and stroke prognosis. Finally, in the third stage, MR analysis using data from 6165 patients in the GISCOME study revealed no evidence of a causal relationship between genetically determined UA and stroke functional outcomes.
Discussion and conclusion:
Our comprehensive triangulation approach found no significant association between UA levels and functional outcomes at 3 months after ischemic stroke.
Introduction
Acute ischemic stroke carries significant morbidity, disability, and mortality rates, imposing a substantial burden on patients and society. Uric acid (UA) is the end product of purine metabolism. The role of uric acid (UA) in health and disease remains complex due to its dual nature as both a pro-oxidant and an antioxidant. UA can contribute to inflammatory responses, vascular endothelial cell damage, platelet aggregation, and oxidative stress. 1 However, it also has neuroprotective effects and preserves vascular endothelial cell function. 2 The relationship between UA and stroke prognosis remains inconclusive in observational studies, prompting further investigation.
Observational studies often face issues like residual confounding, over-adjustment of mediators, and reverse causality, making them less effective at establishing causality between exposure and outcome. While randomized controlled trials can overcome these limitations, they may have practical challenges. Mendelian randomization (MR) uses genetic variants as proxies for lifelong exposures, offering a way to minimize bias from confounding and reverse causation, making it a valuable alternative.
To explore the causal link between UA and stroke prognosis, we employed a triangulation approach that integrates various statistical methods and unbiased data sources. 3 Our study incorporated a robust prospective cohort, a meta-analysis of previous studies, and MR from a genetic perspective (Figure 1). This comprehensive strategy provides valuable insights into the causal association between UA and stroke prognosis.
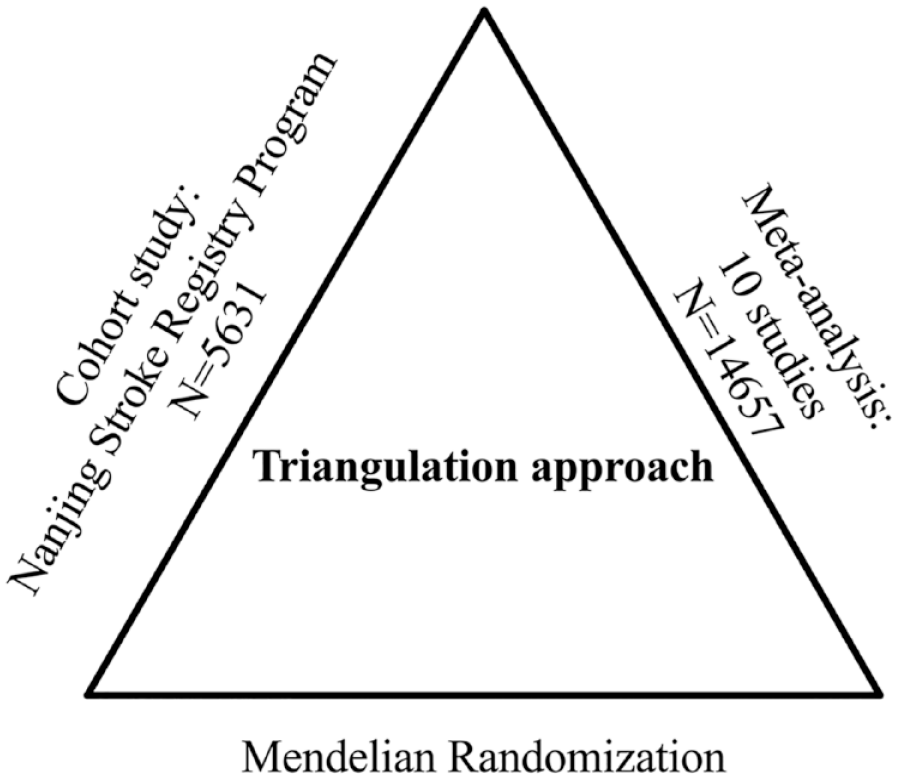
Study design of triangulation approach. A comprehensive three-stage study design was employed to investigate the relationship between uric acid (UA) and stroke prognosis. In the first stage, a large-scale hospital-based prospective registry was used to assess the association between UA and stroke prognosis. In the second stage, a meta-analysis was conducted to consolidate findings from previously published studies on UA and 90-day clinical outcomes, enhancing the overall understanding of the correlation. Finally, in the third stage, Mendelian randomization analysis was performed utilizing summary data from the CKDGen and the Genetics of Ischemic Stroke Functional Outcome Network (GISCOME) to assess whether genetically determined UA was causally linked to stroke functional outcomes.
Method
Cohort study
The participants included in this study were sourced from the Nanjing Stroke Registry Program (NSRP). (Details of NSRP described in Supplementary Notes) We recruited patients between Jan, 2012 and Dec, 2022 because these patients are more closely aligned with current treatment modalities. Laboratory data, including serum UA levels in blood samples collected within 24 h of hospital admission, using standard laboratory procedures with urate oxidase reagent on a Dax analyzer. The interassay coefficient of variation was <3%–5%. Patients meeting the following criteria were included in the study: (1) diagnosed with initial ischemic stroke within 2 weeks of experiencing symptoms, (2) aged 18 years or older. Patients lacking measurements of UA levels were excluded from the study. A total of 5631 patients met these criteria and were included in our analysis. We excluded 597 patients due to unavailable UA data. The baseline characteristics were comparable between patients with or without UA data (Supplemental Table S1). The primary outcome was a combination of death and major disability (modified Rankin Scale (mRS) 3–6). We defined mRS 2–6 as the secondary outcome. 4 Additionally, an ordered seven-level categorical score of the mRS was defined as another secondary outcome.
Meta-analysis
This meta-analysis adhered to the PRISMA guidelines and the study protocol was registered with PROSPERO (CRD42023405549). 5 A thorough literature search was conducted in Pubmed, Embase, and Cochrane Library databases until February, 2023, using the search terms “uric acid,” “stroke,” and “prognosis” (Details in Supplemental Table S2). To be included in our analysis, studies had to meet the following inclusion criteria: (1) a cohort design; (2) functional outcomes evaluated by mRS at 90 days; (3) measurement of UA levels within the first 24 h of hospital admission; (4) provided entirely odds ratios (ORs), or relative risks (RRs) and 95% confidence intervals (CIs); and (5) being human studies. We excluded reviews, abstracts, case reports, letters, and studies that did not provide sufficient data to calculate the estimates. Details of data extraction and quality evaluation were seen in Supplemental Notes.
The reanalysis was conducted in order to apply a dose-response methodology in place of the categorical analysis used previously.
Mendelian randomization
We identified genetic variants reliably associated with UA levels in the largest genome-wide association study meta-analysis of up to 457,690 individuals from 74 trans-ancestry studies where UKB was not used for discovery analysis of urate-associated variants (Supplemental Table S3). 6 Details of serum urate measurement for each of the cohorts have been described previously by the Chronic Kidney Disease Genetics Consortium (CKDGen). The effect of each allele on serum urate levels is presented in mg/dL and adjusted for age, sex, study centers, and genetic principal components. 6 To mitigate bias from population stratification, all effect estimates were derived from individuals of European ancestry (288,649 individuals). 7
We obtained summary-level data on the 3-month functional outcomes of ischemic stroke from the Genetics of Ischemic Stroke Functional Outcome Network (GISCOME) (Supplemental Table S3). 8 The GISCOME study comprised 6021 patients of European ancestry with ischemic stroke from 12 studies in Europe, the United States, and Australia. The functional outcome was evaluated using the mRS 3 months after the occurrence of ischemic stroke. A mRS 0–2 indicated good functional outcome (n = 3741), while mRS 3–6 represented poor functional outcome post-stroke (n = 2280). The results were adjusted for age, sex, ancestry and baseline NIHSS in the primary analysis. 8 Moreover, as a comparison, we utilized the summary GWAS without adjustment for baseline NIHSS was also performed. 8
We further obtained genetic association data for gout from the Global Urate Genetics Consortium (GUGC), 9 chronic kidney disease (CKD) from the CKDGen consortium, 10 body mass index (BMI) from The Genetic Investigation of Anthropometric Traits (GIANT) consortium, 11 coronary artery disease (CAD) from the Coronary Artery Disease Genome-wide Replication and Meta-analysis plus The Coronary Artery Disease Genetics (CARDIoGRAMplusC4D) consortium, 12 type 2 diabetes (T2D) from the Diabetes Genetics Replication And Meta-analysis (DIAGRAM) consortium, 13 and ischemic stroke from GIGASTROKE Consortium. 14 All studies in the GWAS had been approved by relevant ethical review committees. Participants had provided written informed consent. All data used in the present study were publicly available. We adhered to the STROBE Mendelian Randomization statement to ensure transparent and complete reporting of our study. To this end, we used the checklists to guide the reporting of our study design, methods, results, and conclusions. 15
Statistical analyses
Stage 1: Cohort study
Participants were divided into four groups based on quartiles of UA levels. Categorical data were presented as count and percentage, while skewed continuous data were presented as median and interquartile range (IQR), and normally distributed continuous data were summarized as mean ± standard deviation (SD). Statistical tests such as one-way analysis of variance, Kruskal-Wallis H test, and χ2 test were used for appropriate comparisons. Univariable and multivariable logistic regression analyses were performed to estimate the associations between serum UA and clinical outcomes. Multivariate ordinal logistic regression was used to assess the relationship between serum UA levels and the 90-day mRS shift. ORs with 95% CIs were calculated for the four quartiles of UA levels (Q1–Q4), with Q1 as the reference group. We also used continuous UA levels to do the same analysis. The detailed information of statistical analyses on cohort study is available in Supplemental Notes.
Stage 2: Meta-analysis
ORs and 95% CIs were utilized as effective indexes to evaluate the association between UA and stroke prognosis. All sex-stratified findings were treated as two separate reports. Heterogeneity was assessed using I2 and Cochran’s Q test. A fixed-effects model was used if p > 0.1 and I2 < 50%, otherwise a random-effects model was used. 16 Subgroup analyses were performed to investigate heterogeneity sources based on region (China and Europe). Stratified analyses were conducted to explore associations by age and different outcome definitions. Sensitivity analysis was performed using leave-one-out analysis to assess the impact of individual studies. Begg’s and Egger’s tests were conducted, and funnel plots were constructed to assess potential asymmetry. 17
Moreover, we would also like to draw attention to the dose-response relationship between UA levels and stroke outcomes (See in Supplemental Notes).
Stage 3: MR analysis
Single-nucleotide polymorphisms (SNPs) were harmonized by excluding those with discordant alleles and palindromic SNPs with ambiguous minor allele frequency. We used the random-effects inverse-variance weighted (IVW) method as the primary analysis to determine MR estimates of the effect of UA on stroke outcomes. Additionally, we performed several sensitivity analyses, including the MR-Egger, weighted-median (WM), simple mode and weighted mode methods, to examine the consistency of our results.18,19 We conducted a series of sensitivity analyses to evaluate the robustness of our findings, as described in detail in the Supplemental Notes.
An online tool named mRnd (https://shiny.cnsgenomics.com/mRnd/) was used for the power calculation of analyses. All statistical analyses were conducted using Stata version 17 for meta-analyses and R software version 4.2.2 for other statistical analyses. The significance level was set at a two-tailed p-value of <0.05.
Result
UA and stroke prognosis in NSRP
A total of 5631 patients were finally included in the analysis, of which 1628 (28.9%) were female. The mean age of the patients was 63 years. At 3-month follow-up, 1398 (24.8%) patients experienced primary outcomes (mRS 3–6). Patients were categorized into four groups (Q1–Q4) based on UA quartiles: Q1 (UA ⩽ 234 µmol/L), Q2 (234 µmol/L < UA ⩽ 297 µmol/L), Q3 (297 µmol/L < UA ⩽ 366 µmol/L), and Q4 (UA > 366 µmol/L). Supplemental Table S4 displays the differences in clinical characteristics among the four groups.
In the univariable model, a significant inverse association was observed between UA levels and primary and secondary outcomes, with a significant p-value for trend (P for trend <0.001; Table 1). However, after adjusting for potential confounders in the multivariable model, this association was attenuated and the p-value for trend became non-significant for primary (P for trend = 0.266) and secondary outcomes (mRS 2–6: P for trend = 0.782; ordinal mRS: P for trend = 0.200). For the primary outcome (mRS 3–6), the multivariable-adjusted ORs (95% CI) for Q2, Q3, and Q4 were 0.83 (0.67–1.04, p = 0.105), 0.91 (0.72–1.15, p = 0.424) and 0.84 (0.65–1.09, p = 0.198), respectively. For secondary outcomes, the adjusted ORs (95% CI) for mRS 2–6 in Q2, Q3, and Q4 were 0.91 (0.74–1.11, p = 0.337), 1.02 (0.83–1.25, p = 0.863) and 1.00 (0.79–1.25, p = 0.986), respectively. For the ordinal mRS, the adjusted ORs (95% CI) for Q2, Q3, and Q4 were 0.89 (0.77–1.02, p = 0.098), 0.96 (0.82–1.11, p = 0.542) and 0.86 (0.73–1.01, p = 0.072), respectively. Similar results are obtained when treating UA as a continuous variable (Table 1). In restricted cubic spline regression, adjusting for covariates, we did not detect a significant nonlinear relationship between UA and 90d mRS (mRS 3–6: P for nonlinear = 0.061, Supplemental Figure S1A; mRS 2–6: P for nonlinear = 0.416, Supplemental Figure S1B).
Odds ratios of clinical outcomes at 3 months after ischemic stroke according to UA status.
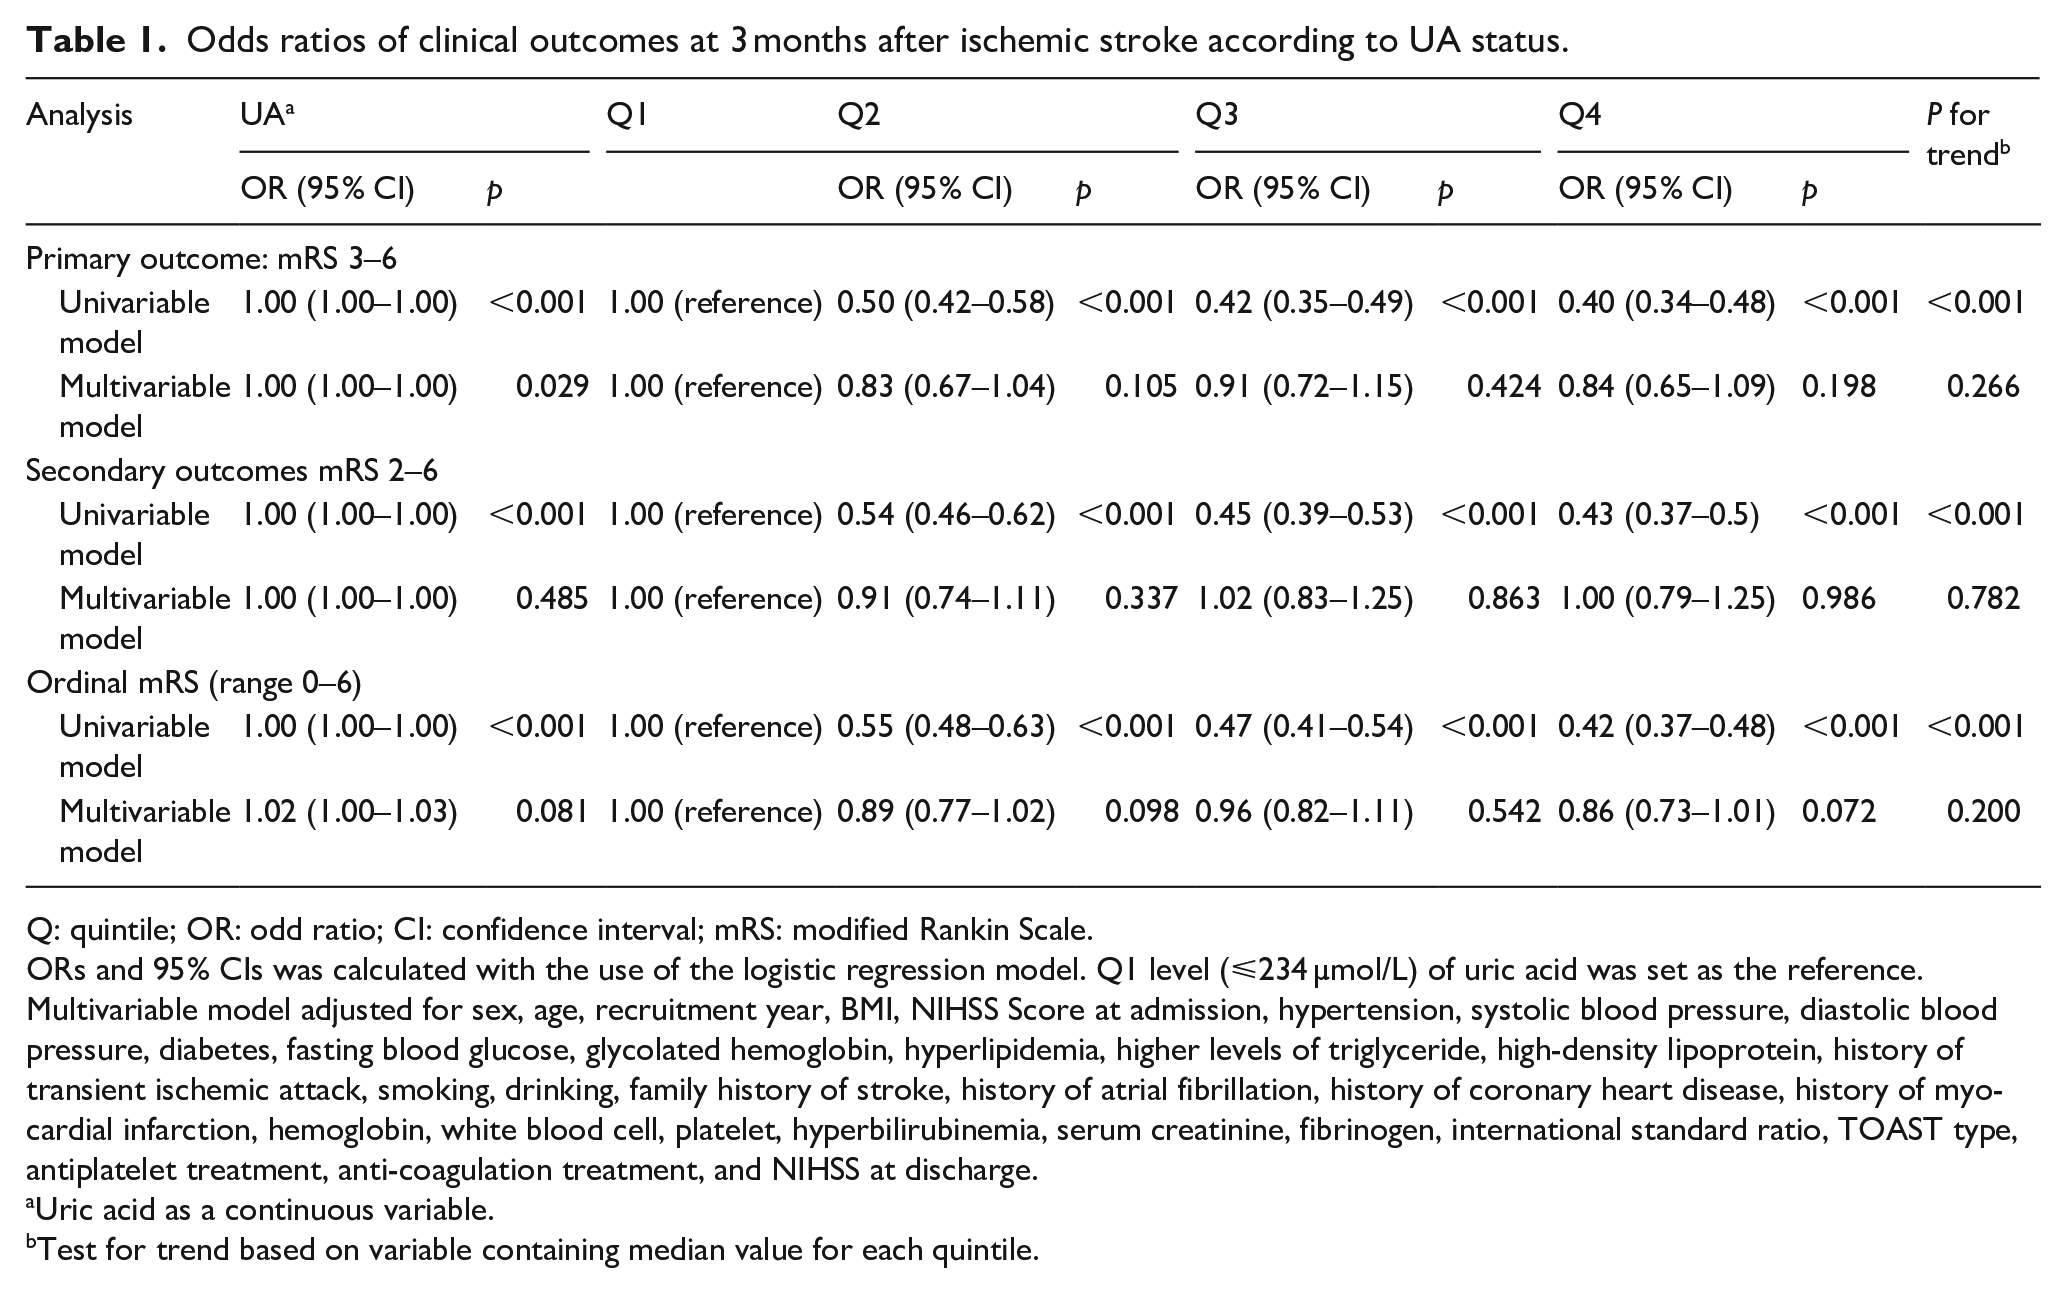
Q: quintile; OR: odd ratio; CI: confidence interval; mRS: modified Rankin Scale.
ORs and 95% CIs was calculated with the use of the logistic regression model. Q1 level (⩽234 µmol/L) of uric acid was set as the reference.
Multivariable model adjusted for sex, age, recruitment year, BMI, NIHSS Score at admission, hypertension, systolic blood pressure, diastolic blood pressure, diabetes, fasting blood glucose, glycolated hemoglobin, hyperlipidemia, higher levels of triglyceride, high-density lipoprotein, history of transient ischemic attack, smoking, drinking, family history of stroke, history of atrial fibrillation, history of coronary heart disease, history of myocardial infarction, hemoglobin, white blood cell, platelet, hyperbilirubinemia, serum creatinine, fibrinogen, international standard ratio, TOAST type, antiplatelet treatment, anti-coagulation treatment, and NIHSS at discharge.
Uric acid as a continuous variable.
Test for trend based on variable containing median value for each quintile.
In the subgroup analyses that were stratified by age (⩽60), sex, BMI (⩽24), NIHSS score at admission (⩽4), history of hypertension, history of diabetes, smoking, and drinking. The results revealed no significant interaction between UA quartiles and most of the prespecified factors on the primary outcome, with Pinteraction values ranging from 0.198 to 0.894 (Supplemental Table S5). However, a significant interaction was observed for the NIHSS score at admission (Pinteraction = 0.007). In general, the ORs and p-values were non-significant across subgroups stratified by age, sex, BMI, history of hypertension, and history of diabetes. Notably, in the Q4 group, the OR was significantly lower for patients with a history of smoking (OR: 0.59, 95% CI: 0.38–0.91; p = 0.018) and those with a history of drinking (OR: 0.55, 95% CI: 0.30–0.99; p = 0.046) compared to the reference group.
Sensitivity analyses matching poor outcomes and good outcomes by their propensity score showed similar results for UA in adjusted analyses (ORs (95% CI) for Q2, Q3, and Q4 were 0.83 (0.67–1.10, p = 0.205), 0.92 (0.70–1.22, p = 0.572), and 0.82 (0.61–1.20, p = 0.174)). The baseline characteristics after performing PSM can be seen in Supplemental Table S6.
Meta-analysis
Initially, 256 relevant articles were retrieved from the literature database, 12 potential records were collected from other’s reviews. After a thorough evaluation, 10 studies that met the inclusion criteria were included in the final analysis.20–28 The flow chart outlining the meta-analysis process is depicted in Supplemental Figure S2. These studies were conducted in four countries, namely Africa, Britain, China, and Holland, described in detail in Supplemental Table S7. The 10 cohort studies covered 14,657 patients with ischemic stroke, with the majority being older than 60 years. The quality of the studies was assessed using the Newcastle-Ottawa Scale (NOS), with only one study scoring below 6, while the remaining studies scored higher than 7, indicating high quality and low risk of bias.
The I2 statistic test indicated significant statistical heterogeneity among the studies (I2 = 54.3%, p = 0.020), requiring us to use a random-effects model for meta-analysis. Our analysis found no significant association between UA levels and 3 months prognosis (OR: 0.97, 95% CI: 0.77–1.21; p = 0.695) (Figure 2). Therefore, to further explore the sources of heterogeneity, we performed stratified analyses in pre-defined subgroups. Stratified analyses by geographic location resulted in a decrease in I2, suggesting that region may be the source of heterogeneity (Supplemental Figure S3). However, we did not find the sources of heterogeneity from age and different outcomes definitions (Supplemental Figures S4 and S5).
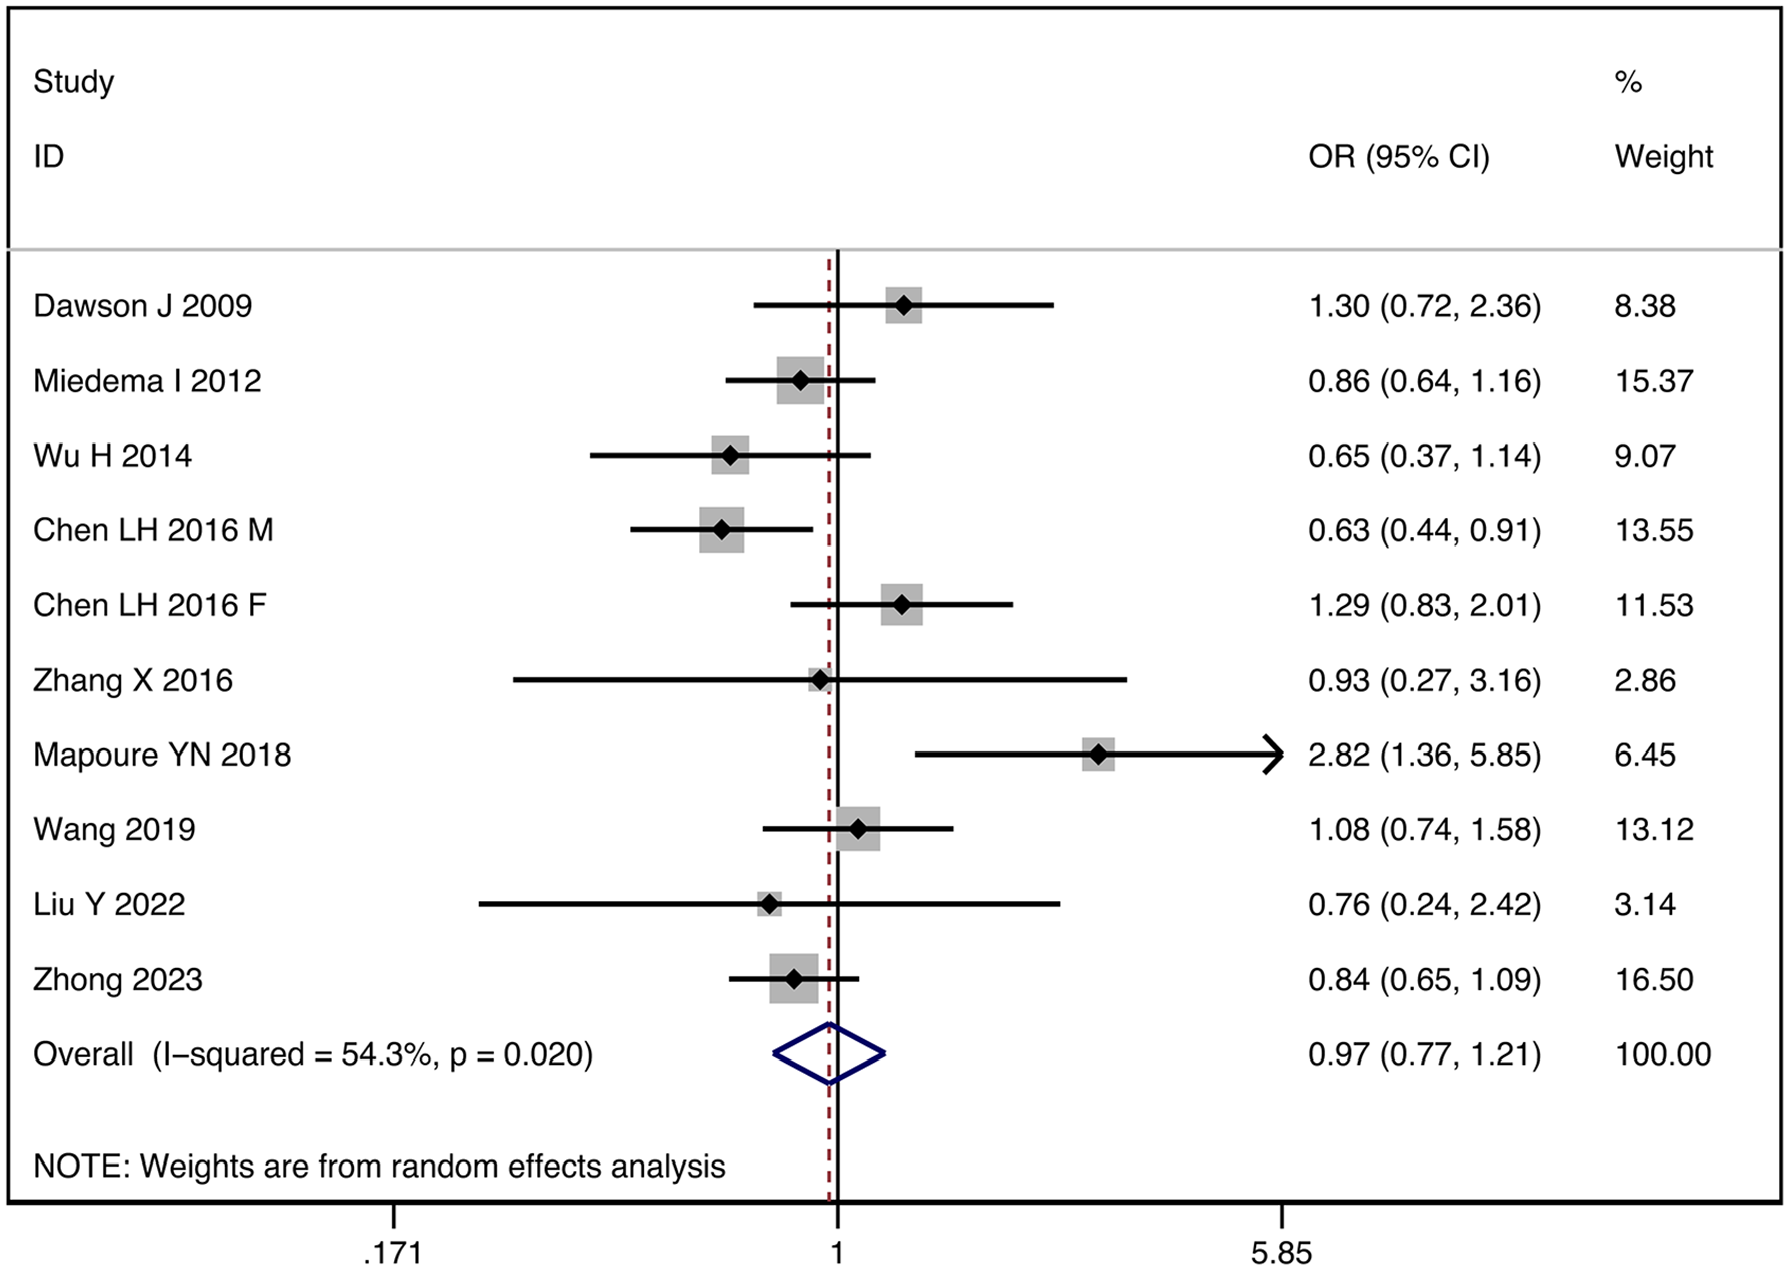
Forest plot of the relationship between elevated serum uric acid levels and the functional outcomes of stroke.
A sensitivity analysis using the leave-one-out method showed that our meta-analysis results were robust (Supplemental Figure S6). Funnel plots, Begg’s test (p = 0.210) and Egger’s test (p = 0.324) showed no evidence of publication bias (Supplemental Figure S7).
Five studies were included in the dose-response analysis of UA levels and prognosis of ischemic stroke, including 9863 participants with 2466 cases of poor outcomes. Using a restricted cubic splines model, we did not observe a nonlinear dose-response association between UA levels and stroke outcomes (Wald test: Pnonlinearity = 0.883). Moreover, a linear dose-response association has also not been found (Plinearity = 0.221, Supplemental Figure S8).
Mendelian randomization analysis
A total of 96 SNPs as IVs (instrumental variables) for the level of UA, which explained 3.6% in the phenotypical variance, and had a minimum F-statistic of 29.86 (Supplemental Table S8). 29 A positive control study demonstrated significant associations between gout exposure (OR 3.71, 95% CI 2.96-4.65; P<0.001), confirming the effectiveness of the chosen genetic instruments, as shown in Figure S9. After harmonizing, 93 SNPs were used (Supplemental Table S9). The study found no evidence of causal relationship between genetically determined UA and stroke prognosis using the IVW method (OR: 1.03, 95% CI: 0.82–1.31; p = 0.741) (Figure 3 and Supplemental Figures S10 and S11). Additional sensitivity analyses using the more conservative WM approach (OR: 1.18, 95% CI: 0.85–1.62; p = 0.946), MR Egger method (OR: 1.00, 95% CI: 0.71–1.40; p = 0.862), simple mode method (OR: 1.86, 95% CI: 0.76–4.59; p = 0.796) and weighted mode method (OR: 1.14, 95% CI: 0.86–1.51; p = 0.844) given the same results (Supplemental Table S10). Cochrane’s Q test showed no heterogeneity (Q = 115.08, p = 0.052). Moreover, no horizontal pleiotropy was observed in MR-Egger intercept tests (p = 0.785) and MR-PRESSO global tests (p = 0.057) (Supplemental Table S10). No outliers were identified by MR Radial method (Supplemental Figure S12). Leave-one-out analyses and Funnel plots suggesting that the estimates were unbiased (Supplemental Figures S13 and S14). The statistical power for the association in the MR study was limited, we had 60% statistical power to detect the ORs of 1.03 for associations of serum UA level with stroke prognosis, due to the small sample size of GISCOME. Moreover, the associations remained stable after multivariable MR analysis with adjustments for CKD, BMI, CAD, and T2D (Figure 4).
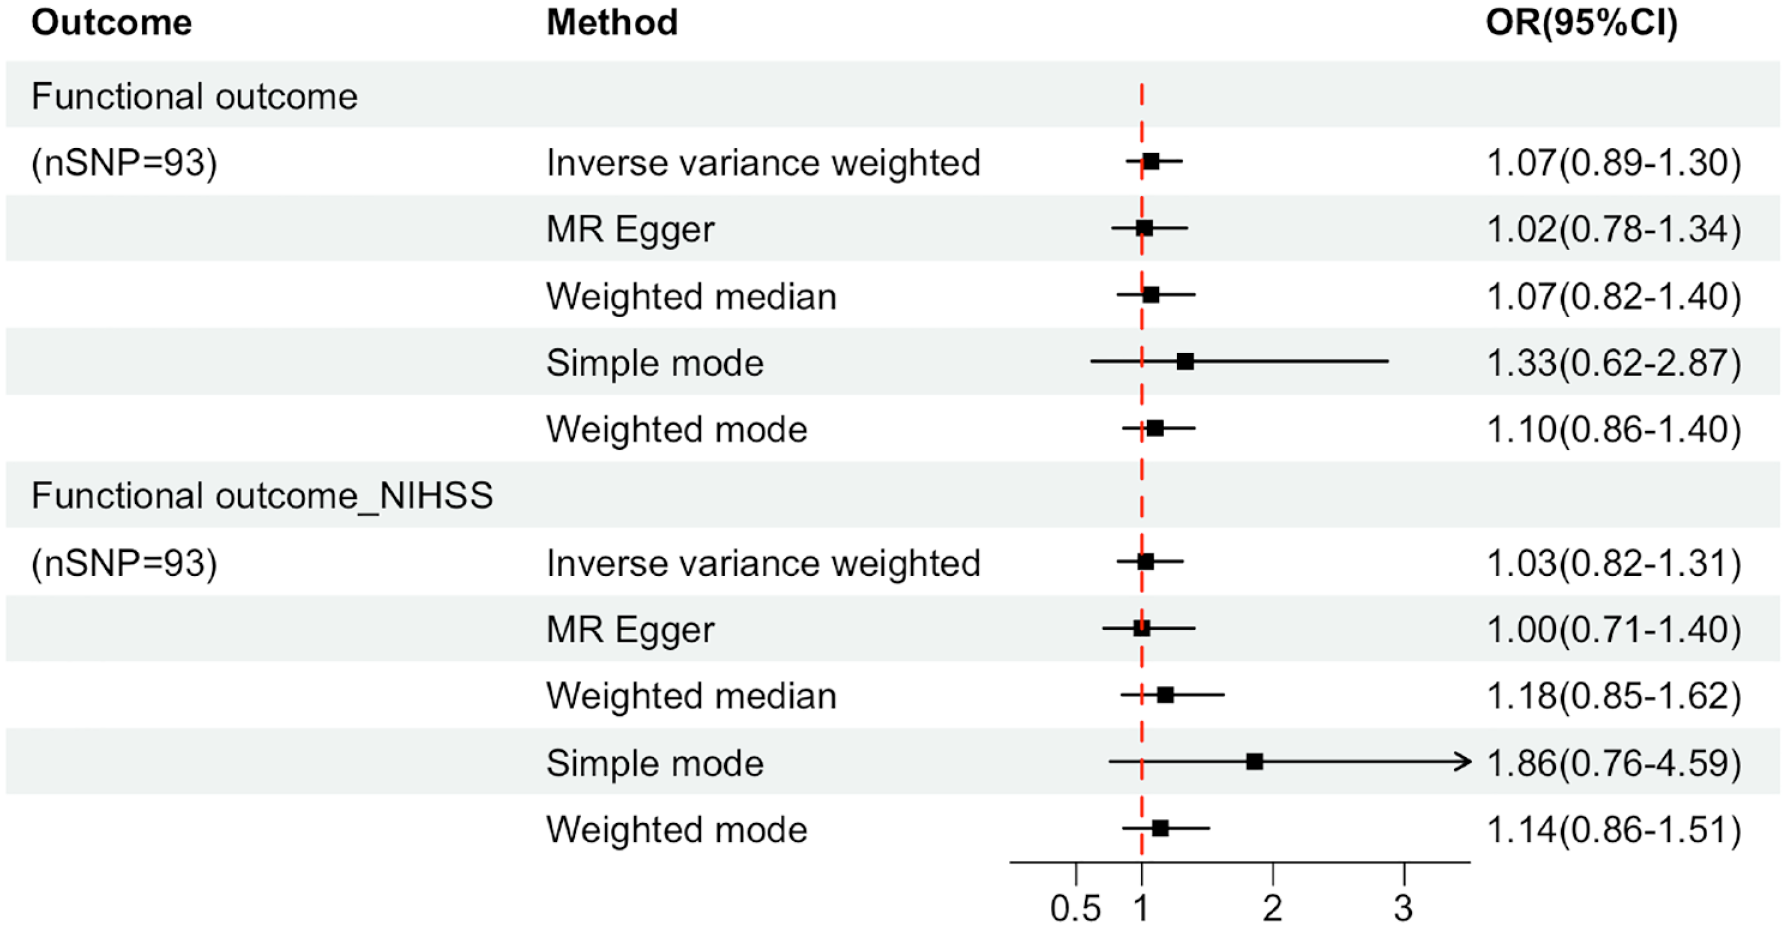
Forest plots for the associations of genetically predicted serum uric acid level with the composite outcome of death or major disability at 3 months after ischemic stroke. Effect estimates were derived from the main analysis (inverse-variance weighted method) and a series of sensitivity analyses (the MR-Egger regression method, the weighted median method, simple mode, the maximum likelihood method). OR: odd ratio; CI: confidence interval; Functional outcome_NIHSS: the functional outcome of ischemic stroke after adjusting baseline NIHSS.
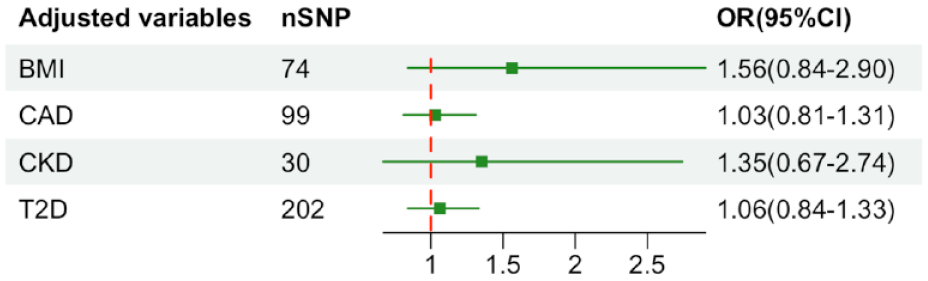
Results of multivariable Mendelian randomization analysis with adjustment for CKD, BMI, CAD, and T2D. OR: odd ratio; CI: confidence interval; CKD: chronic kidney disease; BMI: body mass index; CAD: coronary artery disease; T2D: type 2 diabetes.
In the reverse MR analysis, which evaluated the causal effects of functional outcome of ischemic stroke on serum UA levels, six SNPs were used, with F statistics for functional outcome of ischemic stroke exceeding 20 (Supplemental Table S11). The MR analysis provided limited evidence of an association between functional outcome of ischemic stroke and serum UA levels (Supplemental Figure S15). However, MR Radial found two outliers. After removing them, the null associations were stable (Beta: −0.012, 95% CI: −0.027 to 0.004; p = 0.143) (Supplemental Table S12). In the MR study on uric acid and ischemic stroke, the IVW method suggested a protective effect (OR: 0.94, 95% CI: 0.89–0.99). But four other methods were non-significant. Significant pleiotropy and heterogeneity were observed (Supplemental Table S13), raising concerns about the reliability of the IVW-based conclusion.
Discussion
In our three-stage study on UA levels and clinical outcomes in ischemic stroke patients, we did not find a significant link between UA levels and outcomes 3 months post-stroke. What’s particularly striking is that this lack of association was consistent with the results of two substantial clinical trials. One of these trials involved 411 stroke patients who received UA and thrombolytic therapy, showing no improved prognosis after 90 days, mirroring our own results. 30 Another substantial trial, the Allopurinol versus usual care in UK patients with ischemic heart disease (ALL-HEART) study, involving ischemic heart disease patients over 60 without gout history, also found no significant differences in key outcomes. 31 Taken together, these trials essentially underscore and validate our research findings by highlighting that the addition of uric acid did not lead to improved clinical outcomes. These results provide further support for the absence of a causal relationship between uric acid and ischemic stroke, shedding light on why these clinical trials of uric acid supplementation have ultimately fallen short in demonstrating any significant benefit.
Prior studies on serum uric acid levels and post-acute ischemic stroke neurological outcomes yield conflicting results,20–28 likely due to multiple factors: differences in sample sizes, outcome assessment methods, potential confounders, and study population characteristics, including geography, ethnicity, gender, age, socio-economic factors, and research methodologies. In our meta-analysis, we identified ethnic heterogeneity as a significant contributor. Diverse racial and ethnic groups often possess distinct genetic backgrounds impacting uric acid metabolism and stroke response. Genetic variations in urate transporters and enzymes like xanthine oxidase may lead to uric acid level disparities among racial groups, influencing stroke risk and recovery. Dietary habits and environmental exposures also vary among populations, affecting uric acid levels. Cultural dietary preferences can result in differing purine intake by racial groups. Additionally, racial disparities in healthcare access can significantly influence stroke recovery prospects.
Serum UA has both pro-oxidant and antioxidant roles, contributing to neurotoxicity and neuroprotection, respectively. 1 UA leads to neurotoxicity through several mechanisms. Firstly, it can promote the proliferation of vascular endothelial cells, leading to vascular endothelial dysfunction and increasing the expression of pro-inflammatory mediators in vascular smooth muscle cells. 1 Additionally, it accelerates lipid peroxidation reactions, promoting LDL oxidation and inhibiting nitric oxide (NO) synthesis, which can contribute to vascular endothelial dysfunction. 32 UA can also increase platelet-derived growth factor production, leading to platelet adhesion and coagulation cascade activation, ultimately resulting in thrombosis and arterial occlusion. 33 Moreover, high UA levels can increase inflammatory factors throughout the body and induce a systemic inflammatory response via the NF-κB pathway.34,35 Furthermore, UA production is accompanied by the production of reactive oxygen species, which can induce oxidative stress and cause endothelial cell apoptosis. 1 Finally, UA can activate the renin-angiotensin-aldosterone system, leading to increased renin activity, increased angiotensin II production, water and sodium retention, elevated vascular resistance, and ischemic events. 36
On the other hand, UA exhibits antioxidant properties and neuroprotective effects. UA is an endogenous antioxidant. 37 Its potent antioxidant effects safeguard neurons from damage caused by oxidative stress and reduce ischemic damage by inhibiting lipid peroxidation. Moreover, it also protects the function of vascular endothelial cells by preventing the degradation of extracellular superoxide dismutase (SOD3), an enzyme critical for maintaining endothelial and vascular function. 2
Our current study has several strengths. Firstly, to address a causal question, we utilized a triangulation approach, which involved integrating findings from various methods that possess distinct and unrelated sources of potential bias. 3 Secondly, we have done various sensitivity analyses for each stage to prove that the conclusions are reliable.
Our study has several limitations. In the cohort study, first, despite sufficient sample size, the data we collected was from a single-center hospital-based registry, introducing potential selection bias. Second, UA levels were measured only once without continuous observation, limiting the assessment of changes over time. Third, the short-term follow-up period of 90 days restricted the evaluation of long-term outcomes. Fourth, our cohort in which only 28.9% of the participants are women. This gender imbalance may potentially confound the results, as there could be sex-dependent effects of uric acid on ischemic stroke. In Meta-analysis, the significant heterogeneity may be attributed to regional and gender differences. In addition, the variation in the timing of uric acid measurement across the included studies could introduce potential bias. However, it’s worth noting that we were able to categorize all measurements as being within 24 h of admission. In MR analysis, first, the predominantly European ancestry of the genetic analyses may limit generalizability to other populations, highlighting the need for studies in non-European populations. Moreover, the smaller sample size of the GISCOME dataset compared to MEGASTROKE warrants further large studies for confirmation. 38 Third, Collider bias may have influenced our findings due to the association between genetic predisposition to UA and susceptibility to ischemic stroke. The unclear causal relationship between UA and ischemic stroke suggests that this bias is small. Lastly, the lack of individual data prevented the inclusion of a nonlinear Mendelian randomization study.
Conclusion
Our study did not find a significant association between admission UA levels and unfavorable outcomes in ischemic stroke patients.
Supplemental Material
sj-pdf-1-eso-10.1177_23969873231209620 – Supplemental material for Serum uric acid and prognosis of ischemic stroke: Cohort study, meta-analysis and Mendelian randomization study
Supplemental material, sj-pdf-1-eso-10.1177_23969873231209620 for Serum uric acid and prognosis of ischemic stroke: Cohort study, meta-analysis and Mendelian randomization study by Jinghui Zhong, Huan Cai, Zhizhong Zhang, Jinjing Wang, Lulu Xiao, Pan Zhang, Yingjie Xu, Wenqing Tu, Wusheng Zhu, Xinfeng Liu and Wen Sun in European Stroke Journal
Footnotes
Acknowledgements
We extend our gratitude to the study participants, their families, and the dedicated clinical staff at the participating hospitals for their invaluable support and significant contributions to this project. We acknowledge the contributors of the data used in this work: the Chronic Kidney Disease Genetics Consortium, the Genetics of Ischemic Stroke Functional Outcome Network, The Genetic Investigation of Anthropometric Traits Consortium, the Coronary Artery Disease Genome-wide Replication and Meta-analysis plus The Coronary Artery Disease Genetics consortium, the Diabetes Genetics Replication And Meta-analysis consortium, the Global Urate Genetics Consortium and GIGASTROKE Consortium.
Declaration of conflicting interests
The author(s) declared no potential conflicts of interest with respect to the research, authorship, and/or publication of this article.
Funding
The author(s) disclosed receipt of the following financial support for the research, authorship, and/or publication of this article: This work was supported by Program for Innovative Research Team of The First Affiliated Hospital of USTC (Grant No. CXGGO3 [to Xinfeng Liu]), National Natural Science Foundation of China (Grant No. U20A20357 [to Xinfeng Liu]), and Natural Science Foundation of Anhui Province (Grant No. 2108085MH271 [to Wen Sun]).
Ethics approval and Informed consent
Investigation on the NSRP was approved by the Ethics Review Board of Jinling Hospital (approval number 2010NLY-018).
Guarantor
Dr Xinfeng Liu and Wen Sun, take full responsibility for the integrity of the data presented in this manuscript.
Contributorship
The study was conceived and designed by JZ, HC, WS, and XL. JZ, HC, WS, and XL coordinated the study. JZ, HC, JW, ZZ, LX, PZ, YX, WT, WZ, WS, and XL contributed to data collection. JZ and HC performed the statistical analysis and prepared the first draft of the manuscript. WS and XL revised the paper and helped to write the final draft of the manuscript. WS and XL are guarantors.
Supplemental material
Supplemental material for this article is available online.
References
Supplementary Material
Please find the following supplemental material available below.
For Open Access articles published under a Creative Commons License, all supplemental material carries the same license as the article it is associated with.
For non-Open Access articles published, all supplemental material carries a non-exclusive license, and permission requests for re-use of supplemental material or any part of supplemental material shall be sent directly to the copyright owner as specified in the copyright notice associated with the article.