
Abstract
Introduction:
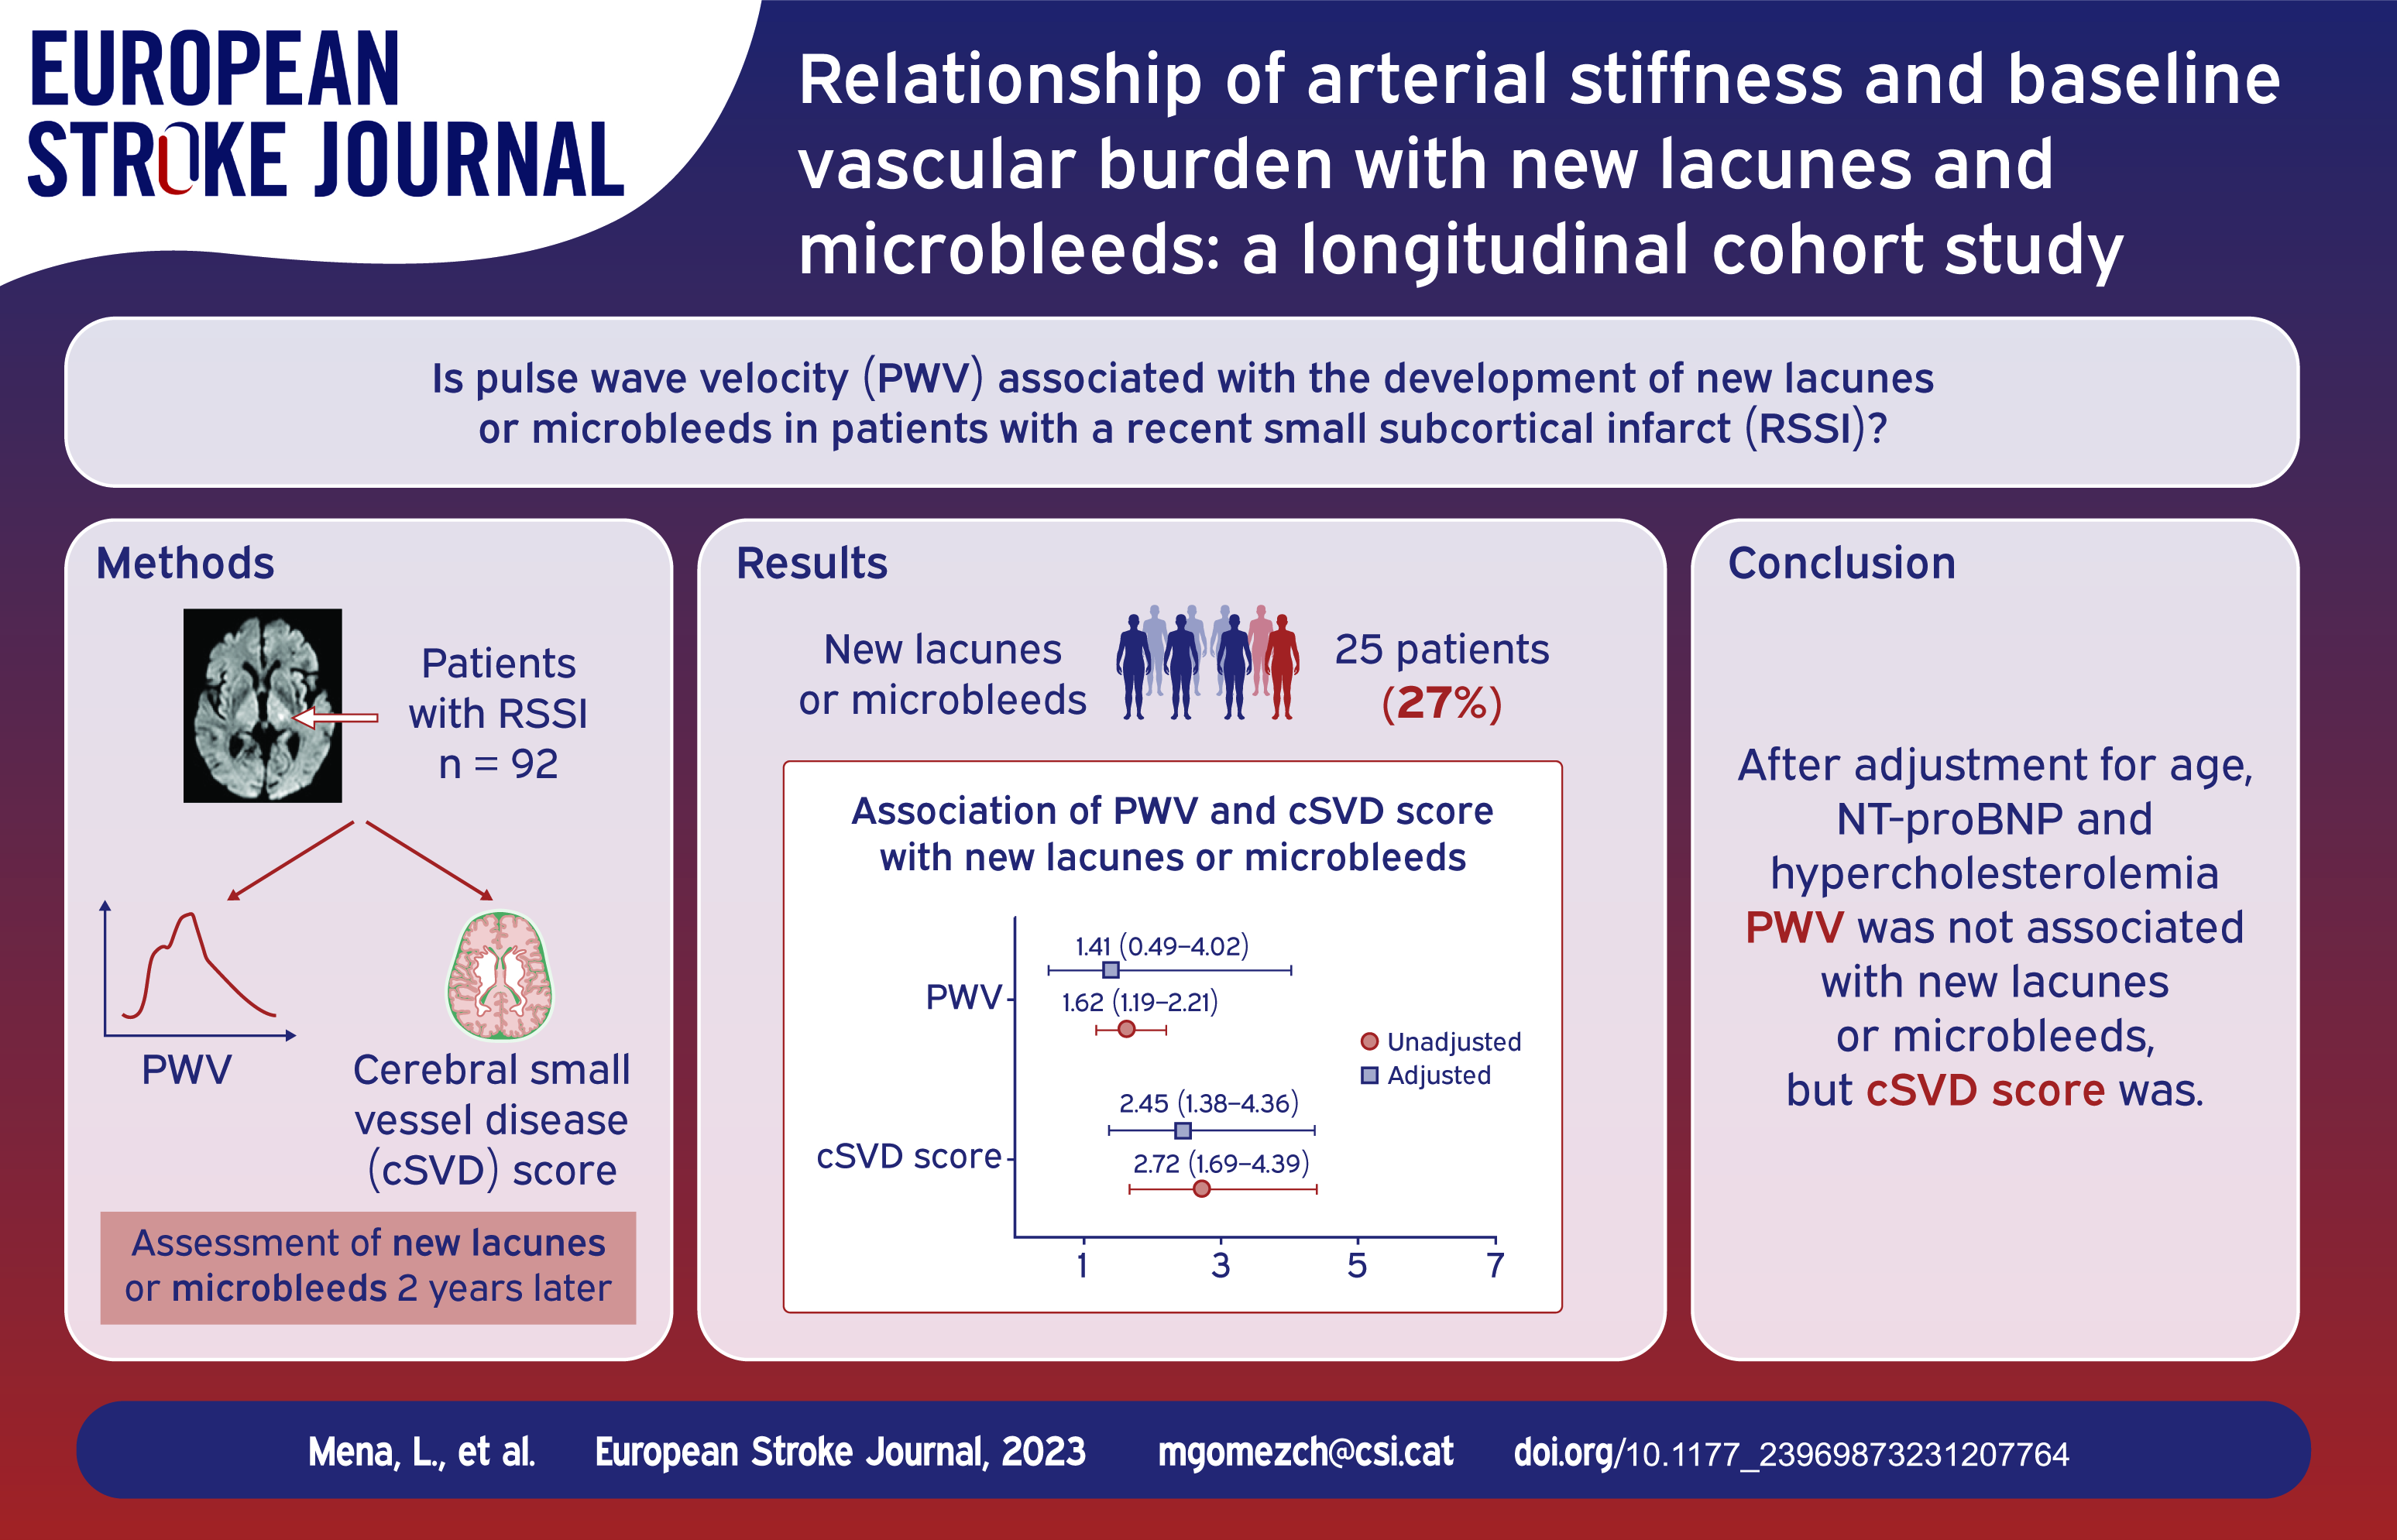
Arterial stiffness may have a significant impact on the development of cerebral small vessel disease (cSVD).
Patients and methods:
We obtained pulse wave velocity (24-h PWV) by means of ambulatory blood pressure monitoring (ABPM) in patients with a recent small subcortical infarct (RSSI). Patients with known cardiac or arterial embolic sources were excluded. Lacunes, microbleeds, white matter hyperintensities and enlarged perivascular spaces at baseline were assessed in a brain MRI and included in a cSVD score. A follow-up MRI was obtained 2 years later and assessed for the appearance of new lacunes or microbleeds. We constructed both unadjusted and adjusted models, and subsequently selected the optimal models based on the area under the curve (AUC) of the predicted probabilities.
Results:
Ninety-two patients (mean age 67.04 years, 69.6% men) were evaluated and 25 had new lacunes or microbleeds during follow-up. There was a strong correlation between 24-h PWV and age (r = 0.942, p < 0.001). cSVD was associated with new lacunes or microbleeds when adjusted by age, 24-h PWV, NT-proBNP and hypercholesterolemia (OR 2.453, CI95% 1.381–4.358). The models exhibiting the highest discrimination, as indicated by their area under the curve (AUC) values, were as follows: 1 (AUC 0.854) – Age, cSVD score, 24-h PWV, Hypercholesterolemia; 2 (AUC 0.852) – cSVD score, 24-h PWV, Hypercholesterolemia; and 3 (AUC 0.843) – Age, cSVD score, Hypercholesterolemia.
Conclusions:
cSVD score is a stronger predictor for cSVD progression than age or hemodynamic parameters in patients with a RSSI.
Introduction
Cerebral small vessel disease (cSVD) refers to any pathologic process that damages end arteries, arterioles, venules and brain capillaries and it is the underlying cause of many lacunar infarcts and brain hemorrhages. Lacunes, microbleeds, white matter hyperintensities (WMH), enlarged perivascular spaces (EPVS), and recent small subcortical infarcts (RSSI) are well-defined neuroimaging features of cSVD 1 and they can be included in a single score to reflect total cSVD burden. 2 This score has been associated with cognitive decline, higher risk of recurrent stroke, and worse functional and cognitive outcomes after stroke.3,4
Growing evidence suggests an association between arterial stiffness and cSVD neuroimaging markers.5–7 Arterial stiffness is associated with increased age and high blood pressure (BP), and it is thought to increase the transmission of pulse pressure into the microcirculation. Therefore, from a theoretical point of view, it might be a driving factor in the development of cerebral small vessel disease (cSVD). 8 Pulse wave velocity (PWV) is considered the reference parameter for the evaluation of arterial stiffness but other parameters such as central BP and the augmentation index (AIx) have also been used. 9 However, longitudinal data regarding the association between arterial stiffness and the evolution of cSVD neuroimaging markers are scarce. 10 The aim of our study was to evaluate whether different arterial stiffness-related hemodynamical parameters were associated with cSVD progression, particularly with the development of new lacunes or microbleeds.
Material and methods
From November 2017 to July 2019, we screened all the patients with a suspected diagnosis of ischemic stroke and a clinical lacunar syndrome admitted to Moisès Broggi Hospital, a primary stroke center serving a population of 400,000 inhabitants in Sant Joan Despí, Catalonia (Spain). We selected those patients with a diagnosis of RSSI according to STRIVE criteria. 1 We excluded patients with known cardiac sources of embolism, arterial stenosis equal or superior to 50% in the stroke territory or uncommon stroke etiologies (i.e. arterial dissection, genetic disorders, vasculitis, known coagulation or hematological disorders, cancer or infections). Other exclusion criteria were the following: (1) Premorbid disability defined as a modified Rankin scale (mRS) >3; (2) Heart failure 2–4 according to the NYHA; (3) End-stage renal failure defined as GFR < 30 mL/min/1.73m2 or patients in dialysis; (4) Active infection or known inflammatory disease; (5) Life expectancy inferior to 1 year; (6) Dementia; (7) Any contraindication to undergo a brain MRI. Patients were followed for 2 years. Clinical and demographical data collection, clinical BP measurement, 24 h-ambulatory BP monitoring (ABPM), urinary albumin excretion, NT-proBNP levels, echocardiography and brain MRI were carried out at baseline. Antihypertensive drugs were recorded at hospital discharge. Follow-up visits were scheduled at 3 months, 1 year, and 2 years after enrollment to assess BP control and make necessary adjustments to antihypertensive treatment. During follow-up we registered the occurrence of recurrent clinical stroke, ischemic heart disease, atrial fibrillation and death.
The study was approved by Bellvitge University Hospital clinical research ethics committee with protocol number PR134/17(CSI 17/25). Patient were included in the study after signing informed consent. Our study is reported in accordance with the Strengthening the Reporting of Observational Studies in Epidemiology (STROBE) guidelines.
Blood pressure evaluation
We registered BP values at admission to hospital and at day 7 after stroke or before discharge (clinical BP). BP was measured after 5 min of rest in a sitting position using a validated semiautomatic device (OMRON Digital Automatic Blood Pressure Monitor. Model HEM-907XL, Kyoto, Japan). We average three measurements of BP spaced by 1 min to determine the final clinical BP values. The decision regarding antihypertensive treatment at discharge was made by two BP specialists (PA and PC), who followed the guidelines outlined in the ESC/ESH Guidelines for the management of arterial hypertension. 11
We conducted ABPM during a typical day of activity after hospital discharge, between 7 and 30 days after the stroke. Ambulatory BP was obtained following the recommendations of the European Society of Hypertension practice guidelines for ambulatory blood pressure monitoring.12,13 The planned frequency measurement was every 20 min during the daytime and every 30 min during the night-time. PWV, AIx and 24 h brachial and central BP were measured by means of a Mobil-O-Graph PWV (IEM, Stolberg, Germany) device. AIx was normalized for heart rate of 75 bpm (AIx75). The methodology for PWV estimation has been previously reported and validated against invasive methods. 14 Central BP was determined from brachial waveforms and calculated at each BP measurement. The method of calibration used systolic/diastolic BP (SBP/DBP), which provides values of aortic SBP usually lower than brachial SBP. All subjects included had recordings of good technical quality (at least 80% of valid readings).
Cardiac echography
According to guidelines, an experienced cardiologist (PB) performed in all participants a 2-Dimensional, M-mode, Doppler and tissue Doppler echocardiography.15,16 We registered measures of ejection fraction, left ventricular mass indexed to body surface, left ventricle diameter, interventricular septum thickness, left ventricle posterior wall thickness, left atrium diameter, left atrium volume indexed to body surface, E-wave velocity, A-wave velocity, E/A ratio, septal e′ velocity and E/e′ ratio. We defined left ventricular hypertrophy when left ventricular mass indexed to body surface ⩾115 g/m2 in men or ⩾95 g/m2 in women and left atrial enlargement when left atrium volume indexed to body surface >34 mL/m2. We considered a septal e′ velocity and E/e′ ratio as abnormal when septal e′ velocity <7 cm/s (impaired left ventricle diastolic function) and E/e′ ratio >14 (increased left ventricle filling pressure). 17
Brain MRI
We performed a brain MRI in all participants using a Phillips Achieva 1.5 T MRI. The study protocol included T1 (TR = 400–500 ms, TE 15 ms, slice thickness 5 mm), T2 (TR = 4000–5000 ms, TE 120 ms, slice thickness 5 mm), FLAIR (TR = 11,000 ms, TE 140 ms, slice thickness 5 mm), DWI (b-values of 0 and 1000, 5 mm section thickness and 108 × 109 matrix), T2*(GRE, TR/TE 756/23 ms, matrix 236 × 167; sections 24, FoV 235 × 209 mm, FA 18°, slice thickness 5 mm) and susceptibility-weighted sequences (TR/TE x35/50 ms, matrix 256 × 256, sections 10, FoV 64 × 23 cm, FA 15ª, slice thickness 2 mm). Two experienced neuroradiologists (CM, LC) blinded to clinical data assessed the presence of the acute infarct and presence of neuroimaging markers of cSVD (lacunes, WMH, microbleeds, and EPVS) according to STRIVE criteria. 1 In case of discrepancy, an experienced stroke neurologist reviewed the images (MGC) and a consensus diagnosis was reached. WMH on FLAIR sequences were evaluated using the Fazekas score for both periventricular and deep white matter areas. 18 Lacunes were defined as fluid-filled cavities between 3 and 15 mm in diameter, and microbleeds as small (2–5 mm in diameter) areas of signal void with associated blooming seen on susceptibility sequences. EPVS were defined as fluid-filled spaces smaller than 3 mm in diameter that followed the typical course of a vessel in the gray or white matter and were graded using a semiquantitative scale from 0 to 4 in basal ganglia and centrum semiovale (1:1–10 EPVS, 2: 11–20 EPVS, 3: 21–40 EPVS, 4: >40). 19 The total cSVD burden score was calculated using a validated scale 20 scoring 1 point for each of the following items: one or more lacunes (1 point), one or more microbleeds (1 point), deep WMH Fazekas score 2, or periventricular WMH Fazekas score 3 (1 point) and basal ganglia EPVS score ⩾2 (1 point). A follow-up MRI was conducted using the same scan protocol 2 years after the initial stroke to evaluate the occurrence of new lacunes or microbleeds. Evaluators (CM, LC) were not blinded to baseline MRI findings. Lacunes caused by the cavitation of the index stroke were not considered as new lacunes.
Statistical analysis
We considered two groups of patients according to those with new lacunes or microbleeds (new lesions) in the follow-up MRI and those without (no new lesions). Sample size was calculated was calculated from Klarenbeek et al. 21 Those authors found that 18% of the patients with a recent lacunar infarct had new microbleeds after 2 years of follow-up. 24h-SBP was 151 ± 18 mm Hg in patients with new microbleeds and 136 ± 17 mm Hg in those patients without. We calculated a total sample of 78 patients to find a statistically significant difference ⩾15 mm Hg (alpha risk 0.05, power 0.8). Final sample was increased to 98 patients assuming a 20% drop out. Continuous variables and ordinal variables were described by the mean and standard deviation (SD) or median and interquartile range (IQR) as appropriate. For all comparisons between groups, the χ² test, or the Fisher exact test whenever necessary, were applied for categorical variables. Continuous variables were tested for normality with the Kolmogorov–Smirnov test, and then compared between groups using a t test or a Mann–Whitney U test. We used Spearman’s test for correlations between continuous variables. All tests were done as two-sided and p values <0.05 were considered significant. Due to the limited sample size, we did not apply any imputation method to replace missing data. To adjust for potential confounding variables, we performed a binary logistic regression analysis. Variables with a p-value < 0.1 in the univariate analysis were introduced in the model. We followed Hosmer et al.’s recommendation to select the most parsimonious model that reflected the true outcome of the data while using the smallest number of variables. 22 To construct the models, we employed both the enter and backstep selection methods. Our model selection process involved evaluating the Nagelkerke R Square, global accuracy, and the area under the curve (AUC) of the predicted probabilities. Data analysis was performed using the IBM SPSS Statistics package, version 26.
Results
Flow chart of the screening process is shown in Figure 1. One hundred and three patients signed informed consent. Eleven patients were not included in the final analysis: three withdrew study participation immediately after inclusion, four died (one COVID pneumonia, two non-COVID pneumonia and one new-onset metastatic cancer) and four patients did not undergo the follow-up MRI. The final sample for analysis included 92 patients with available follow-up MRI.
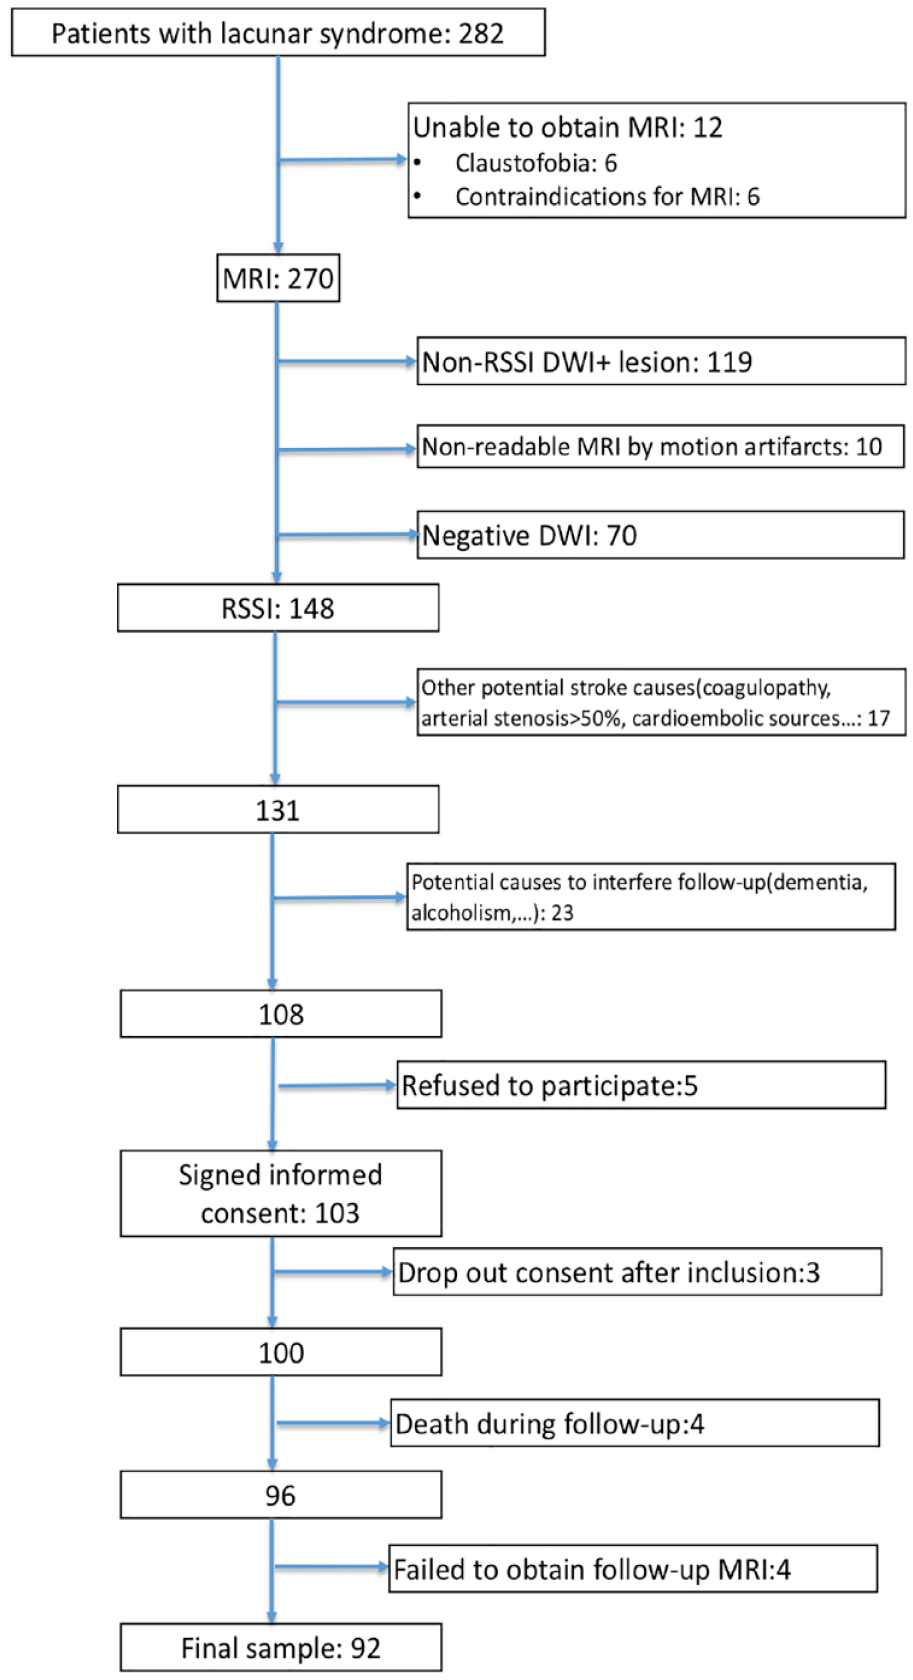
Flow chart of the screening process.
Main demographic and clinical characteristics of the final sample are shown in table 1. Median (IQR) NIHSS and modified Rankin scale are discharge were 1 (0–2) and 2 (1–2) respectively. Upon hospital discharge, prescribed antihypertensive drugs were as follows: 29 patients (31.5%) received ⩾3 antihypertensive drugs, 32 patients (34.8%) received two drugs, 24 patients (26.1%) received one drug, and seven patients had no antihypertensive medications. Blockers of the renin-angiotensin system (ACE inhibitors or renin receptor blockers) were most common (78 patients, 84.8%), followed by calcium antagonists (49 patients, 37%) and diuretics (34 patients, 37%). ABPM was performed, mean (IQR), 12 (8–24) days after stroke. Median (IQR) number of readings were 93 (88–97).
Baseline demographic and clinical data in patients with and without new lesions.
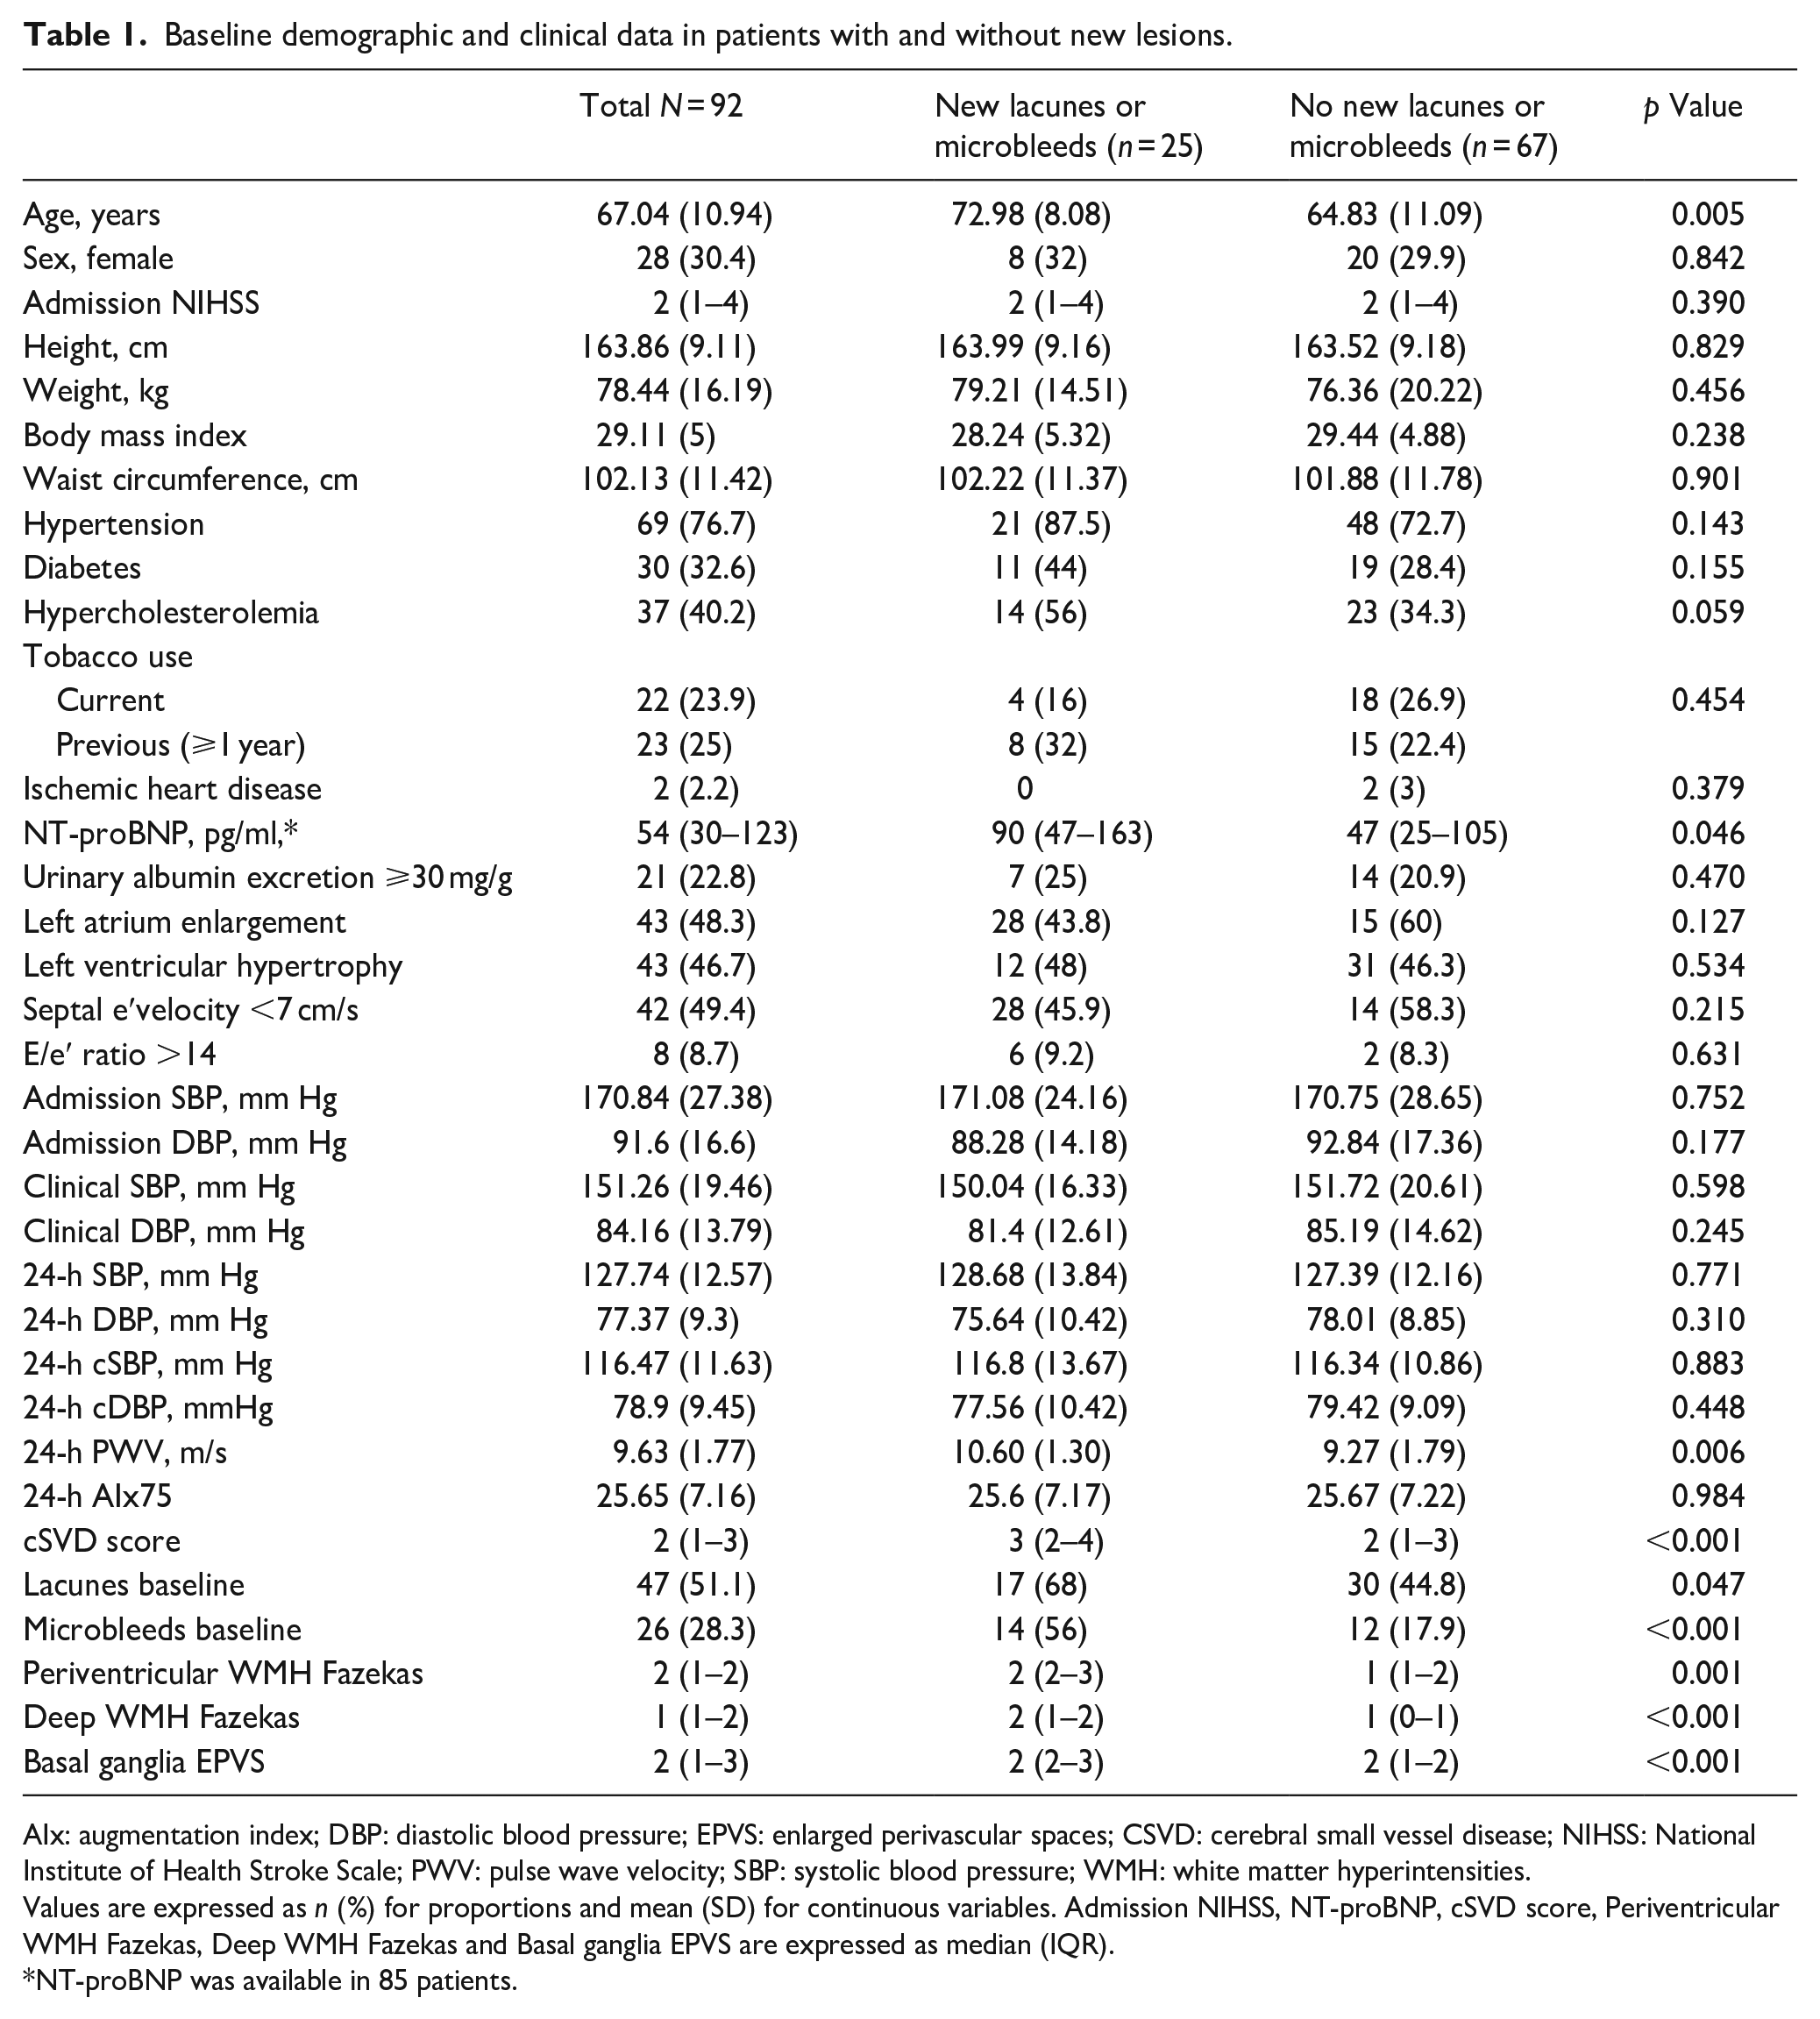
AIx: augmentation index; DBP: diastolic blood pressure; EPVS: enlarged perivascular spaces; CSVD: cerebral small vessel disease; NIHSS: National Institute of Health Stroke Scale; PWV: pulse wave velocity; SBP: systolic blood pressure; WMH: white matter hyperintensities.
Values are expressed as n (%) for proportions and mean (SD) for continuous variables. Admission NIHSS, NT-proBNP, cSVD score, Periventricular WMH Fazekas, Deep WMH Fazekas and Basal ganglia EPVS are expressed as median (IQR).
NT-proBNP was available in 85 patients.
At 2 years of follow up, 82 patients (89.1%) were taking blockers of the renin-angiotensin system, 36 (39.1%) were taking calcium antagonists, and 50 (54.3%) were taking diuretics. Twenty-nine patients (31.5%) were taking three or more antihypertensive drug, 40 (43.5%) were on two antihypertensive drugs, 20 (21.7%) on one drug and 3 (3.3%) patients were not taking any hypertensive drug. Twenty-five patients had new lacunes or microbleeds on the follow-up MRI: 10 patients had isolated new microbleeds, 7 isolated new lacunes, and 8 had both type of lesion. The number of new lacunes and new microbleeds ranged from 1 to 3 and 1 to 11, respectively. Eighth patients had isolated lobar microbleeds (one new microbleed per patient), eight patients had isolated deep microbleeds, and two patients had mixed deep and lobar microbleeds.
Patients with new lesions were older, with hypercholesterolemia, and had higher NT-proBNP, 24-h PWV and cSVD score values than patients without (Table 1). 24-h PWV showed positive correlations with age (r = 0.942, p < 0.001), NT-proBNP (r = 0.375, p < 0.001) and cSVD score (r = 0.387, p < 0.001). Table 2 shows the crude ORs of age, 24-h PWV, NT-proBNP, hypercholesterolemia, cSVD score and its different components for the appearance of new lacunes or microbleeds. The three best models according to the AUC included the following variables (Table 3): Model 1 (AUC 0.854): Age, cSVD score, 24-h PWV, Hypercholesterolemia. Model 2 (AUC 0.852): cSVD score, 24-h PWV, Hypercholesterolemia. Model 3 (AUC 0.843): Age, cSVD score, Hypercholesterolemia. A detailed description of all possible models and their predictive capacity appear in Supplemental Tables S1 and S2. cSVD remained independently associated with new lacunes or microbleeds when adjusted by age, 24-h PWV, NT-proBNP and hypercholesterolemia (OR 2.453, CI95% 1.381–4.358) and in the rest of potential models (Supplemental Table S1). 24-h PWV was independently associated with new lacunes or microbleeds in model 2, but not in any of the models where age was included (Supplemental Table S1). When the different components cSVD score were adjusted by age, 24-h PWV, hypercholesterolemia, and NT-proBNP only the presence of brain microbleeds (OR 4.511, CI95% 1.384–14.704) and Fazekas score (OR 1.650, CI95% 1.076–2.532) were associated with the presence of new lacunes or microbleeds (Figure 2).
Crude ORs of the most important variables associated with the presence of new lacunes or microbleeds.
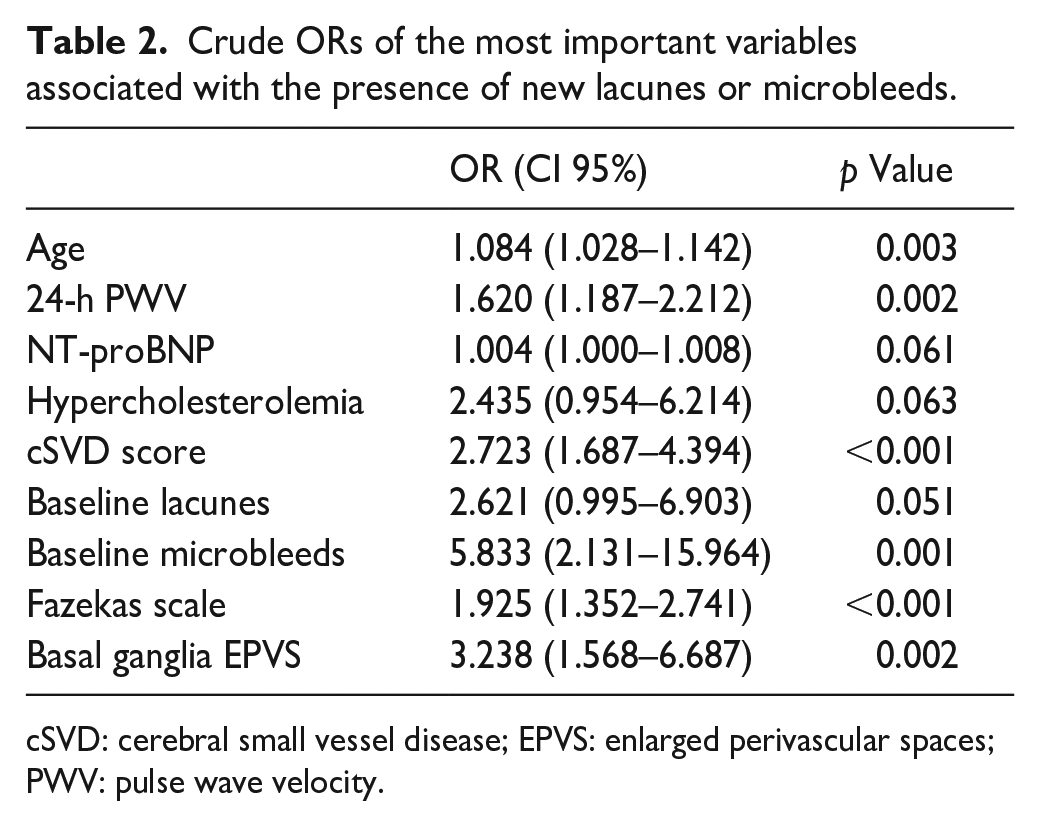
cSVD: cerebral small vessel disease; EPVS: enlarged perivascular spaces; PWV: pulse wave velocity.
Models with the highest predictive value based on the AUC (Model 1 AUC 0.854, model 2 AUC 0.852, model 3 AUC 0.843).
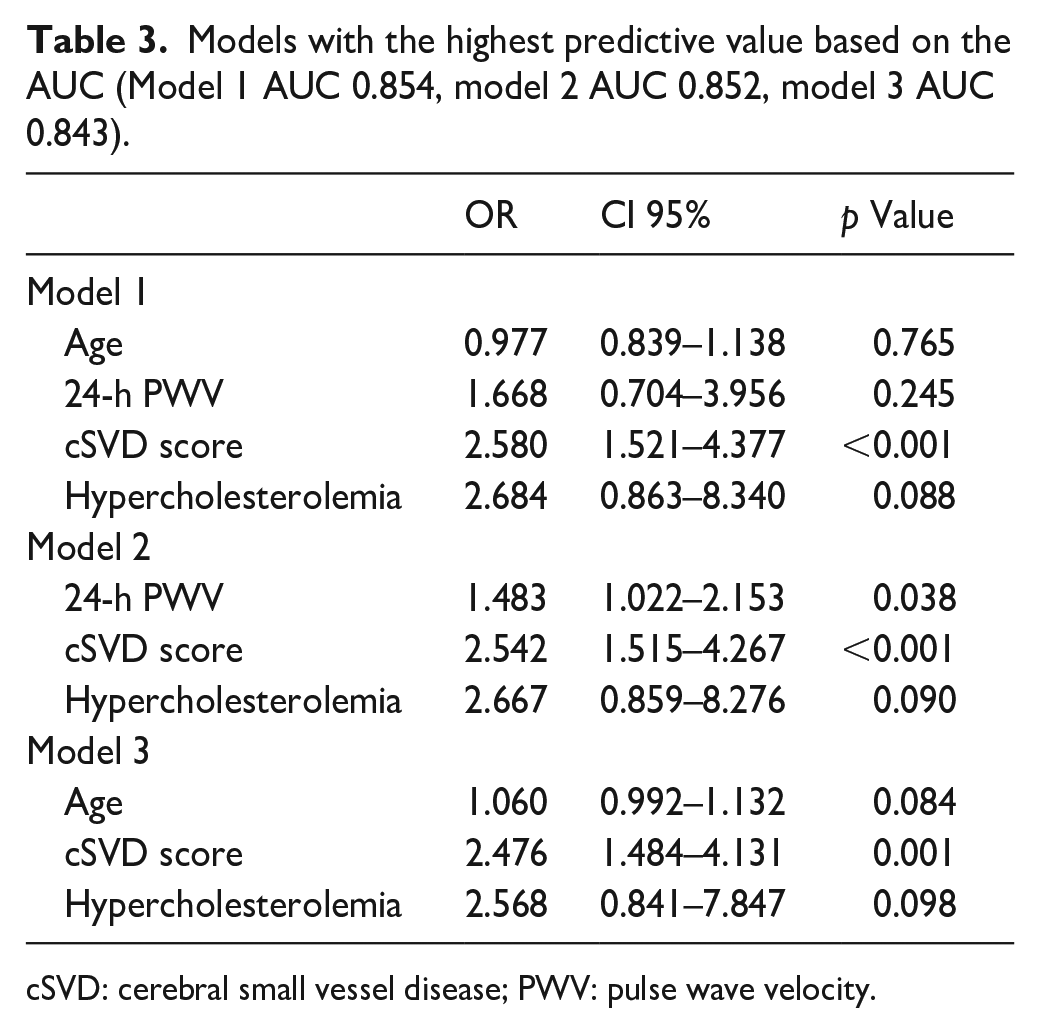
cSVD: cerebral small vessel disease; PWV: pulse wave velocity.
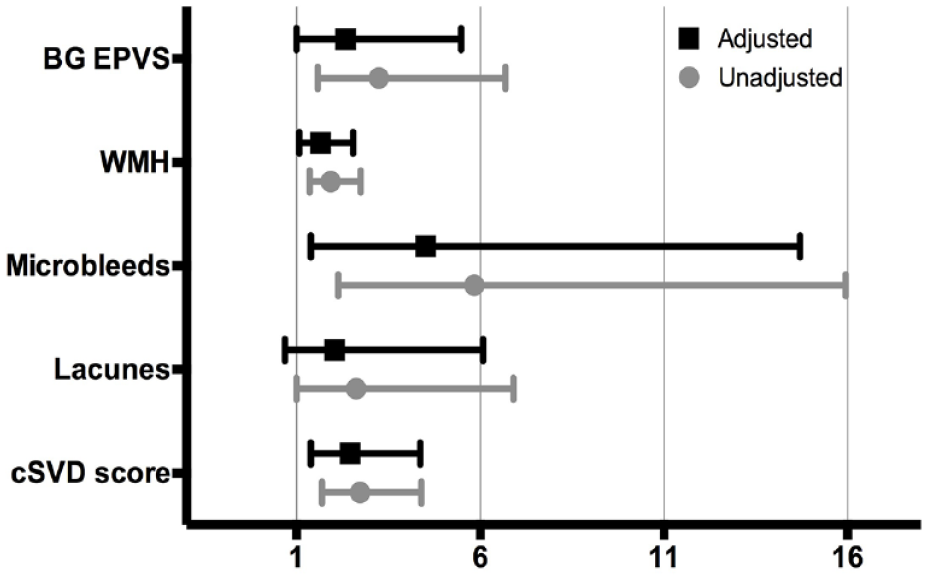
Unadjusted and adjusted odds ratios (ORs) along with their corresponding confidence intervals (CIs) for the cSVD score and its different components. Lacunes and microbleeds are defined by their presence or absence on baseline MRI. WMH represents the sum of periventricular and deep white matter Fazekas scores, giving a value that ranges from 0 to 6. BG EPVS represents the score for enlarged perivascular spaces in basal ganglia. It ranges from 0 to 4.
Five patients experienced a clinical stroke during the follow up. In all the cases the new infarct fulfilled the radiological criteria for RSSI and all five of these patients exhibited new lesions on follow-up MRI that were distinct from the lesion associated with the clinical stroke episode: two patients had new lacunes, one patient had new isolated microbleeds and two had both new lacunes and microbleeds. Patients with recurrent stroke were older (Mean [SD] 76.5 [4.6] versus 66.42 [11.61] years, p = 0.037), had higher 24-h PWV (Mean [SD] 11.17 [1.12] vs 9.62 [1.89] m/s, p = 0.04) and had higher cSVD score (median [IQR] 3.5 [2.5–4] versus 2 [1–3], p = 0.022) compared to patients that did not suffer a stroke recurrence. Four patients developed atrial fibrillation. None of those patients suffered a recurrent stroke and only one of them had new microbleeds in the follow-up MRI. There were no patients with new acute coronary syndromes or who developed clinical heart failure during follow-up.
Discussion
cSVD is a common health problem that is associated with an increased risk of stroke and dementia. 23 Its progression throughout life has been associated with prior microvascular lesions, as well as advanced age and high BP.24–26 We have shown that in a cohort of patients with a RSSI, baseline cSVD burden was the main determinant for the appearance of new microbleeds and/or vascular lacunes after a follow-up period of 2 years. We also observed that arterial stiffness measured by 24-h PWV might play a role in the development of new lacunes and microbleeds but its effect was attenuated when age was taken into account.
Current data about the association between arterial stiffness and cSVD has come primarily from cross-sectional studies5–7,27,28 and more longitudinal data are needed. Among the available hemodynamic parameters, only 24-h PWV showed some association with the development of new microvascular lesions, while no association was found for baseline brachial BP, central BP or AIx. Arterial stiffness is determined by aging and vascular risk factors, 8 and in our cohort of patient we found a very strong correlation between age and 24-h PWV. However, models that included 24-h PWV showed slightly better predictive performance compared to those incorporating age. Indeed, while the model that included age, 24-h PWV, hypercholesterolemia, and cSVD score demonstrated the highest discriminative value, this value was nearly identical to that obtained when age was excluded from the model. However, the observed differences were marginal, limiting the practical significance of this findings. Furthermore, we have not been able to demonstrate and independent association of 24-h PWV and cSVD progression when age was taken into account, limiting the applicability of our results.
cSVD score and its different components showed a robust association with the presence of new lacunes or microbleeds. As anticipated, this association, was stronger for the presence of microbleeds at baseline, but it was not so prominent for lacunes. Although the presence of WMH and Basal ganglia EPVS also exhibited some degree of association with the outcome, it was the global cSVD score, the neuroimaging marker that showed a more accurate association with the occurrence of new lacunes or microbleeds, underscoring the intricate nature of cSVD.
The strengths of our study are the consecutive inclusion of patients with RSSI in a short period of time and, as note before, a longitudinal design, compared to previous investigations that showed a transversal association between arterial stiffness and cSVD6,7,29–32 Besides, our selection criteria, quite similar to those applied in forthcoming trials aimed study microvascular function in patients with cSVD 33 has probably enabled us to study a very homogeneous population of patients where RSSI was probably a manifestation of cSVD. Similarly, it is worth noting that all recurrent strokes occurred in the form of RSSI. Additionally, only four patients developed AF after follow-up and none of those patients had a recurrent stroke.
Our study has some limitations. On one hand, it is a single-center study with a small sample size, which has probably affected the strength of the associations that we have found, therefore our results must be interpreted with caution. Besides, as mentioned before, the follow-up period is probably too short for cSVD, a disease which typically progresses over several decades. However, this short period of follow-up probably explains the reduced number of dropouts for our primary objective. We also acknowledge that oscillometry, the method we used to measure PWV, tends to underestimate arterial stiffness in young subjects, 34 although this effect has been probably minimal in an elderly population like ours. On the other hand, oscillometry methods offer high reproducibility, without the operator-dependent variability that may occur with applanation tonometry.
In conclusion, our study shows that cSVD burden is a stronger predictor of cSVD progression than age or other hemodynamic parameters in patients with a RSSI. However, it is possible that arterial stiffness, indicated by PWV, as a consequence of aging, could also play a role in contributing to cSVD. Our study adds longitudinal data to previous knowledge, but larger series are probably needed to obtain a more accurate measure of the possible association between arterial stiffness and cSVD progression. Understanding whether arterial stiffness plays a role in cSVD progression could become pivotal in the future, particularly if targeted strategies for de-stiffening could be implemented. 35
Supplemental Material
sj-docx-1-eso-10.1177_23969873231207764 – Supplemental material for Relationship of arterial stiffness and baseline vascular burden with new lacunes and microbleeds: A longitudinal cohort study
Supplemental material, sj-docx-1-eso-10.1177_23969873231207764 for Relationship of arterial stiffness and baseline vascular burden with new lacunes and microbleeds: A longitudinal cohort study by Luis Mena, Juan José Mengual, Sonia María García-Sánchez, Carla Avellaneda-Gómez, Maria Àngels Font, Caterina Montull, Laura Castrillo, Pedro Blanch, Pere Castellanos, Mercè Lleixa, Montserrat Martín-Baranera, Pedro Armario and Manuel Gómez-Choco in European Stroke Journal
Supplemental Material
sj-pdf-2-eso-10.1177_23969873231207764 – Supplemental material for Relationship of arterial stiffness and baseline vascular burden with new lacunes and microbleeds: A longitudinal cohort study
Supplemental material, sj-pdf-2-eso-10.1177_23969873231207764 for Relationship of arterial stiffness and baseline vascular burden with new lacunes and microbleeds: A longitudinal cohort study by Luis Mena, Juan José Mengual, Sonia María García-Sánchez, Carla Avellaneda-Gómez, Maria Àngels Font, Caterina Montull, Laura Castrillo, Pedro Blanch, Pere Castellanos, Mercè Lleixa, Montserrat Martín-Baranera, Pedro Armario and Manuel Gómez-Choco in European Stroke Journal
Footnotes
Acknowledgements
We thank CERCA Programme/Generalitat de Catalunya for institutional support.
Declaration of conflicting interests
The author(s) declared no potential conflicts of interest with respect to the research, authorship, and/or publication of this article.
Funding
The author(s) disclosed receipt of the following financial support for the research, authorship, and/or publication of this article: This work was supported by a grant from the Fondo de Investigaciones Sanitarias of the Spanish Ministry of Health (PI17/1188). MGC was funded by the Department of Health of the Generalitat de Catalunya (grant SLT008/18/00032) by the call “Acció instrumental: Intensificació de professionals de la salut, modalitat de professionals sanitaris (infermeria i fisioteràpia).”
Ethical approval
Ethical approval for this study was obtained from Bellvitge University Hospital clinical research ethics committee with protocol number PR134/17(CSI 17/25).
Guarantor
MGC
Informed consent
Written informed consent was obtained from all subjects before the study.
Contributorship
LM analyzed the data and drafted the manuscript. JJM, SMGS, CAG, and MAF participated in the inclusion of the patients and made a critical review of the manuscript. PB performed the echocardiograms. CM and LC reviewed and analyzed the brain MRIs. PC contributed to BP control of the patients. MLL assisted in performing the ABPM. MMB contributed to the design of the study and statistical analysis. PA contributed to the design of the study and BP control of the patients. MGC contributed to the design of the study, clinical follow-up and drafted the manuscript.
Data availability
The data that support the findings of this study are available from the corresponding author upon reasonable request.
Supplemental material
Supplemental material for this article is available online.
References
Supplementary Material
Please find the following supplemental material available below.
For Open Access articles published under a Creative Commons License, all supplemental material carries the same license as the article it is associated with.
For non-Open Access articles published, all supplemental material carries a non-exclusive license, and permission requests for re-use of supplemental material or any part of supplemental material shall be sent directly to the copyright owner as specified in the copyright notice associated with the article.