
Abstract
Background:
There is increasing interest in the concept of frailty in stroke, including both physical frailty and imaging-evidence of brain frailty. We aimed to establish the prevalence of brain frailty in stroke survivors as well as the concurrent and predictive validity of various frailty measures against long-term cognitive outcomes.
Methods:
We included consecutively admitted stroke or transient ischaemic attack (TIA) survivors from participating stroke centres. Baseline CT scans were used to generate an overall brain frailty score for each participant. We measured frailty via the Rockwood frailty index, and a Fried frailty screening tool. Presence of major or minor neurocognitive disorder at 18-months following stroke or TIA was established via a multicomponent assessment. Prevalence of brain frailty was established based upon observed percentages within groups defined by frailty status (robust, pre-frail, frail). We assessed the concurrent validity of brain frailty and frailty scales via Spearman’s rank correlation. We conducted multivariable logistic regression analyses, controlling for age, sex, baseline education and stroke severity, to evaluate association between each frailty measure and 18-month cognitive impairment.
Results:
Three-hundred-forty-one stroke survivors participated. Three-quarters of people who were frail had moderate-severe brain frailty and prevalence increased according to frailty status. Brain frailty was weakly correlated with Rockwood frailty (Rho: 0.336; p < 0.001) and with Fried frailty (Rho: 0.230; p < 0.001). Brain frailty (OR: 1.64, 95% CI = 1.17–2.32), Rockwood frailty (OR: 1.05, 95% CI = 1.02–1.08) and Fried frailty (OR: 1.93, 95% CI = 1.39–2.67) were each independently associated with cognitive impairment at 18 months following stroke.
Conclusions:
There appears to be value in the assessment of both physical and brain frailty in patients with ischaemic stroke and TIA. Both are associated with adverse cognitive outcomes and physical frailty remains important when assessing cognitive outcomes.
Introduction
Frailty is a highly prevalent condition amongst stroke and transient ischaemic attack (TIA) survivors, existing in as many as 28% of patients upon admission to the acute stroke unit.1,2 Frailty assessment is increasingly being incorporated into acute care pathways but has yet to be routinely adopted in stroke. 2 Evidence suggests there is prognostic value in assessing for frailty in stroke: delirium, mortality and post-stroke cognitive outcomes are all associated with frailty status.3–5
Frailty can be characterised as a state of multisystem physiological vulnerability with diminished capacity to manage external stressors. 6 Operationalisation of frailty can be highly variable. Numerous frailty measurement methods exist, reflecting the uncertainty regarding the best way to assess this syndrome. 7 However, although precise measurement can vary, two of the most commonly measured constructs include the frailty phenotype, as developed by Fried et al., 8 and accumulated deficits frailty, as developed by Rockwood et al. 9 Fried frailty is typically assessed by measuring symptoms of physical frailty such as unexplained weight loss, muscle weakness, slow mobility, exhaustion, and low physical activity. Whereas Rockwood frailty is assessed via a more global measure of frailty that encapsulates a combination of physical, social and neuropsychological deficits that accumulate over the life-course.
Evidence of pre-existing damage visible on a brain scan at the time of the stroke, such as atrophy, leukoaraiosis, or old infarcts, can provide valuable prognostic information following stroke. 10 However, generating a composite of this damage via a ‘brain frailty’ scale appears to provide stronger prognostic information than measuring each type of damage in isolation. 11 In general, brain frailty is a state of reduced neurophysiological reserve and may predispose people to poor cognitive outcomes. 12 Recently, Appleton et al. 11 tested a scale for measuring brain imaging-based brain frailty 13 that involves routinely observable neuroimaging markers (leukoaraiosis, cerebral atrophy and old infarcts). However, the scale has not yet been validated directly against measures of Fried or Rockwood frailty and we do not know the extent to which imaging-derived brain frailty co-occurs with Fried or Rockwood frailty.
Traditional measures of frailty, such as Fried or Rockwood, tend to be considered in isolation from directly observed imaging-derived brain frailty despite increasing evidence indicating they may be associated.14,15 If traditional measures of frailty are synonymous with brain frailty, then measuring each construct separately is inefficient. On the other hand, if they are distinct, establishing their independent associations with long-term cognitive outcomes could help improve clinical decision making.
Aims
Our study had three main aims:
1) to validate a measure of imaging-derived brain frailty against traditional (Fried and Rockwood) measures of frailty.
2) to establish the prevalence of brain frailty in those who are/are not frail (as defined according to each traditional measure).
3) to examine the association between pre-stroke frailty and pre-stroke brain frailty with long-term cognitive impairment and dementia following stroke or TIA.
Methods
We followed STROBE (Strengthening the Reporting of Observational Studies in Epidemiology) guidelines 16 for reporting. This is a sub study of the APPLE (Assessing Psychological Problems in stroke: A longitudinal Evaluation; research registry ID: 1018) project—a multicentre, prospective longitudinal cohort study embedded within the UK National Health Service. A summary of our methodology is provided below. Comprehensive details are available in the study protocol. 17 Ethical approval was approved by the Scotland A Research Ethics committee and obtained for all participating sites (REC number:Sixteen/SS/0105).
Setting
APPLE recruited consecutively admitted stroke and transient ischaemic attack (TIA) survivors admitted to participating acute stroke centres (November 2016 to February 2019) with no exclusions based on age, stroke-type, stroke-severity, or comorbidity. Proxies were used to provide consent wherever participants were unable to consent themselves. This sub-study was restricted to sites with CT brain raw images available for analysis.
Brain frailty assessment
Baseline CT brain scans were performed for all participants as part of routine acute care. We adopted an approach developed in IST-313 and further refined for application, 11 to generate a brain frailty score for each participant using baseline CT scan images. A detailed description of this approach can be seen in the protocol. 18 In brief, two trained assessors (MH; MT), who were blinded to clinical details, rated baseline CT scans using a set proforma 18 and scored presence of leukoaraiosis, cerebral atrophy, and old infarcts. Scans were rated against a standard template (Supplemental Materials Figure S1). ‘Modest’ leukoaraiosis, ‘modest’ atrophy (centrally and/or cortically) and presence of old focal cortical or subcortical vascular lesions were combined to generate a brain frailty score ranging from 0 (no brain frailty) to 3 (severe brain frailty).
Frailty assessment
We measured frailty according to two of the most commonly employed frailty concepts: Rockwood’s ‘accumulated deficits’ global measure of frailty, and Fried’s ‘frailty phentoype’, which focuses on physical frailty.
Rockwood et al. 7 frailty was measured via a 32-item frailty index (Supplemental Materials Figure S2), constructed based on previously validated frailty indexes and/or recommended guidelines. 19 A combination of participant medical records and self/informant reported functional measures 20 and Independent Activities of Daily Living 21 were used to identify physical, functional, cognitive or psychological issues present before the stroke (informant reports were only used in cases where the participant was not able to complete a self-reported measure). Possible scores ranged from 0 to 100, with scores closer to 100 suggesting greater frailty. Participants were categorised as ‘robust’, ‘pre-frail’ and ‘frail’ using recommended cut-points of <8; 8–24 and >24, respectively.
Fried frailty was established via a self-report frailty screening tool. 22 Where possible, informant reports were used when self-reported information was unavailable. The measure involves self-reported symptoms of physical frailty including exhaustion, unexplained weight loss, and low physical activity. Cut-points recommended by the scale developers were used to identify ‘frail’ and ‘non-frail’ participants.
Outcome assessment
We employed a centrally adjudicated approach to establish presence of major and minor cognitive impairment at 18 months following stroke. Participants received a multi-domain cognitive assessment battery (details are proved in the APPLE protocol 17 ) at baseline, 1 month, 6, 12 and 18 months. Performance on cognitive assessment was supplemented by evaluation of clinical case notes and other medical records up to an 18-month follow-up timeframe. Two assessors (medical and psychology backgrounds) independently evaluated the available data for each participant, and a consensus diagnosis, based on Diagnostic and Statistical Manual (DSM5) criteria, 23 was established. Cognitive impairment diagnoses were applied conservatively; only formal diagnoses of major or minor neurocognitive impairment established via a medical professional, or consistent performance on cognitive testing that fell below standardised thresholds (e.g. performance below standardised cut points for impairment on the abbreviated mental test, and/or performance at 1.5 SD below age-matched norms on respective neuropsychological tests) for impairment were adjudicated as impaired at 18-months. All adjudications were made without knowledge of participants’ frailty or brain frailty status.
Statistical analyses
Cohen’s weighted Kappa was used to establish inter-observer reliability of brain frailty ratings.
We conducted Spearman’s rank correlation to evaluate the concurrent validity of brain frailty relative to traditional frailty measures. The correlation coefficients were interpreted using conventional cut-points. 24
Prevalence of brain frailty was established based upon observed percentages within the study population. Pre-specified cut-offs were applied to the Rockwood frailty index to differentiate ‘frail’, pre-frail and ‘non-frail’ participants. Fried frailty was established via dichotomisation at the recommended cut point. 22 Confidence intervals were generated for each prevalence estimate. 25
Multivariable logistic regression analysis was preformed to investigate the association between brain, physical and global measures of frailty with long-term cognitive impairment 18-months following stroke. Primary analysis (Model 1) controlled for age, sex, stroke severity and years in education. Brain frailty and Fried frailty were analysed on an ordinal scale, while Rockwood frailty was analysed on a linear scale.
We performed a sensitivity analysis restricted to participants with 18-month cognitive data only to ensure that our analysis was not overly influenced by adjudicated outcomes that relied more heavily on clinical case notes for 18-month diagnoses.
We conducted a series of subgroup analyses. In subgroup analysis 1, we excluded participants who had a known diagnosis of dementia at baseline in order to improve the clinical applicability of our analyses. In subgroup analysis 2, we additionally excluded people who had a TIA only.
We also conducted post hoc analyses to (1) explore if brain frailty was associated with long-term cognitive impairment independent of Fried or Rockwood frailty (Model 2), and vice-versa; (2) explore if brain, Fried or Rockwood frailty was associated with long-term cognitive impairment independent of baseline cognitive test scores – measured via the abbreviated mental test-plus (AMT-plus – an amalgamation of brief cognitive screening tests with overlapping assessments questions. Details of specific test components can be seen in study protocol 17 ) (Model 3); (3) explore if brain frailty was associated with long-term cognitive impairment over both baseline cognitive scores and frailty scores, or if Fried or Rockwood measures of frailty were associated with long-term cognitive impairment over both baseline cognitive scores and brain frailty scores (Model 4).
A univariate cox regression survival analysis was performed to investigate if there was a difference between brain, Fried or Rockwood frailty status and likelihood of death during follow-up.
Regression analyses used a complete case approach. We conducted univariate logistic regression analyses to investigate differences between brain, Fried or Rockwood frailty status and missing data. Statistical assumptions were checked for each analysis. SPSS version 27 (IBM) was used for all analyses.
Results
Of 357 participants in APPLE, 341 were recruited from sites with CT brain data available (Figure 1 and Table 1).
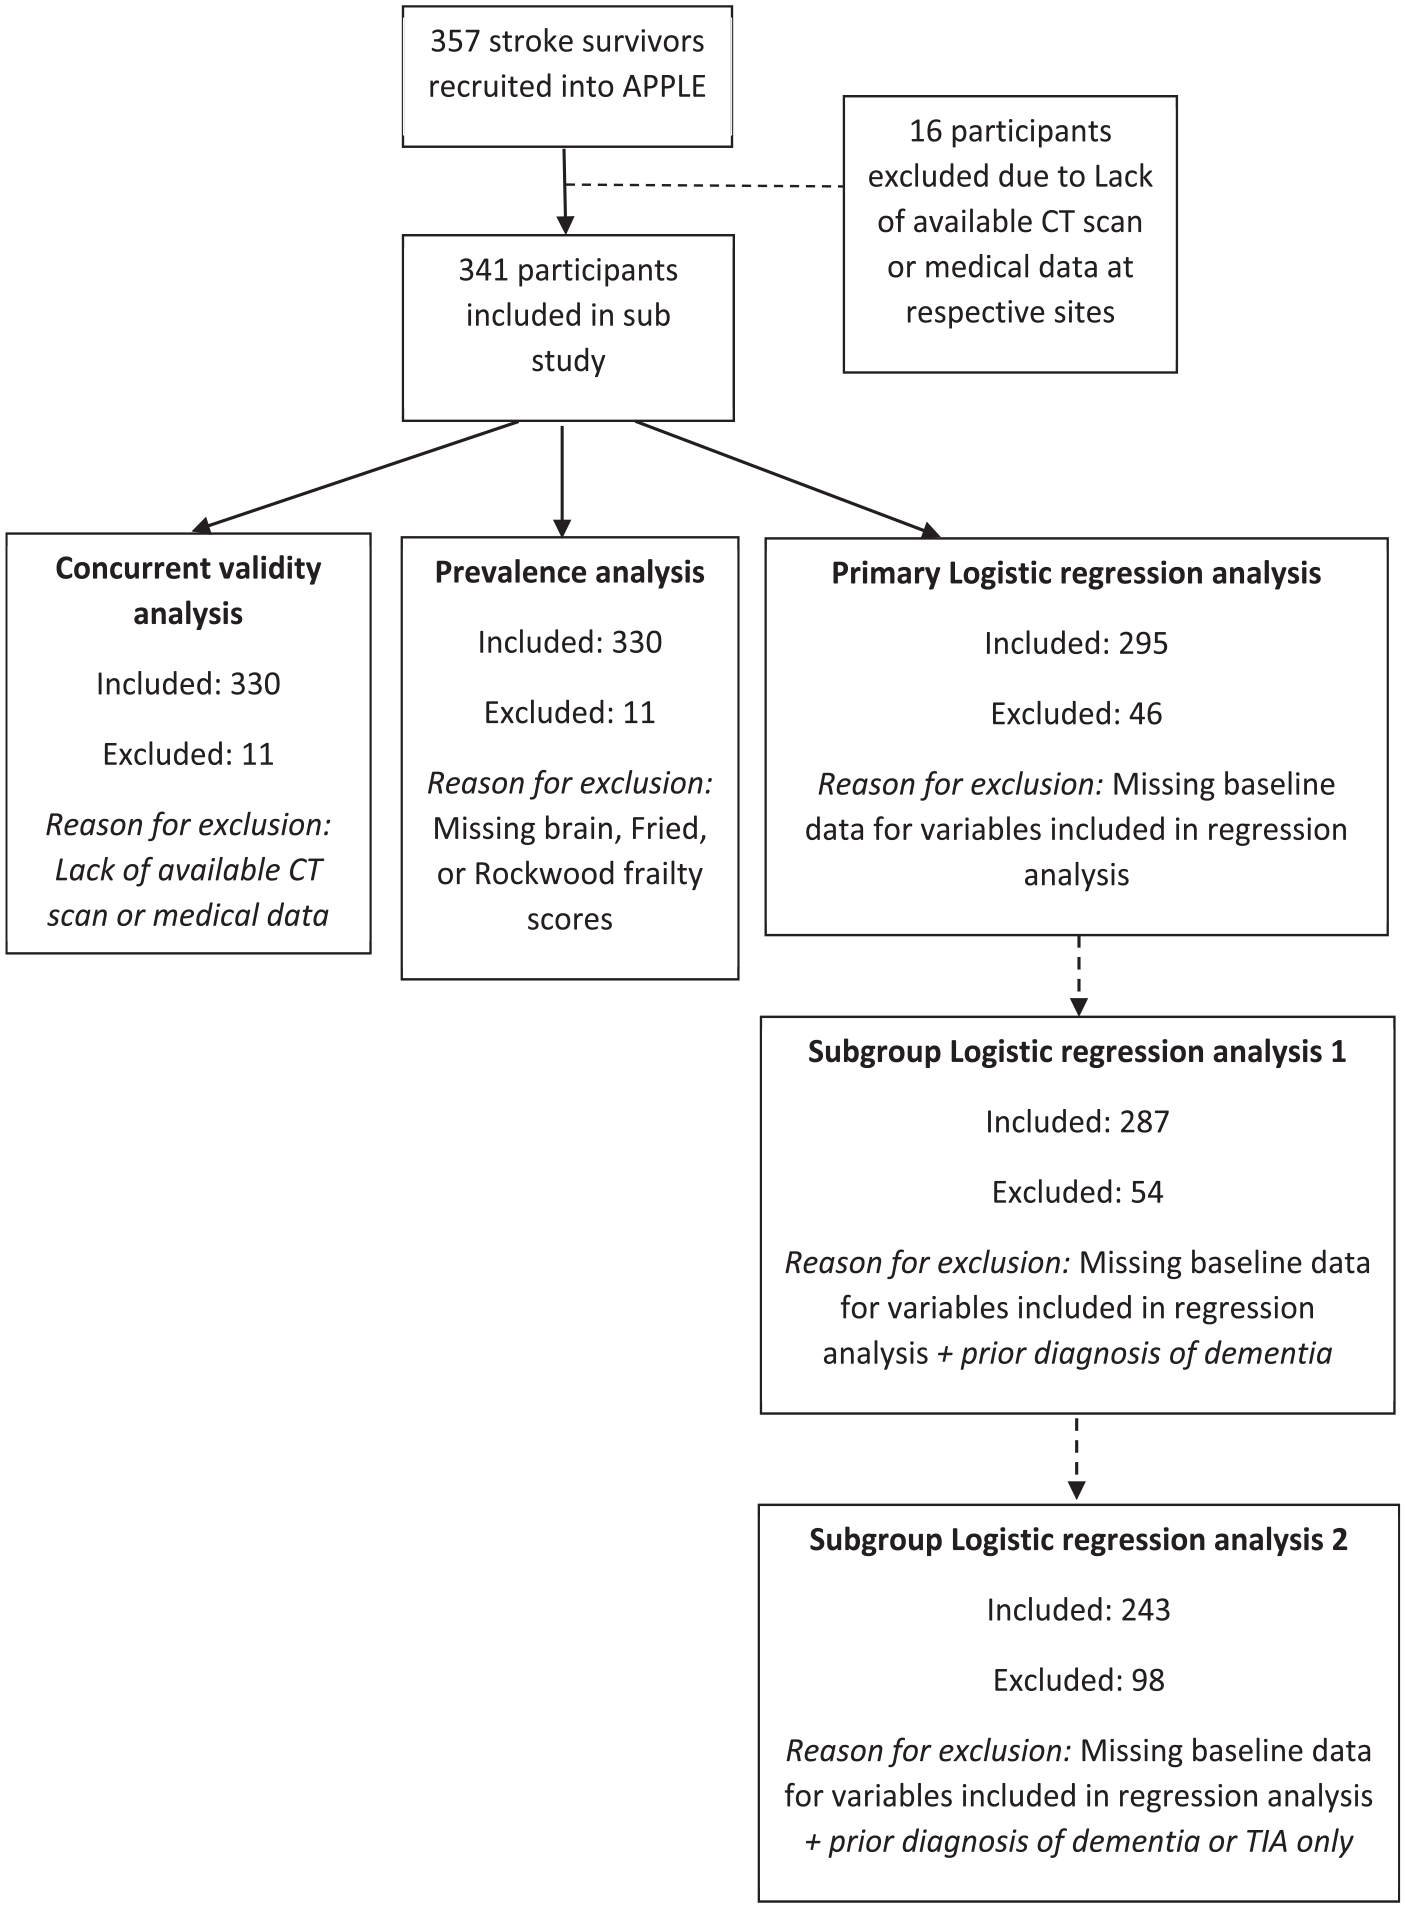
Flow chart of study attrition.
Baseline study population characteristics.
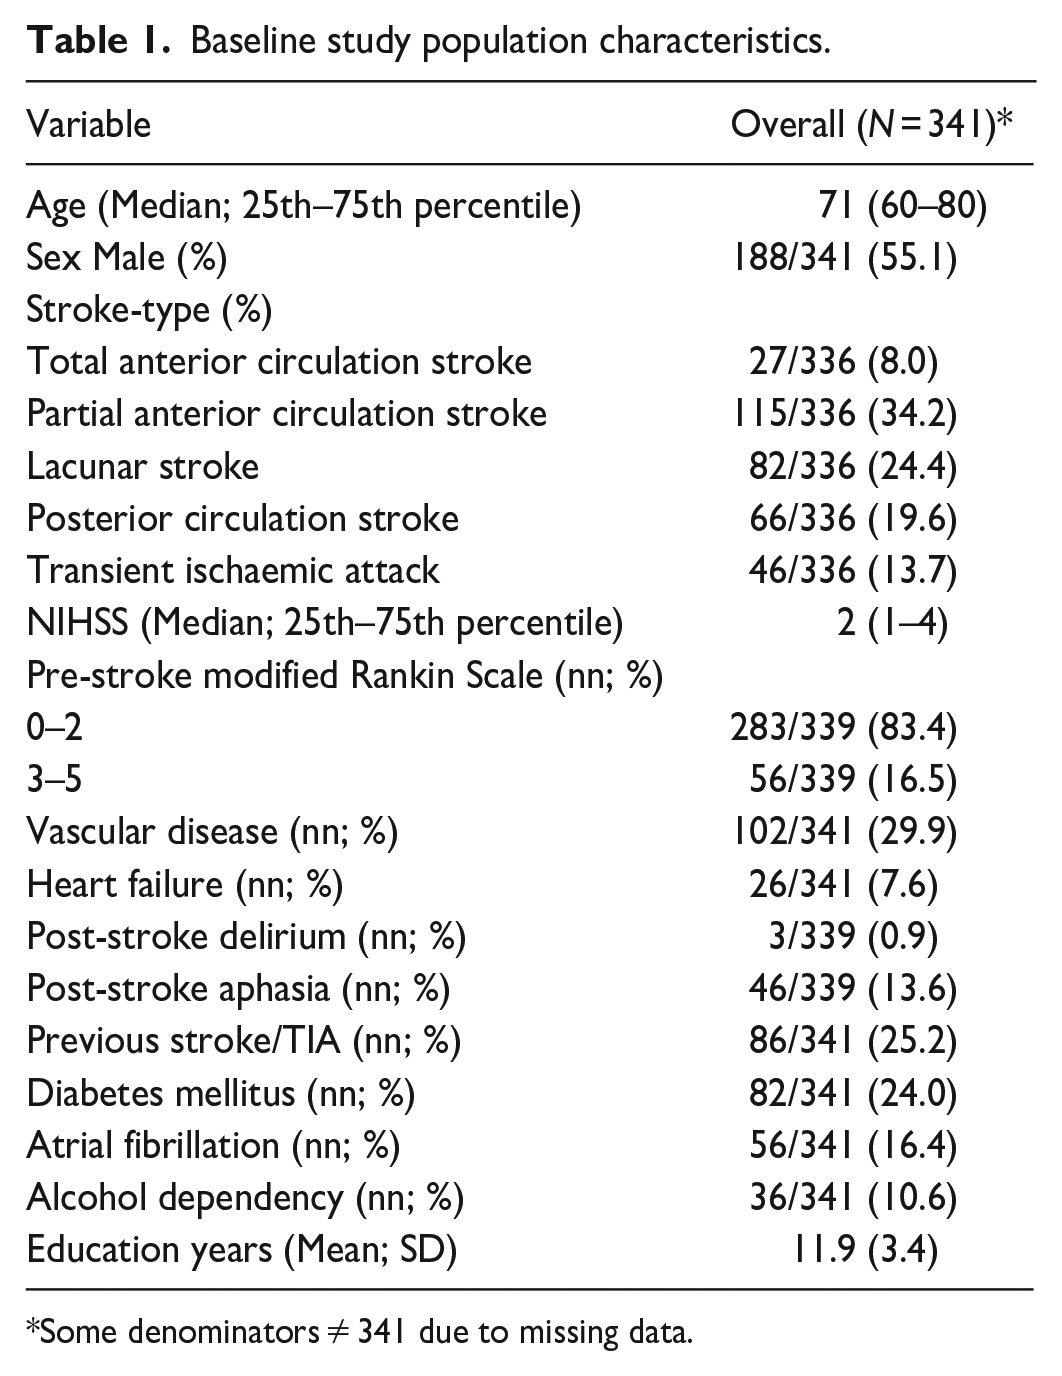
Some denominators ≠ 341 due to missing data.
Three-hundred-thirty-two participants had baseline CT scan data available, 329 had Fried phenotype frailty scores available, and 339 had a Rockwood frailty index score. Thirty-three participants had missing clinical or demographic baseline data and 22 participants had missing baseline cognitive data. Follow-up cognitive test data was available for 266 (78%) participants at at least one time-point after baseline; 160 out of 308 (52%) surviving participants had 18-month cognitive test data available; secondary and primary care follow-up data were available for all participants (Figure 1).
Univariate regression analysis showed that brain frailty (OR: 1.38, 95% CI = 0.95–2.02) and Rockwood frailty scores (OR: 1.02, 95% CI = 0.98–1.06) were not associated with missing baseline data; but higher Fried frailty scores were associated with missing baseline data (OR: 1.64, 95% CI = 1.12–2.41). Both brain frailty (OR: 1.31, 95% CI = 1.05–1.64), and Rockwood frailty (OR: 1.04, 95% CI = 1.02–1.07) were associated with missing 18-month cognitive data but not Fried frailty scores (OR: 1.15, 95% CI = 0.90–1.46).
Thirty-three (10%) participants died before end of study (18-months post-baseline); survival analysis indicated each point increase of brain frailty (HR:1.84, 95% CI = 1.29–2.62), Rockwood frailty (HR: 1.06, 95% CI = 1.04–1.09), and Fried frailty (HR: 1.59, 95% CI = 1.14–2.22) significantly increased the risk of death before end of study.
Inter-observer reliability of brain frailty ratings was acceptable (weighted kappa = 0.76).
Concurrent validity of brain frailty scale
Spearman’s rank suggested a significant, weak correlation between brain frailty and Rockwood frailty (rho: 0.336; p < 0.001). There was also a weak correlation between brain frailty and physical frailty (rho: 0.230; p < 0.001)(Figure 2).
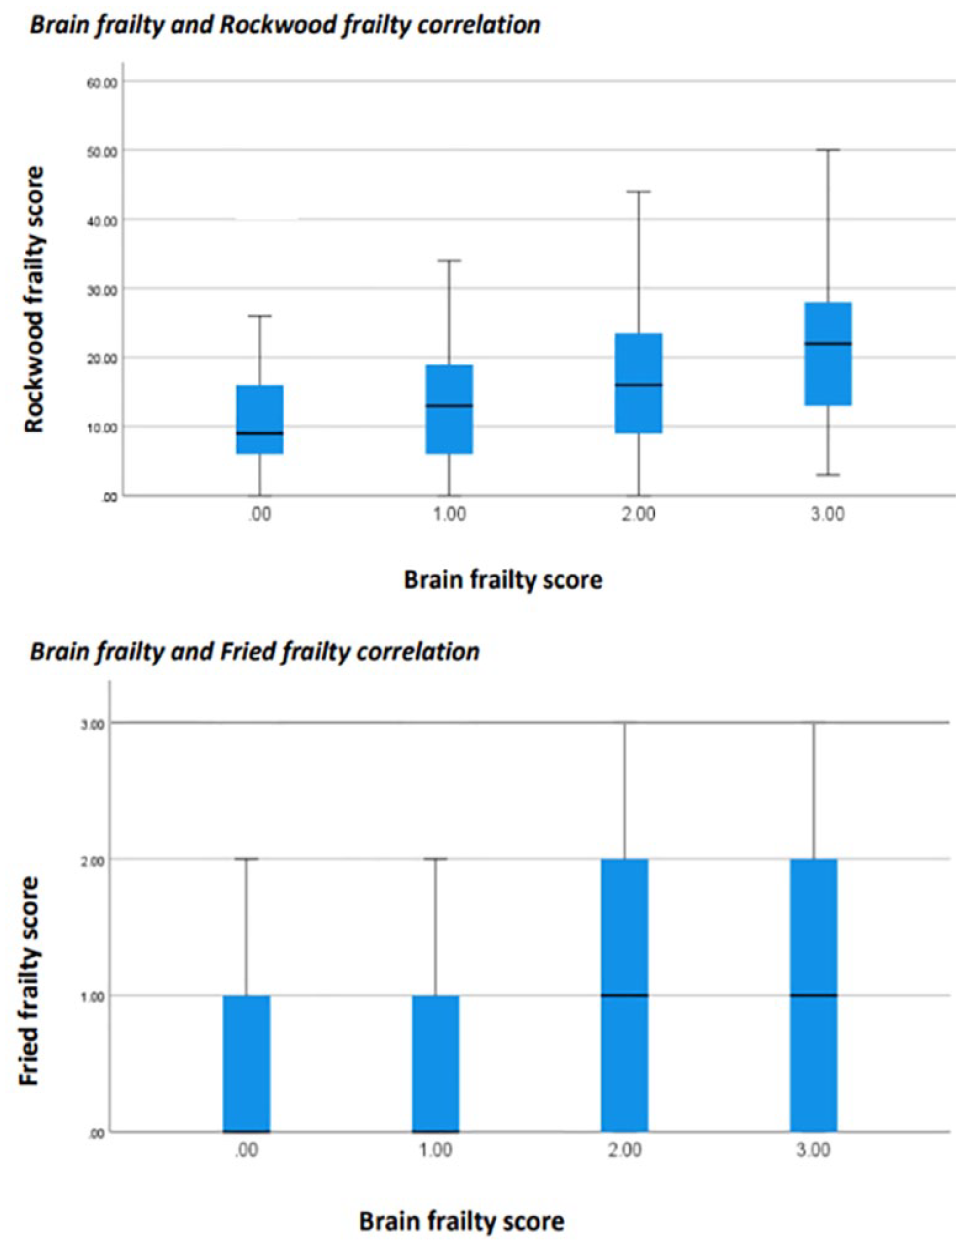
Correlation between brain frailty and traditional frailty measures.
Prevalence of brain frailty in those who are physically frail
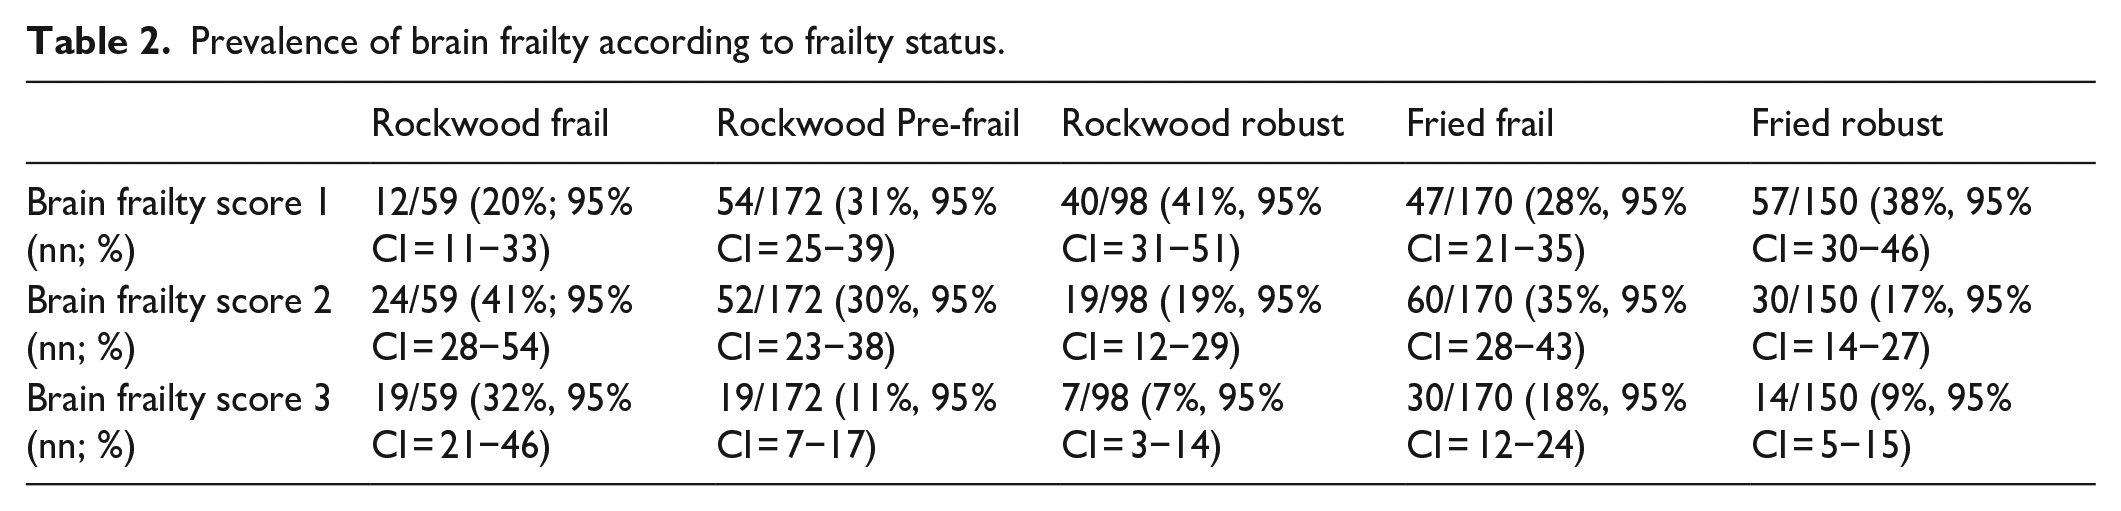
A total of 106/332 (32%, 95% CI = 27−37) participants had a brain frailty score of 1; 96/332 (29%, 95% CI = 24−34) had a score of 2; and 46/332 (14%, 95% CI = 10−18) had a score of 3. Distribution of each component of the brain frailty scale can be seen in Figure 3. Fifty-nine out of 330 (18%; 95% CI = 14−22) participants were categorised as frail (cut point > 0.24), 172/330 (52%, 95% CI = 47−58) were pre-frail (cut point 8–24) and 98/330 (30%, 95% CI = 25−35) were ‘robust’, according to the Rockwood frailty index (score < 8). One hundred seventy out of 320 (53%, 95% CI = 48−58) participants were classified as frail on the Fried frailty measure. Prevalence of brain frailty according to frailty status can be seen in Table 2.
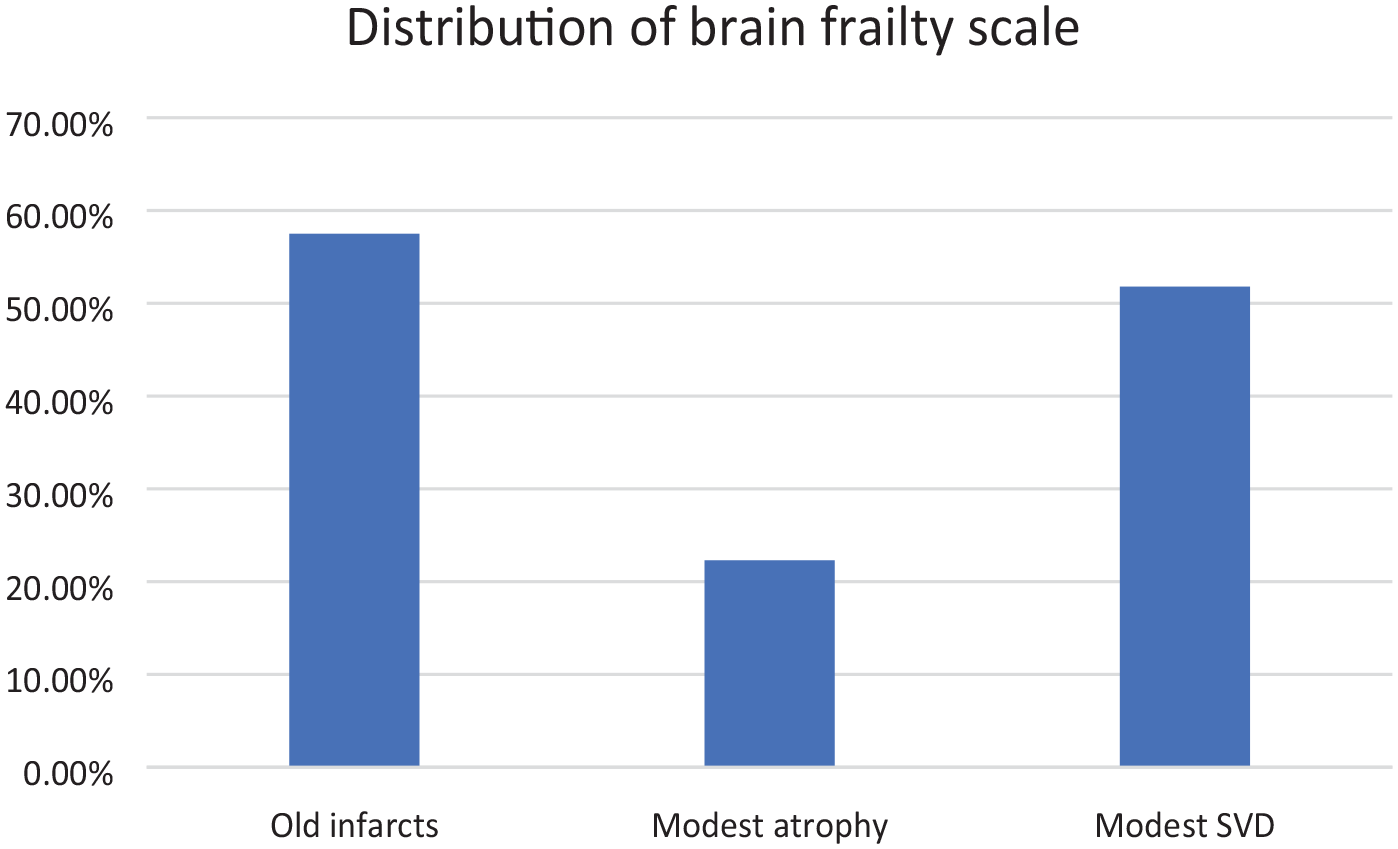
Distribution of brain frailty scale.
Prevalence of brain frailty according to frailty status.
Overlap between measures of frailty were limited: only 22% of participants were classified as frail on both the Rockwood and Fried measures. By comparison, 41% of participants were categorised as frail on both brain frailty and Fried scale, while 17% were classified as frail on both brain frailty and Rockwood scale. Degree of overlap for all three frailty measures is illustrated (Figure 4).
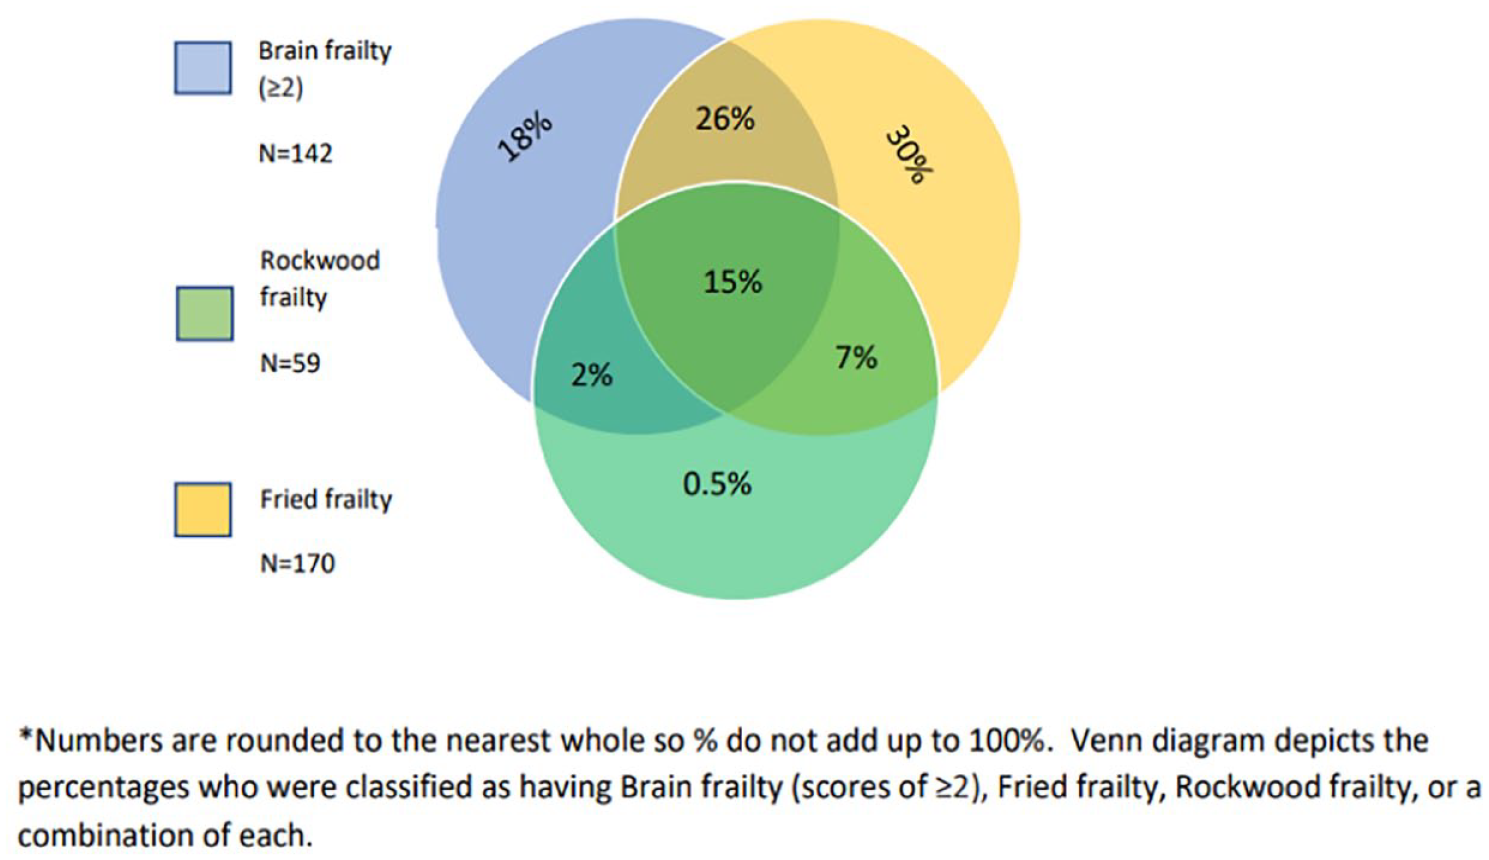
Overlap between participants categorised as frail according to each frailty measure.
Brain/physical frailty association with long-term cognitive impairment
Two hundred ninety-five participants were included in primary analysis; 69/295 (23.4%) had adjudicated cognitive impairment at 18 months. In Model 1, each point increase on the brain frailty scale (OR: 1.64, 95% CI = 1.17–2.32), Rockwood frailty index (OR: 1.05, 95% CI = 1.02–1.08), and Fried frailty scale (OR: 1.93, 95% CI = 1.39–2.67) independently increased odds of cognitive impairment 18 months after stroke. Model 2 suggested brain frailty was associated with long-term cognitive impairment independent of both Rockwood frailty (brain frailty OR: 1.47, 95% CI = 1.03–2.09) and Fried frailty (brain frailty OR: 1.48, 95% CI = 1.04–2.12). Rockwood frailty was similarly associated with long-term cognitive impairment independent of brain frailty (Rockwood OR: 1.04, 95% CI = 1.01–1.07), as was Fried frailty (Fried OR: 1.78, 95% CI = 1.27–2.49). In Model 3, which included adjustment for baseline cognitive status, brain frailty was no longer significantly associated with cognitive impairment (OR: 1.40, 95% CI = 0.93–2.10), while Rockwood frailty (OR: 1.04, 95% CI = 1.01–1.08) and Fried frailty (OR: 1.57, 95% CI = 1.08–2.26) remained significantly associated. Model 4, which included brain and Fried or Rockwood frailty controlled for baseline cognitive score, suggested Fried frailty remained significantly associated with long-term cognitive impairment independent of both brain frailty and baseline AMT-plus scores (Fried frailty OR: 1.49 95% CI = 1.03–2.18); however, Rockwood frailty (OR: 1.04, 95% CI = 0.99–1.076) and brain frailty (OR: 1.29, 95% CI = 0.85–1.95) were not (All models Table 3).
Logistic regression output for models 1–4. Brain frailty regression output for association with 18-month cognition. Rockwood frailty regression output for association with 18-month cognition. Fried frailty regression output for association with 18-month cognition.
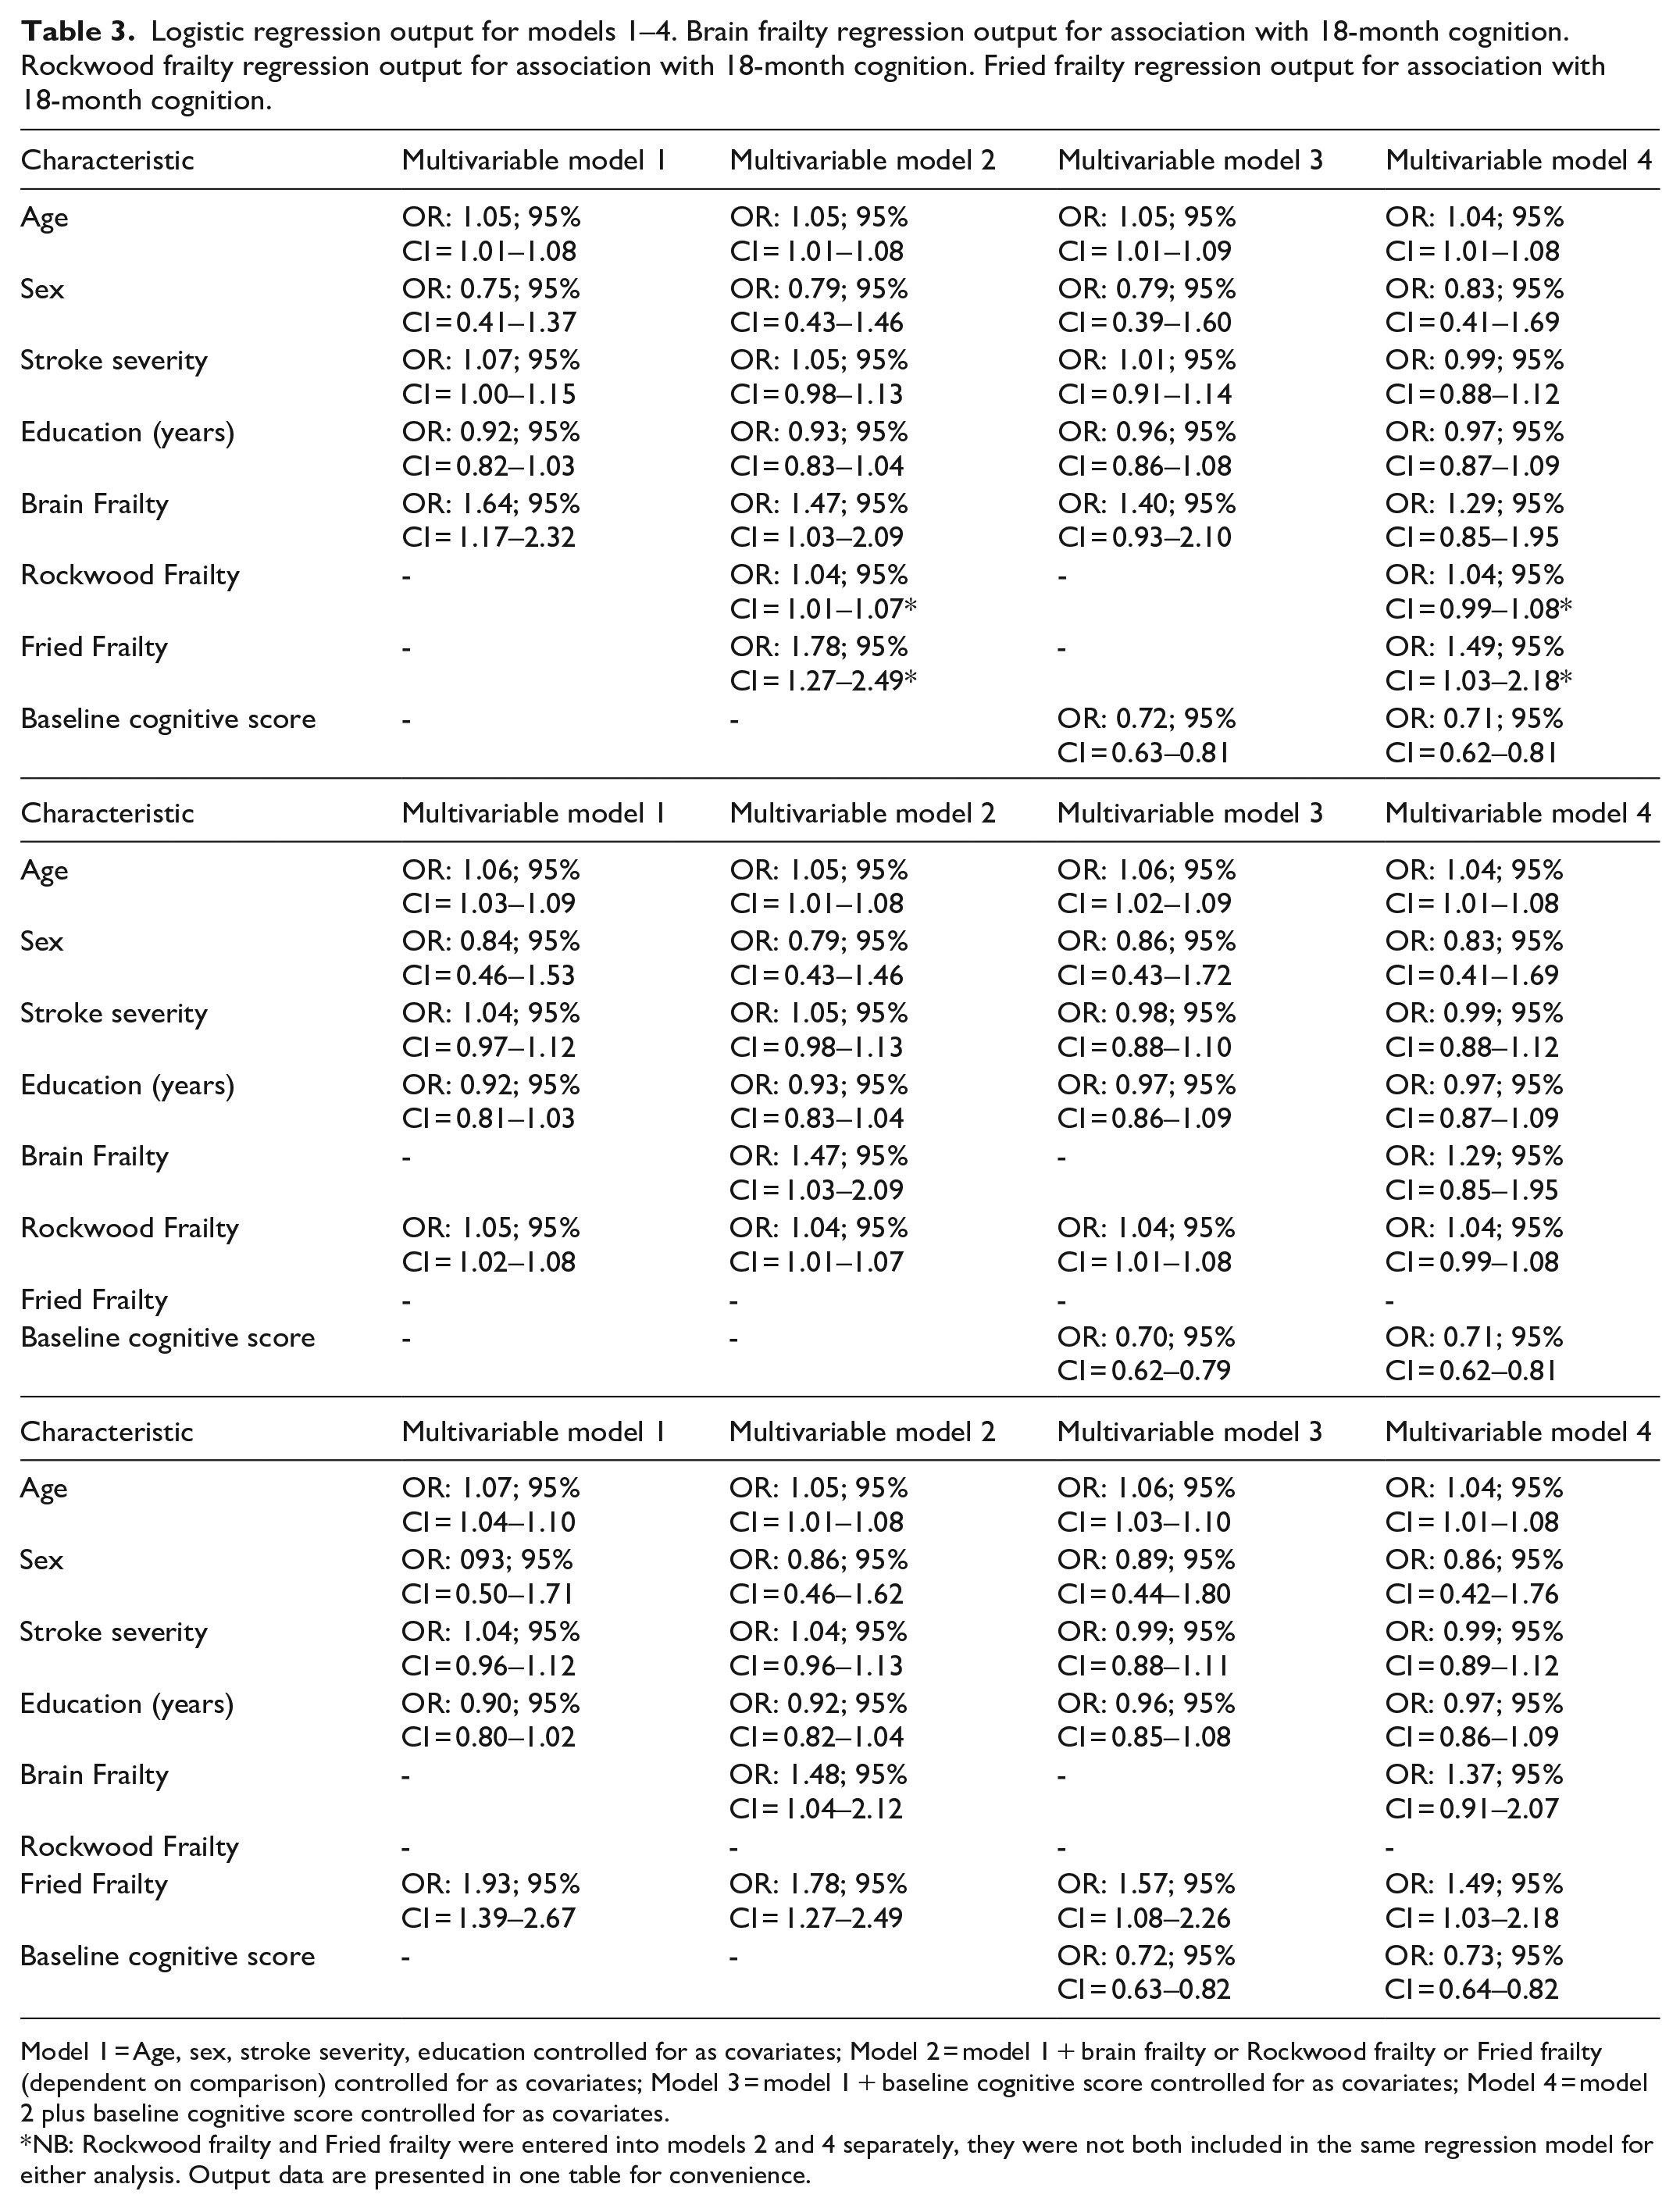
Model 1 = Age, sex, stroke severity, education controlled for as covariates; Model 2 = model 1 + brain frailty or Rockwood frailty or Fried frailty (dependent on comparison) controlled for as covariates; Model 3 = model 1 + baseline cognitive score controlled for as covariates; Model 4 = model 2 plus baseline cognitive score controlled for as covariates.
NB: Rockwood frailty and Fried frailty were entered into models 2 and 4 separately, they were not both included in the same regression model for either analysis. Output data are presented in one table for convenience.
Sensitivity analysis restricted to those with 18-month cognitive test data only was fully consistent with our primary results (Supplemental Materials S3).
Subgroup analyses
Thirty-five participants had a pre-existing diagnosis of dementia. Subgroup analysis excluding participants with a formal diagnosis of dementia at baseline were fully consistent with our primary results (Supplementary Materials S4).
Forty-six participants had a TIA only. Subgroup analysis additionally excluding participants with a TIA were also consistent with our primary results.
Discussion
Our findings suggest that brain frailty, Fried frailty, and Rockwood frailty are distinct, but frequently co-occurring constructs. Despite a weak overall correlation between measures, almost three-fourth of those who are frail according to the Rockwood frailty index, and >50% of those who were frail according to the Fried scale, had moderate to severe brain frailty scores and the prevalence of moderate to severe brain frailty increased as frailty status moved from robust to pre-frail to frail. Moreover, while prevalence of brain frailty in those who are frail appears substantial, it is also clear that each of our respective frailty measures retains an independent association with long-term cognitive impairment following stroke. Our findings are consistent with Wallace et al.26,27 suggesting frailty increases brain pathology but that it also plays a role in development of dementia above and beyond the brain pathogenesis.
Although brain frailty and Rockwood frailty were no longer significantly associated with long-term cognitive impairment after adjusting for baseline cognitive test performance, up to one-fourth of stroke survivors cannot fully complete traditional pen-and paper cognitive tests. 28 Frailty measures may therefore be useful as alternate prognostic indicators of long-term cognitive impairment in these instances, although it should first be established if frailty is associated with long-term cognitive impairment independent of being untestable on baseline cognitive testing.
The Fried frailty phenotype was distinct from the two other frailty measures evaluated here in that it appears to have prognostic value independent of both imaging-based brain frailty and baseline cognitive test performance. Most stroke survivors show cognitive impairment in the immediate aftermath of stroke, but trajectories of recovery/further decline are variable. Measurement of Fried frailty may therefore be of value when evaluating cognitive prognosis. Fried frailty is also a potentially modifiable form of frailty 29 and as such could be a target for interventions designed to minimise the long-term cognitive impact of a stroke. Physical and cognitive outcomes are often interrelated 30 ; increased exercise has been associated with reduced white matter hyperintensities and cerebral atrophy in older adults, 31 and physical activity plus risk factor reduction interventions have been shown to reduce rates of long-term cognitive decline. 32 This suggests that long-term cognitive outcomes may be improved by addressing issues of physical function, such as frailty. However, studies aiming to treat symptoms of the Fried frailty phenotype have produced mixed results overall, 33 and while symptoms of Fried frailty may be improved through exercise or nutritional therapies, this may do little to address the root cause of the syndrome. In addition, concerns have previously been raised regarding the feasibility of screening for Fried frailty in the acute stroke setting, 1 thus establishing when and how to measure this condition in stroke also requires further exploration.
Rockwood frailty may be more measurable and there is some evidence 34 that interventions emphasising the importance of nutrition, exercise and adherence to medication may be able to prevent further health decline. While Rockwood frailty likely cannot be reversed, prevention of further decline could be an important intervention for this population and may help to stop the risk of long-term cognitive issues from increasing further.
Whether brain frailty is treatable remains to be established. Previous studies 35 have suggested that antihypertensive medications may help to slow the progression of white matter hyperintensities and that this may in part play a role in reducing risk of dementia. However, evidence is limited, 36 hence this is an important avenue for further investigation.
Strengths and limitations
Our study involved a highly inclusive stroke and TIA cohort, and we followed best practice guidance for conduct and reporting. We ensured blinding and double scoring to minimise risk of bias and conducted a series of subgroup analyses to ensure our results were translatable to clinical practice. Our population appears generalisable, and we used CT imaging data to generate brain frailty scores meaning our results will be applicable to most stroke services. Despite this, there are important limitations to note. Eighteen-month cognitive test data were unavailable for a proportion of our sample, meaning that outcome assessment was reliant upon clinical case notes and primary/secondary care medical records. Although reliable dementia diagnoses can still be achieved using this approach, 37 some minor cases of cognitive impairment may have been missed; however, our sensitivity analysis suggests that this limitation did not significantly impact upon our results.
There were differences between risk of missing data and risk of in-study death based on pre-stroke frailty/brain frailty status. These differences may have impacted study significance values and effect sizes. However, this limitation is synonymous with longitudinal frailty and cognition research and may not be surmountable.
Our post hoc analyses were not powered to include the additional variables investigated; hence, the lack of significant predictive power of Rockwood frailty and brain frailty after including additional covariates could be related to lack of adequate statistical power.
Lastly, the challenges of operationalising frailty mean that the relative overlap between measures, along with the strength of relationships demonstrated in this study, may deviate if different frailty measures are employed – particularly if a larger cognitive component is adopted in respective physical frailty measures. However, the specific deficits included on the Rockwood and Mitnitski index are considered to be of less importance than the number of deficits measured, 38 while Fried frailty also typically shows similar overall associations despite variations in methods of measurement. 39 On this basis, we would generally expect the associations between frailty and long-term cognitive impairment observed in this study to hold.
Conclusions
Evaluating the combination of pre-existing leukoaraiosis, atrophy and old infarcts via routinely collected CT scan images appears to be a valid method of establishing a person’s brain resilience or vulnerability following stroke. Many stroke survivors who show signs of frailty before their stroke also show signs of brain frailty. However, despite an apparent co-occurrence between brain frailty and traditional frailty, each respective measure retains independent value for predicting long-term adverse cognitive outcomes. Our findings emphasise the public health importance of life-course risk factors on the development of dementia, 40 and suggest Fried frailty may be a viable target for interventions aiming to reduce post-stroke dementia risk.
Supplemental Material
sj-docx-1-eso-10.1177_23969873231186480 – Supplemental material for Physical and brain frailty in ischaemic stroke or TIA: Shared occurrence and outcomes. A cohort study
Supplemental material, sj-docx-1-eso-10.1177_23969873231186480 for Physical and brain frailty in ischaemic stroke or TIA: Shared occurrence and outcomes. A cohort study by Martin Taylor-Rowan, Melanie Hafdi, Bogna Drozdowska, Emma Elliott, Joanna Wardlaw and Terence J Quinn in European Stroke Journal
Footnotes
Declaration of conflicting interests
The author(s) declared no potential conflicts of interest with respect to the research, authorship, and/or publication of this article.
Funding
The author(s) disclosed receipt of the following financial support for the research, authorship, and/or publication of this article: This work was funded by the Scottish Neurological Research Fund, Stroke Association, and Chief Scientist Office of Scotland.
Ethical approval
This study was approved by the Scotland A Research Ethics committee and local R&D approval was obtained for all participant sites (REC number 16/SS/0105).
Informed consent
Written informed consent was obtained from the patient(s) for their anonymised information to be published in this article.
Guarantor
MT-R
Contributorship
MT-R, TQ and JW conceived the study. MT-R wrote the initial draft of the manuscript and conducted all analyses. MH was involved in establishing brain frailty ratings for all participants. EE and BD contributed to participant recruitment and data acquisition.
Supplemental material
Supplemental material for this article is available online.
References
Supplementary Material
Please find the following supplemental material available below.
For Open Access articles published under a Creative Commons License, all supplemental material carries the same license as the article it is associated with.
For non-Open Access articles published, all supplemental material carries a non-exclusive license, and permission requests for re-use of supplemental material or any part of supplemental material shall be sent directly to the copyright owner as specified in the copyright notice associated with the article.