
Abstract
Abstract
Introduction
Recent studies have shown that neuroimaging markers of cerebral small vessel disease can also regress over time. We investigated the cognitive consequences of regression of small vessel disease markers.
Patients and methods
Two hundred and seventy-six participants of the RUNDMC study underwent neuroimaging and cognitive assessments at three time-points over 8.7 years. We semi-automatically assessed white matter hyperintensities volumes and manually rated lacunes and microbleeds. We analysed differences in cognitive decline and accompanying brain atrophy between participants with regression, progression and stable small vessel disease by analysis of variance.
Results
Fifty-six participants (20.3%) showed regression of small vessel disease markers: 31 (11.2%) white matter hyperintensities regression, 10 (3.6%) vanishing lacunes and 27 (9.8%) vanishing microbleeds. Participants with regression showed a decline in overall cognition, memory, psychomotor speed and executive function similar to stable small vessel disease. Participants with small vessel disease progression showed more cognitive decline compared with stable small vessel disease (p < 0.001 for cognitive index and memory; p < 0.01 for executive function), although significance disappeared after adjusting for age and sex. Loss of total brain, gray matter and white matter volume did not differ between participants with small vessel disease regression and stable small vessel disease, while participants with small vessel disease progression showed more volume loss of total brain and gray matter compared to those with stable small vessel disease (p < 0.05), although significance disappeared after adjustments.
Discussion
Regression of small vessel disease markers was associated with similar cognitive decline compared to stable small vessel disease and did not accompany brain atrophy, suggesting that small vessel disease regression follows a relatively benign clinical course. Future studies are required to validate these findings and to assess the role of vascular risk factor control on small vessel disease regression and possible recovery of clinical symptoms.
Conclusion
Our findings of comparable cognitive decline between participants with regression and stable small vessel disease might suggest that small vessel disease regression has a relative benign cognitive outcome.
Introduction
Markers of cerebral small vessel disease (SVD) include white matter hyperintensities (WMH), lacunes and microbleeds and are frequently observed on neuroimaging in older individuals. 1 SVD has been recognised as most important vascular contributor to the development of cognitive decline and dementia. 2
Progression of SVD has been considered a continuous progressive process, but increasing evidence suggests that SVD progression is a dynamic process, sometimes interrupted by regression of SVD.3–7Specifically, a decrease in WMH volume, number of lacunes and number of microbleeds have been reported. 4 A neuroimaging study in patients with minor stroke observed WMH volume decline in 37% of participants 5 and we previously observed SVD regression in 20% of participants, 3 suggesting that SVD regression might be a true phenomenon, with unknown clinical implications.
SVD regression might affect clinical outcome in two ways: 4 SVD regression might accompany global brain atrophy and thereby lead to impaired clinical outcome, or SVD regression might reflect reversibility of white matter damage (i.e. before permanent axonal injury has occurred) and account for recovery of clinical symptoms.5,8
In the present study, we performed an exploratory study on the cognitive consequences of SVD regression. We therefore examined the cognitive consequences of SVD regression and accompanying brain atrophy in 276 elderly with SVD, using neuroimaging and cognitive assessments at three time-points over nine years.
Method
Study population
The RUNDMC study prospectively investigates risk factors and clinical consequences of SVD in 503 elderly with SVD. 9 We included 276 participants with repeated magnetic resonance imaging (MRI) assessment of sufficient quality. 3 The Medical Review Ethics Committee region Arnhem-Nijmegen approved the study and all participants gave written informed consent. Data that support the findings of this study are available from the corresponding author upon request.
Cognition
All participants underwent neuropsychological assessment at three time-points using validated cognitive tasks. 10 We calculated a compound score for global cognitive function (cognitive index) and for three cognitive domains: memory, psychomotor speed and executive function. Raw scores of all time-points were transformed into z-scores based on baseline mean and standard deviation (SD).
Neuroimaging
Magnetic resonance images were acquired at three time-points on 1.5-T MRI (2006: Siemens, Magnetom Sonata; 2011 and 2015: Siemens, Magnetom Avanto) and included T1-weighted three-dimensional MPRAGE (isotropic voxel size 1.0 mm3), FLAIR (2006: voxel size 0.5 × 0.5 × 5.0 mm, interslice gap 1.0 mm; 2011 and 2015: voxel size 0.5 × 0.5 × 2.5 mm; interslice gap 0.5 mm) and transversal T2*-weighted gradient echo sequences (voxel size 1.3 × 1.0 × 5.0 mm, interslice gap 1.0 mm).3,9The same head coil was used at all three time-points. To minimise effects of changes in FLAIR sequence, we resliced follow-up FLAIR images to match slice thickness of baseline images using linear interpolation.
Small vessel disease
We calculated total brain, gray matter and white matter volumes using SPM12 (http://www.fil.ion.ucl.ac.uk/spm/). 3 WMH volumes were calculated semi-automatically and lacunes and microbleeds were rated manually.1,3Segmentations were visually checked for segmentation errors by one trained rater, blinded for clinical data. All volumes were corrected for inter-scan-differences in intracranial volume (ICV) and then normalised to baseline ICV. To minimise risk of misclassification due to co-registrations, we visually inspected all WMH segmentations and corrected lacune occurrence maps based on manual ratings. Besides, we calculated WMH volumes for odd and even slices separately to determine the effects of change in slice thickness of the FLAIR sequence.
Statistical analyses
We compared baseline characteristics between participants with SVD regression, progression and stable SVD using univariate analyses. We defined SVD regression as >0.25 ml WMH volume decline or ≥vanishing lacunes or microbleeds, and SVD progression as >1SD WMH progression or ≥ incident lacunes or microbleeds, according to our previous study. 3 We assessed differences in cognitive decline and brain atrophy between participants with regression, progression and stable SVD by one-way analysis of variance, additionally adjusted for age and sex.
Findings
Fifty-six participants (20.3%) showed regression of SVD markers: 31 participants (11.2%) showed WMH regression, 10 (3.6%) vanishing lacunes and 27 (9.8%) vanishing microbleeds. 3 Characteristics of participants with SVD regression are presented in the online Supplemental Table I. Stratified by time-period, 42 participants (15.2%) showed regression during the first time-interval, 30 (10.9%) during the second time-interval and 23 (8.3%) during the overall follow-up. The distribution of microbleeds is shown in the online Supplemental Table II.
Participants with regression showed similar cognitive decline compared to those with stable SVD (Figure 1). Participants with SVD progression showed more cognitive decline compared to stable SVD (WMH: mean difference (95% CI): –0.23 (–0.56,–0.02); p = 0.017 for cognitive index; –0.34 (–0.59,–0.09); p = 0.004 for memory and –0.29 (–0.51,–0.06); p = 0.006 for executive function; lacunes: –0.21 (–0.41,–0.01); p = 0.036 for executive function; microbleeds: –0.22 (–0.42,–0.02); p = 0.024 for cognitive index; –0.29 (–0.54,–0.04); p = 0.019 for memory and –0.24 (–0.47,–0.02); p = 0.029 for executive function), although significance was lost after adjustments for age and sex. Participants with WMH regression showed less cognitive decline compared to those with WMH progression (0.29 (0.02,0.56); p = 0.035 for cognitive index; 0.42 (0.08,0.76); p = 0.010 for memory), and participants with vanishing lacunes showed less decline in psychomotor speed compared to participants with incident lacunes (0.48 (0.01,0.96); p = 0.043), although significance was lost after adjustments.
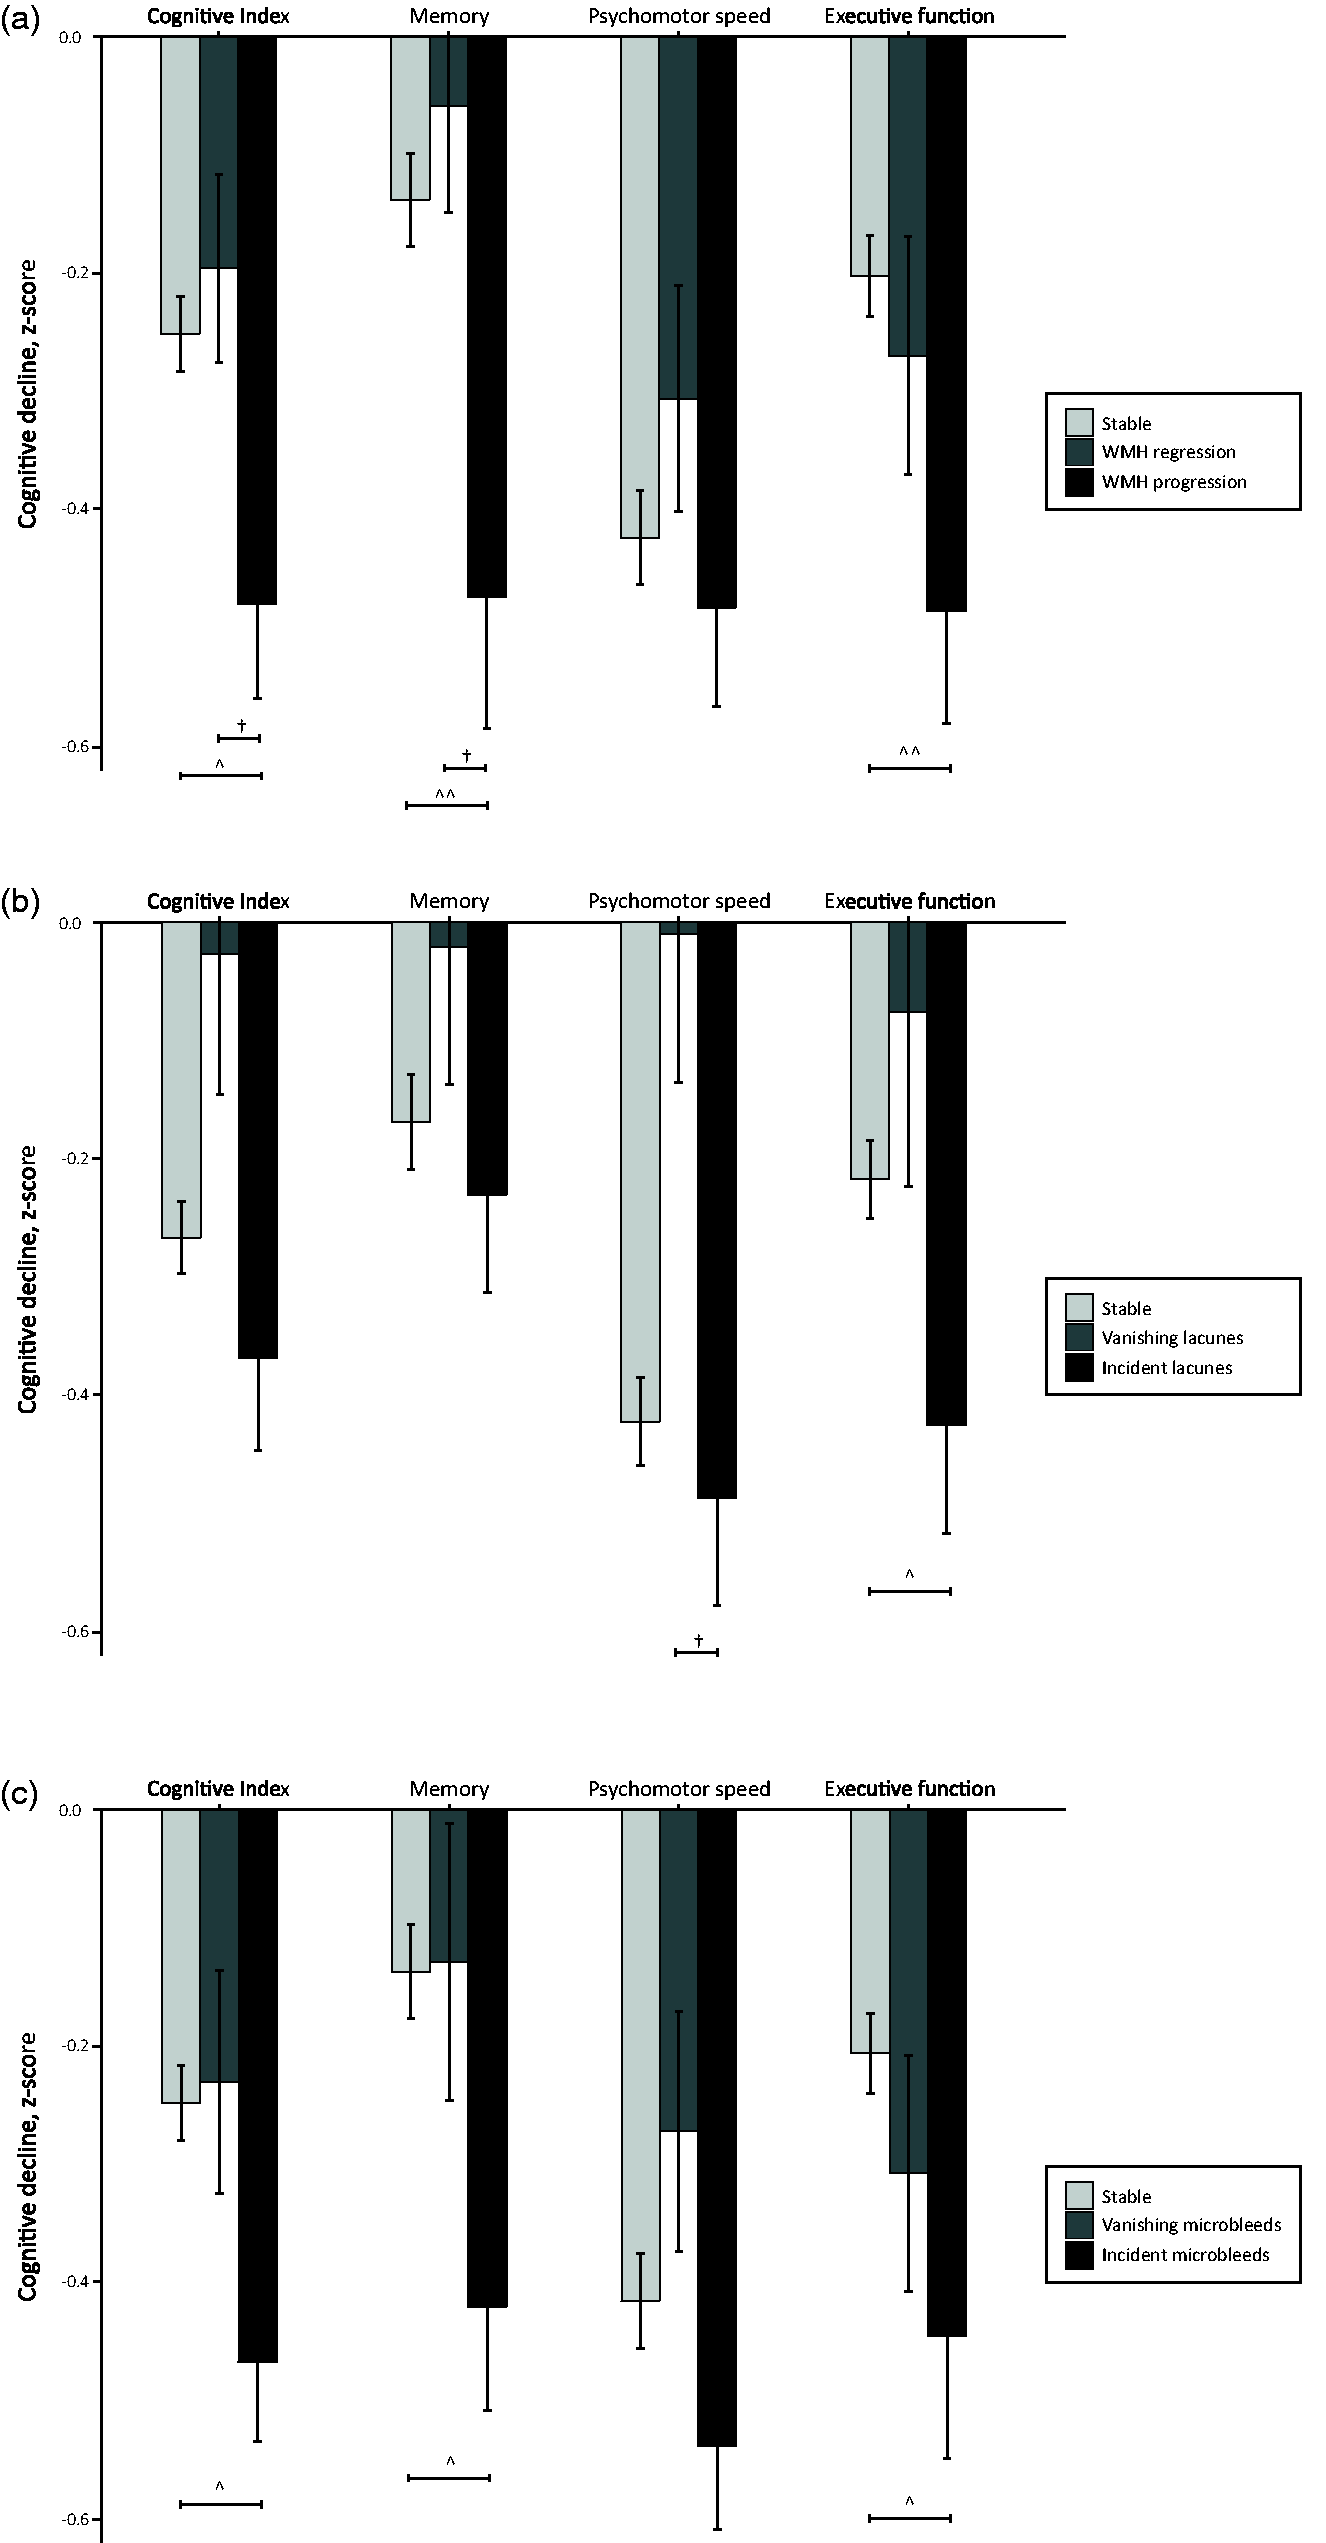
Cognitive consequences of SVD regression. Cognitive decline per cognitive domain, separately for participants with stable, regression and progression of WMH (a); lacunes (b) and microbleeds (c). Bars represent mean decline in z-score with standard errors as whiskers. ^^^p<0.001, ^^p<0.01, ^p<0.05 progression versus stable SVD, unadjusted; †p<0.05 regression versus stable SVD, unadjusted. Significance was lost after adjustments for age and sex.
Loss of total brain, gray matter and white matter volume did not differ between participants with SVD regression and stable SVD (Table 1), while participants with SVD progression showed more volume loss of total brain (mean difference –11.9 (–21.1,–2.8); p = 0.006) and gray matter (–6.7 (–13.1,–0.20); p = 0.041) compared to those with stable SVD, although significance disappeared after adjustments.
Regression of SVD markers and accompanying brain atrophy.
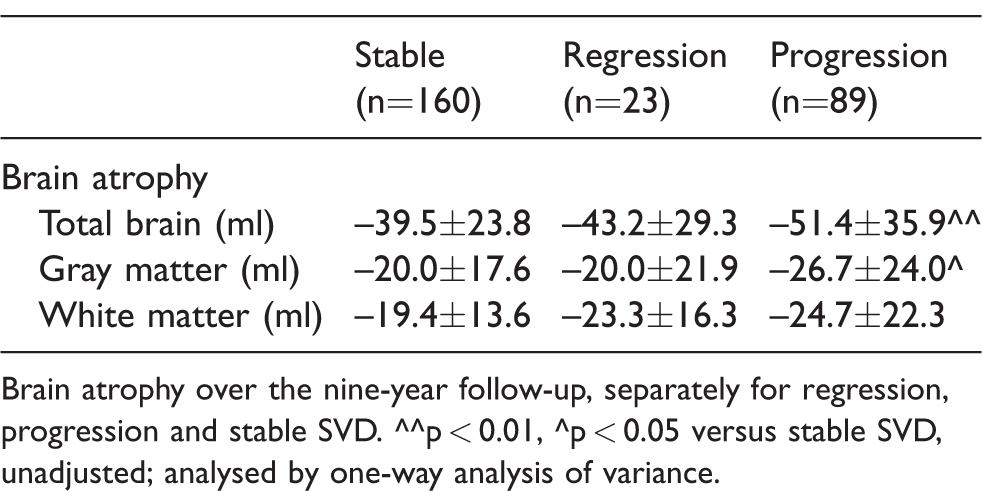
Brain atrophy over the nine-year follow-up, separately for regression, progression and stable SVD. ^^p < 0.01, ^p < 0.05 versus stable SVD, unadjusted; analysed by one-way analysis of variance.
Discussion
Regression of SVD markers occurred in a fifth of participants, who showed similar cognitive decline compared to participants with stable SVD. In addition, SVD regression did not accompany brain atrophy.
WMH regression has been related to fewer recurrent cerebrovascular events, 5 but its associations with cognitive performance have not been investigated. We had two hypotheses on how SVD regression might affect cognitive outcome. 4 First, SVD regression might accompany brain atrophy and thereby lead to impaired clinical outcome. This hypothesis is less likely, since both brain atrophy and cognitive decline in participants with SVD regression were comparable to stable SVD. Second, SVD regression might reflect resolution of transient white matter damage and thereby account for recovery of clinical symptoms.4,8Our observations of comparable cognitive decline between participants with regression and stable SVD support the second hypothesis. Of note, is that differences lost significance after adjustments, possibly due to reduced statistical power in relatively small groups. Our results should thus be interpreted with caution and require verification in larger studies.
Since SVD and its progression has been recognised as the most important vascular contributor to the development of cognitive decline and dementia, regression of SVD might, in theory, delay the rate of cognitive decline or the conversion to dementia. However, although some participants showed regression of SVD markers over time, the underlying microvascular pathology has probably not disappeared. Rather, the underlying pathology may progress without visible vascular lesions on neuroimaging, which might explain the absence of significant differences in cognitive decline after adjustments between participants with stable, progression or regression of SVD. Conversely, compensatory mechanisms may be responsible for a slowing in decline of cognitive performance, despite exponential increase of SVD. 11
Our findings might have clinical implications, as they suggest that future therapeutic strategies targeting vascular contributions to dementia may be particularly interested in regression of SVD. Previously observed associations between blood pressure reduction and WMH regression 5 suggest that anti-hypertensive treatments might lead to regression of SVD, though future intervention studies are required to assess the role of vascular risk factor control on SVD regression and recovery of clinical symptoms.
Strengths of this study include the long follow-up of participants with SVD and the use of neuroimaging assessments at three time-points. Study limitations include the possibility that regression of SVD markers might have a radiological explanation, for example by slight changes in neuroimaging protocols between baseline and first follow-up which might have led to an overestimation of WMH regression. 3 However, by taking into account the third MRI assessment and reslicing follow-up FLAIR to baseline images, we were able to capture most of this possible bias. Besides, due to the long-term follow-up, a considerable proportion of participants was not able to complete all follow-up assessments, reducing power in statistical analyses.
Conclusion
In conclusion, our findings of comparable cognitive decline between participants with regression and stable SVD might suggest that SVD regression has a relative benign cognitive outcome. Future studies are required to validate these findings and to assess the role of vascular risk factor control on SVD regression and possible recovery of clinical symptoms.
Supplemental Material
Supplemental material for Cognitive consequences of regression of cerebral small vessel disease
Supplemental Material for Cognitive consequences of regression of cerebral small vessel disease by Esther MC van Leijsen, Mayra I Bergkamp, Ingeborg WM van Uden, Sjacky Cooijmans, Mohsen Ghafoorian, Helena M van der Holst, David G Norris, Roy PC Kessels, Bram Platel, Anil M Tuladhar and Frank-Erik de Leeuw in European Stroke Journal
Footnotes
Declaration of Conflicting Interests
The author(s) declared no potential conflicts of interest with respect to the research, authorship, and/or publication of this article.
Funding
The author(s) disclosed receipt of the following financial support for the research, authorship, and/or publication of this article: AMT was supported by the Dutch Heart Foundation junior staff member grant (2016 T044); FEdL was supported by the Dutch Heart Foundation clinical established investigator grant (2014 T060); ZonMw VIDI (016.126.351).
Ethical approval
The Medical Review Ethics Committee region Arnhem-Nijmegen approved the study.
Informed consent
All participants gave written informed consent.
Guarantor
FEdL.
Contributorship
EMCvL and SC researched literature and conceived the study. EMCvL, MIB, IWMvU, SC and HMvdH were involved in patient recruitment and data analysis. EMCvL, SC, MG, DGN, RPCK, BP, AMT and FEdL made a substantial contribution to the analysis or interpretation of data. EMCvL wrote the first draft of the manuscript. All authors revised the article critically for important intellectual content. FEdL was involved in protocol development and gaining ethical approval and funding for the study. All authors reviewed and edited the manuscript and approved the final version of the manuscript.
Acknowledgements
Not applicable.
References
Supplementary Material
Please find the following supplemental material available below.
For Open Access articles published under a Creative Commons License, all supplemental material carries the same license as the article it is associated with.
For non-Open Access articles published, all supplemental material carries a non-exclusive license, and permission requests for re-use of supplemental material or any part of supplemental material shall be sent directly to the copyright owner as specified in the copyright notice associated with the article.