
Abstract
Background
A structural magnetic resonance imaging measure of combined neurovascular and neurodegenerative burden may be useful as these features often coexist in older people, stroke and dementia.
Aim
We aimed to develop a new automated approach for quantifying visible brain injury from small vessel disease and brain atrophy in a single measure, the brain health index.
Materials and methods
We computed brain health index in N = 288 participants using voxel-based Gaussian mixture model cluster analysis of T1, T2, T2*, and FLAIR magnetic resonance imaging. We tested brain health index against a validated total small vessel disease visual score and white matter hyperintensity volumes in two patient groups (minor stroke, N = 157; lupus, N = 51) and against measures of brain atrophy in healthy participants (N = 80) using multiple regression. We evaluated associations with Addenbrooke’s Cognitive Exam Revised in patients and with reaction time in healthy participants.
Results
The brain health index (standard beta = 0.20–0.59, P < 0.05) was significantly and more strongly associated with Addenbrooke’s Cognitive Exam Revised, including at one year follow-up, than white matter hyperintensity volume (standard beta = 0.04–0.08, P > 0.05) and small vessel disease score (standard beta = 0.02–0.27, P > 0.05) alone in both patient groups. Further, the brain health index (standard beta = 0.57–0.59, P < 0.05) was more strongly associated with reaction time than measures of brain atrophy alone (standard beta = 0.04–0.13, P > 0.05) in healthy participants.
Conclusions
The brain health index is a new image analysis approach that may usefully capture combined visible brain damage in large-scale studies of ageing, neurovascular and neurodegenerative disease.
Keywords
Introduction
Cerebral small vessel disease (SVD) features and brain tissue atrophy both increase with age, are often present together, and are risk factors for stroke and dementia.1–3 The importance of vascular disease on accelerating neurodegenerative pathologies and cognitive decline has recently been recognized,3,4 emphasizing the need for an inclusive approach to assessing common brain disorders of ageing.
A clinical total SVD score has recently been proposed and correlated with vascular risk factors and cognition in mild stroke and community-dwelling older adults >70 years.5,6 This score has a maximum level of four and does not include tissue atrophy, as atrophy did not improve the score’s performance in some studies.5,6 Yet brain atrophy is a major risk factor for, and correlate of, functional and cognitive decline.2,7
Many automated tissue quantification tools have been developed to assess differences and changes in brain volumes across age and disease, e.g. FMRIB software library (FSL), statistical parametric mapping (SPM), and atropos.8–10 However, these tools often misclassify ischaemic stroke lesions as normal appearing grey matter (GM), white matter hyperintensities (WMH), or cerebrospinal fluid (CSF). 11 This means that existing tissue quantification tools may not be suitable for older participants or stroke patients who may have ischaemic stroke lesions, or require manual editing to correct GM, WMH, and CSF volumes.12,13
Aims and hypothesis
In the present work, we aimed to extend the promise shown by a holistic clinical measure of vascular brain damage 5 and develop a holistic image processing measure of atrophy and SVD that can be applied without manual identification of ischaemic lesions. We thus describe the development of an automated composite measure of whole brain tissue atrophy, ischaemia, and SVD burden: the “Brain Health Index” (BHI). We hypothesize that BHI will perform well compared with existing clinical and quantitative measures of atrophy and SVD.
Material and methods
Approvals and patient consents
The contributing studies were approved by Lothian Research Ethics (09/81101/54 and 05/S1104/45) and South-East Scotland Research Ethics (14/SS/0003) and were conducted according to the Declaration of Helsinki. All participants provided written informed consent.
Mild stroke patients
One hundred and fifty-seven patients were recruited consecutively as part of a wider study of N = 264 patients who presented to hospital with mild (National Institutes of Neurological Disorders and Stroke (NIHSS) scale <7) or non-disabling lacunar/cortical ischemic stroke as diagnosed by an expert stroke physician. 11 This subset of N = 157 patients was used because it provided full brain MRI, vascular risk factors, and cognitive test data at baseline and one year, i.e. those who returned for follow-up. Full recruitment and assessment procedures for these subjects were described previously. 11
Systemic lupus erythematosus patients
Fifty-one patients with SLE, representing a range of disease severity and duration, were prospectively recruited as consecutively as possible from regional specialist clinics between April 2014 and December 2014. SLE was diagnosed by expert rheumatologists according to the American College of Rheumatology 1997; this diagnosis and full patient recruitment and assessment procedures were described previously.14,15
Healthy participants
Eighty clinically normal, healthy working age (25–65 years) volunteers were recruited (without financial or other incentive) from staff at The University of Edinburgh, the Western General Hospital and Royal Infirmary, Edinburgh, Scotland by advertisements. Health status was assessed using medical questionnaires and all structural MRI scans were reported by a consultant neuroradiologist as described previously. 16
Brain MRI acquisition
Brain MRI acquisition parameters were broadly the same across all participant groups and have been described in detail previously.11,14,16,17
The brain health index
The BHI is computed automatically in a relatively simple manner using Gaussian mixture model clustering of four co-registered, routinely collected structural brain MRI sequences: T1, T2, T2*, and FLAIR. Affine 12 point registration was used to align within-subject images to their native T2 space. 18 Intracranial volume (ICV) masks were estimated with T2* using the brain extraction tool (BET). 19 The contrast between CSF (bright) and skull (dark) on T2* provides optimal BET results 13 ; however, this can leave a dark rim of skull around the brain. We addressed this by converting the T2* image to z-scores 20 and thresholding at −1 standard deviation (SD) to remove the skull rim. ICV masks were visually inspected and manually edited if necessary.
BHI uses Gaussian mixture model cluster analysis to group intracranial voxels into two classes based on their intensities in each of the four sequences: (1) probably normal brain tissue; and (2) probably abnormal tissue or cerebrospinal fluid (Figure 1). The four sequences are overlaid within each subject to give each point within the intracranial space (voxel) four values (one from each sequence) that contribute to the cluster analysis. BHI – using the expectation-maximization (EM) algorithm – computes posterior probabilities of belonging to a particular cluster (“healthy” versus “abnormal”/CSF) based on the four intensities (one from each sequence) present in each voxel. Using the initially calculated posterior probabilities as weights, the algorithm estimates the cluster means, covariance matrices, and mixing proportions by applying maximum likelihood until convergence. Convergence is reached when the distance between each voxel and the multi-variate cluster mean is minimized. For example, hyperintense (e.g. ventricles, sulci, WMH, focal infarcts, lacunes, PVS) and hypointense (e.g. microbleed) voxels on T2- and T2*-based sequences, and hypointense voxels on T1-based sequences (e.g. ventricles, sulci, lacunes) are classed into a single cluster of probable “pathological” or cerebrospinal fluid voxels within each subject. The remaining voxels constitute probable “healthy” brain tissue within each subject, i.e. isointense voxels that likely do not represent features of SVD or cerebrospinal fluid (Figure 1).
Flow diagram of the brain health index (BHI) method. Blue areas in the “healthy” tissue masks (middle bottom panel) indicate probable normal/ “healthy” appearing tissue, areas without overlay colour are more likely “pathological” tissue or cerebrospinal fluid. BHI masks are from three separate subjects showing exclusion of cortical stroke (Cort Strk – left mask), white matter hyperintensities (WMH) and atrophy (WMH+atr – middle mask), and a lacune/ WMH (Lac/WMH – right mask) from “healthy tissue”. FLAIR/ FL: fluid attenuated inversion recovery; sbj: subject; V: voxel in BHI mask; n: number of voxels in BHI mask; i: voxel at a given location x,y,z in BHI mask.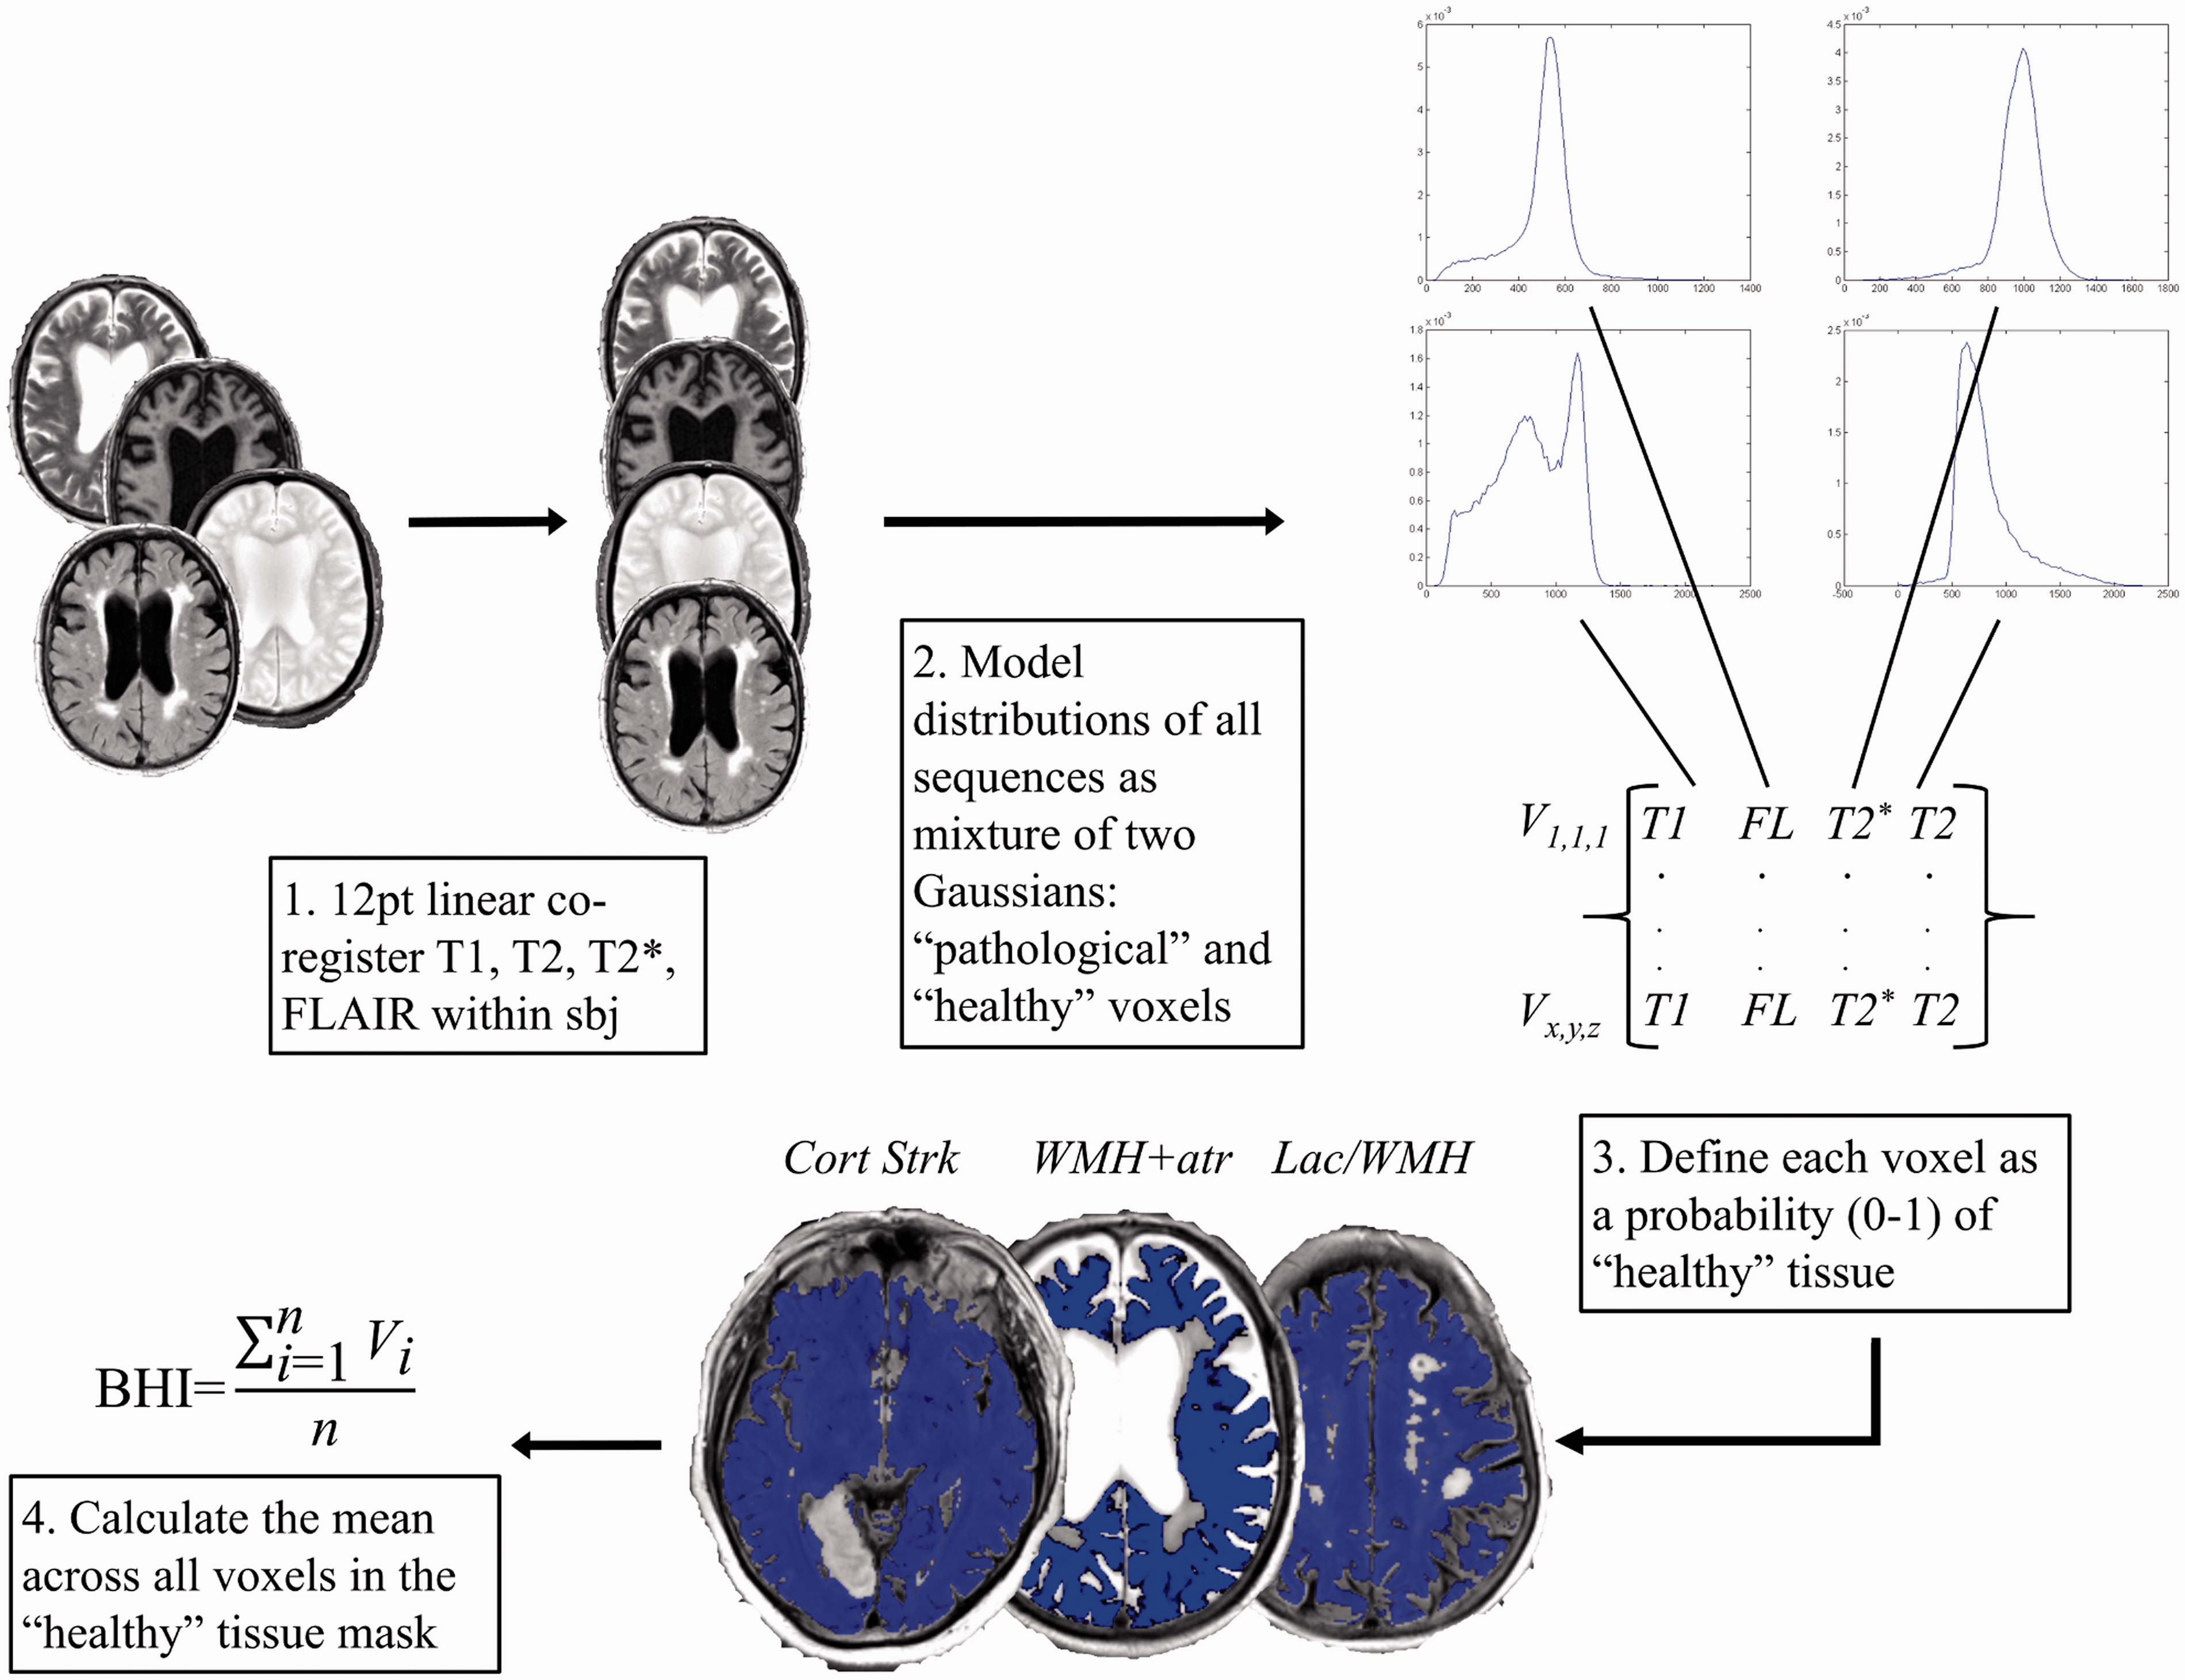
The initial result of BHI is a 3D mask image of the intracranial contents where each voxel contains a probability of containing “healthy” brain tissue; the final BHI measure for each subject is the mean value of these probabilities where values closest to one (100%) are “healthiest.”
SVD scores and brain tissue volumes
Brain MRI visual rating was performed in stroke by trained neuroradiologists and by image analysts supervised by a consultant neuroradiologist in SLE patients according to previously published methods.7,21–25 Inter-rater differences were limited. 11 We calculated the total SVD score using a recently validated and published method.5,6 WMH were quantified semi-automatically and normalized by ICV in stroke and SLE patients using a previously described and validated method consistent with STRIVE guidelines.17,26 Normal appearing grey, white, and whole brain tissue volumes were quantified in healthy participants using an optimized automated segmentation method. 27
Vascular risk factors
Vascular risk factors were assessed in stroke and SLE patients, including hypertension, hyperlipidaemia, diabetes, smoking, and systolic and diastolic blood pressure measured at the same time point as brain MRI. Healthy participants did not have any history of vascular disorders and did not provide measurements.
Cognitive testing
We administered the Addenbrooke’s Cognitive Examination Revised (ACER), 28 a test of cognitive impairment often used in stroke patients, 29 at the same time point as brain MRI in SLE patients and at one month and one year post-stroke in stroke patients. We measured four choice reaction time, a sensitive measure of cognitive ageing, 30 in healthy participants.
Statistical analyses
All statistical analyses were performed using Matrix Laboratory (MATLAB) Statistics and Machine Learning Toolbox R2014a (© 1994–2014 The MathWorks, Inc.). We used multiple regression with standardized beta (a commonly used technique where data with varying units, i.e. clinical scores versus tissue volumes, are converted to z-scores 20 ) to determine the imaging metric with the strongest association with cognitive performance, identifying the metric with the largest standardized beta and the lowest P-value as having the highest relative importance among competing metrics. 31
We specified ACER as the dependent variable and included WMH volume, total SVD score, and BHI as predictor variables in patient groups. We specified reaction time as the dependent variable and included GM, WM, and BHI as predictor variables in healthy participants. In a separate model, we again specified reaction time as the dependent variable and included whole brain volume (i.e. roughly gray + white matter volume) and BHI as predictor variables in healthy participants. Finally, we repeated all models while adjusting for age.
Results
Participants
Patient and healthy participant characteristics
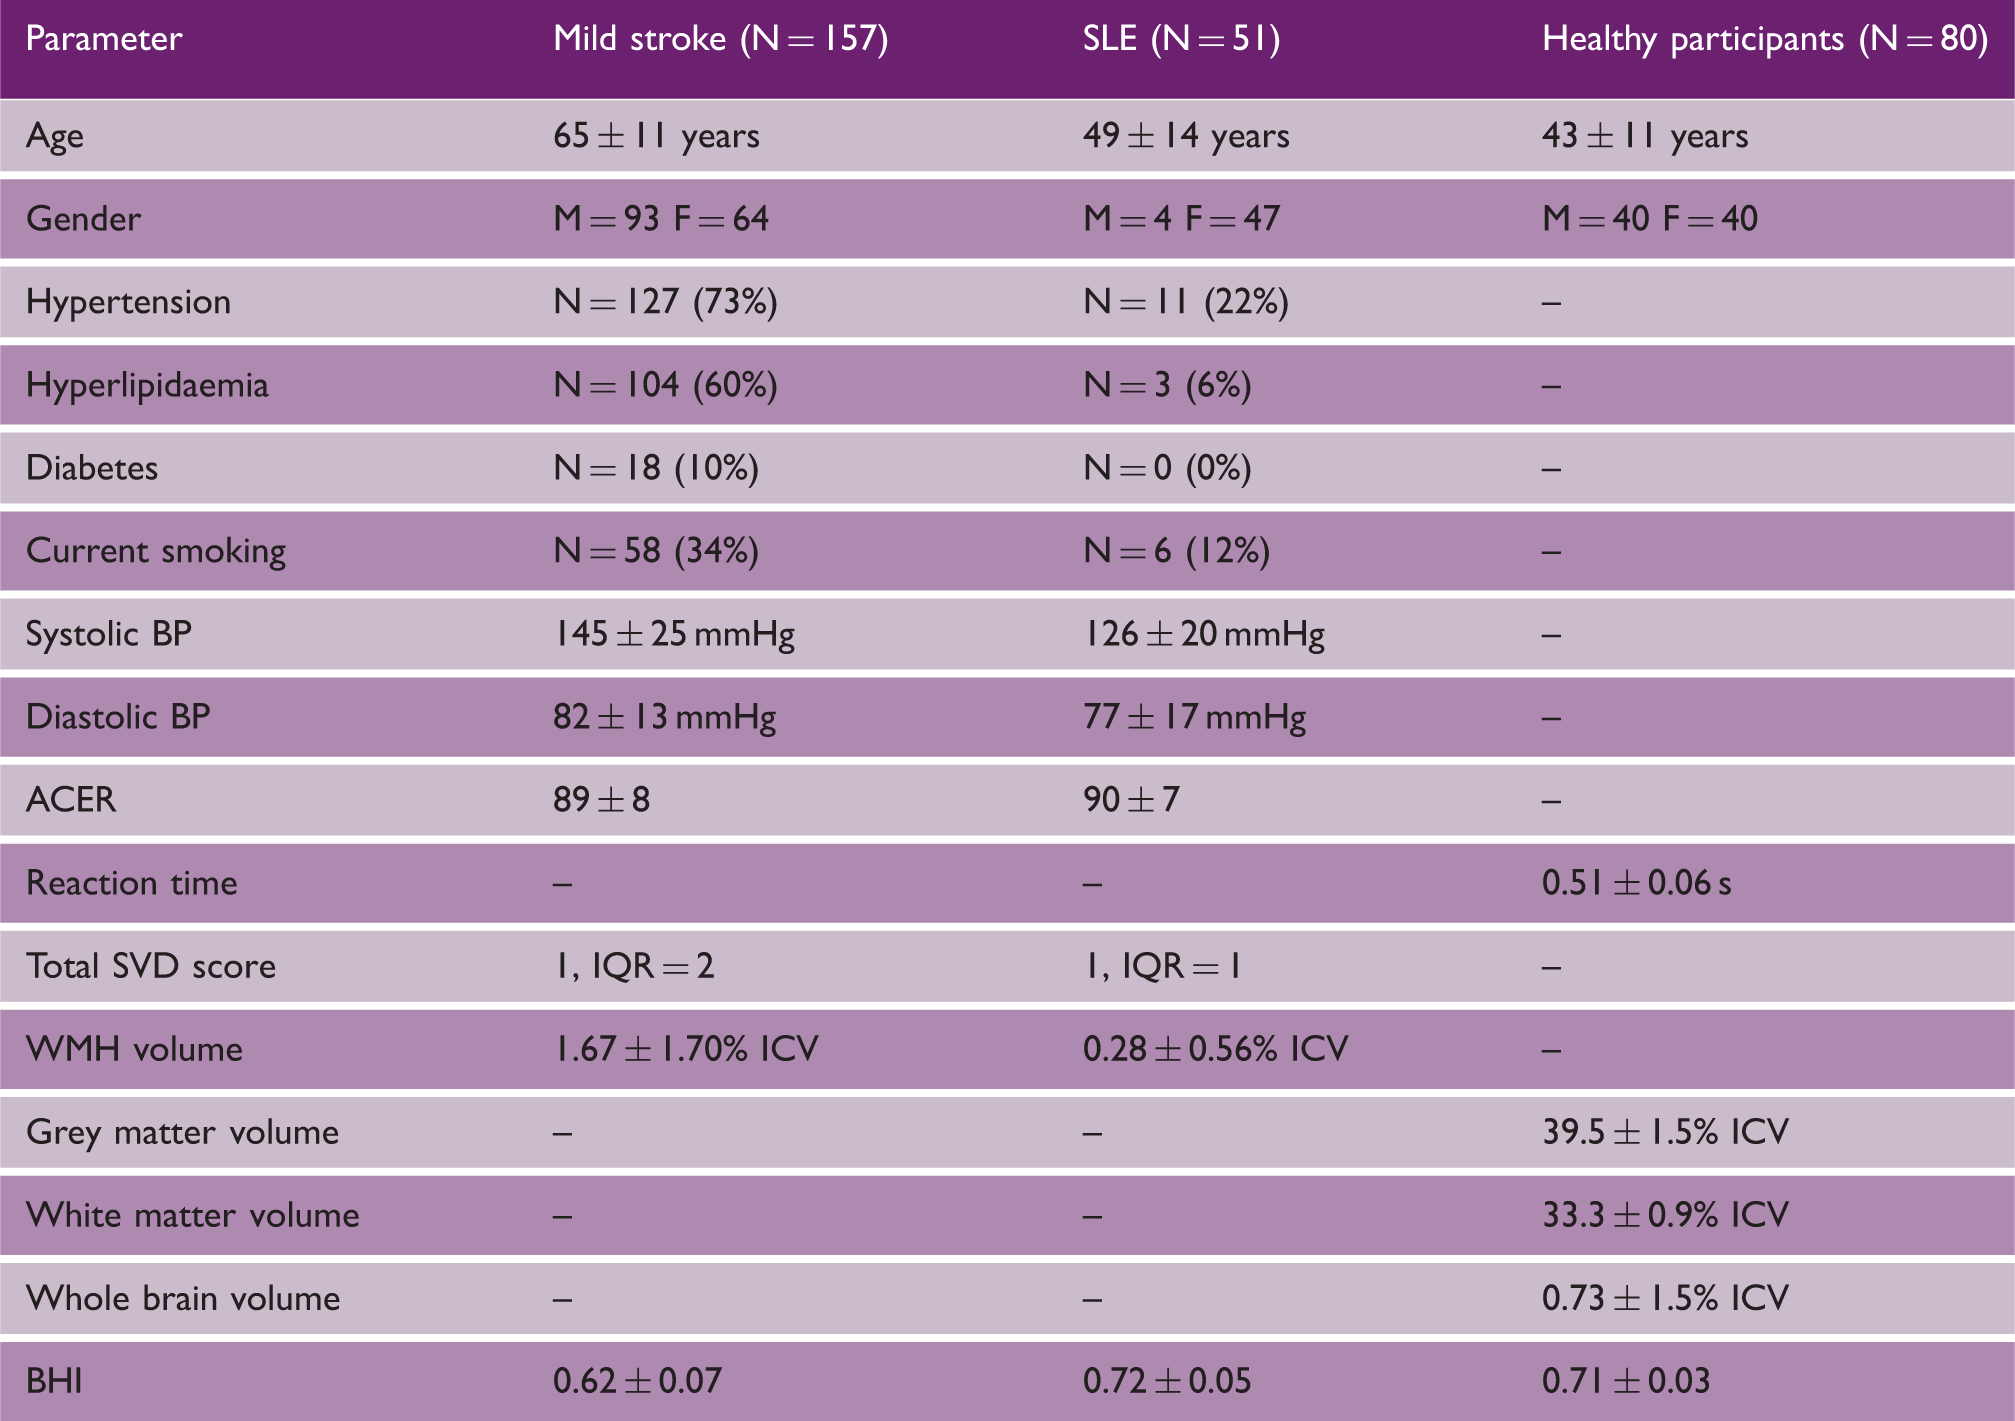
Note: – data unavailable (subjects with medical conditions were excluded).
SLE: systemic lupus erythematosus; BP: blood pressure; ACER: Addenbrooke’s Cognitive Exam Revised; SVD: small vessel disease; IQR: interquartile range; ICV: intracranial volume; WMH: white matter hyperintensity; BHI: brain health index.
Correlation between BHI and total SVD clinical score
There was a moderate negative correlation between the BHI and total SVD score (Spearman rho = −0.38, P < 0.001). A one unit increase in total SVD score was associated with a −0.02 (2%) reduction in BHI.
BHI in mild stroke and SLE patients
Multiple regression models comparing BHI, SVD score, and WMH volume as independent variables with ACER as dependent variable
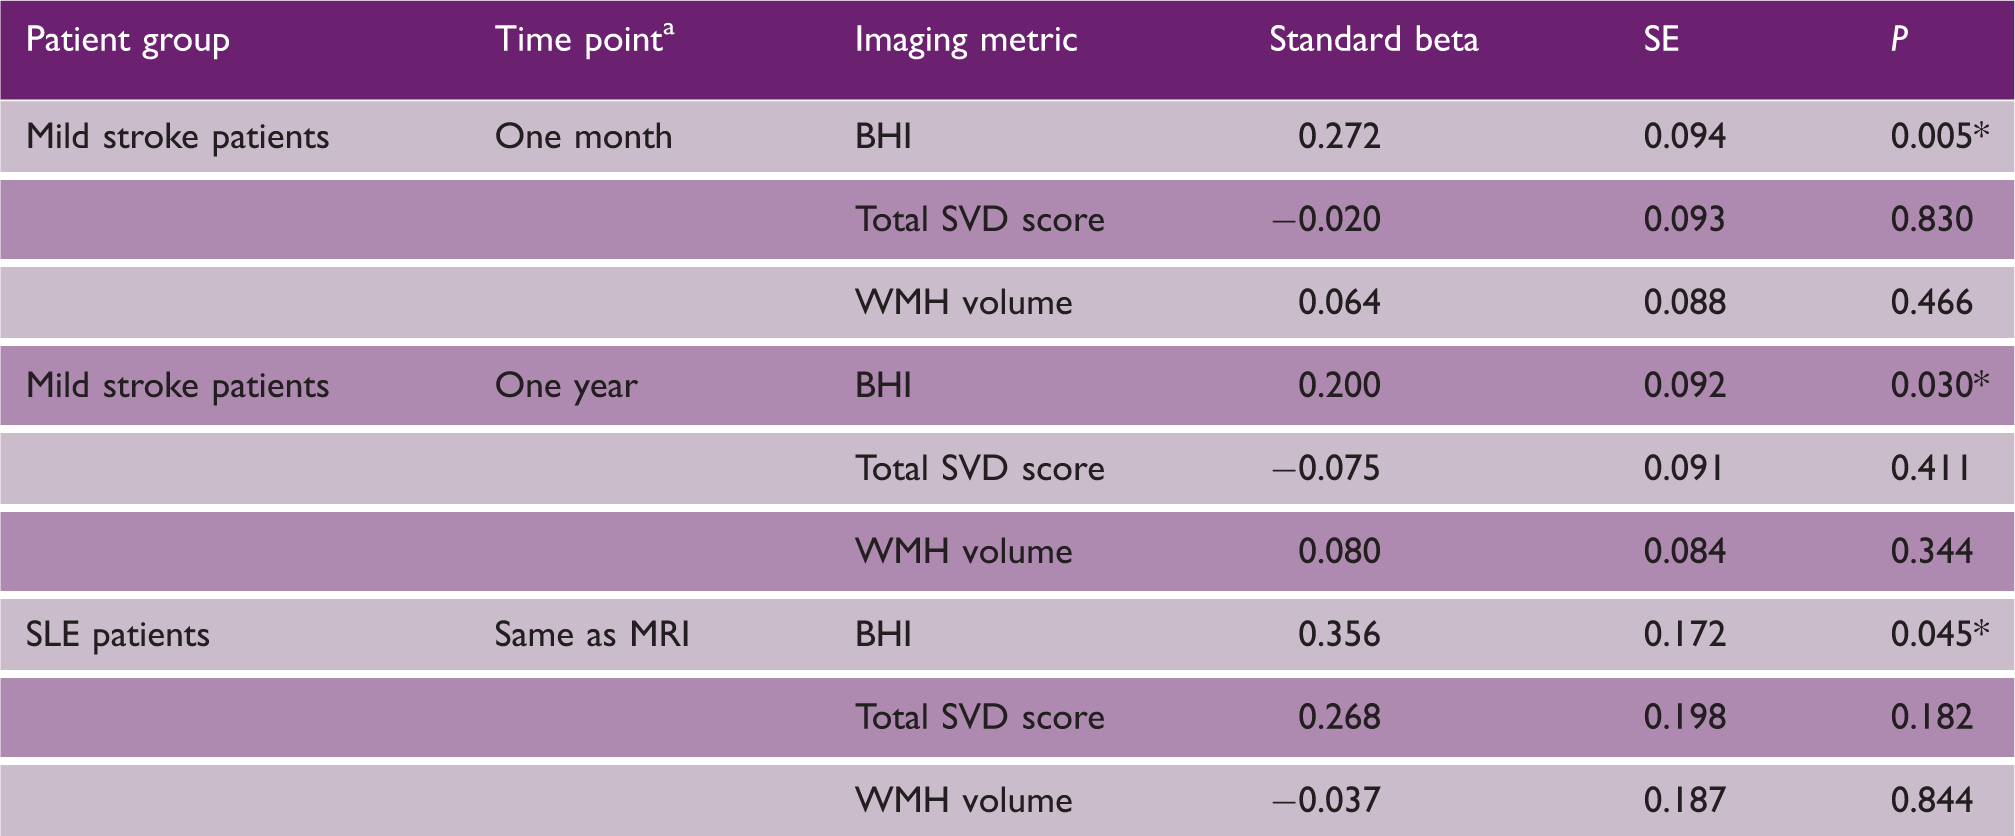
Time point for mild stroke patients is time after stroke; *P < 0.05.
SE: standard error; BHI: brain health index; SVD: small vessel disease; WMH: white matter hyperintensities; SLE: systemic lupus erythematosus.
BHI in healthy participants
Multiple regression models comparing BHI, grey matter, white matter, and whole brain volumes as independent variables with reaction time as dependent variable
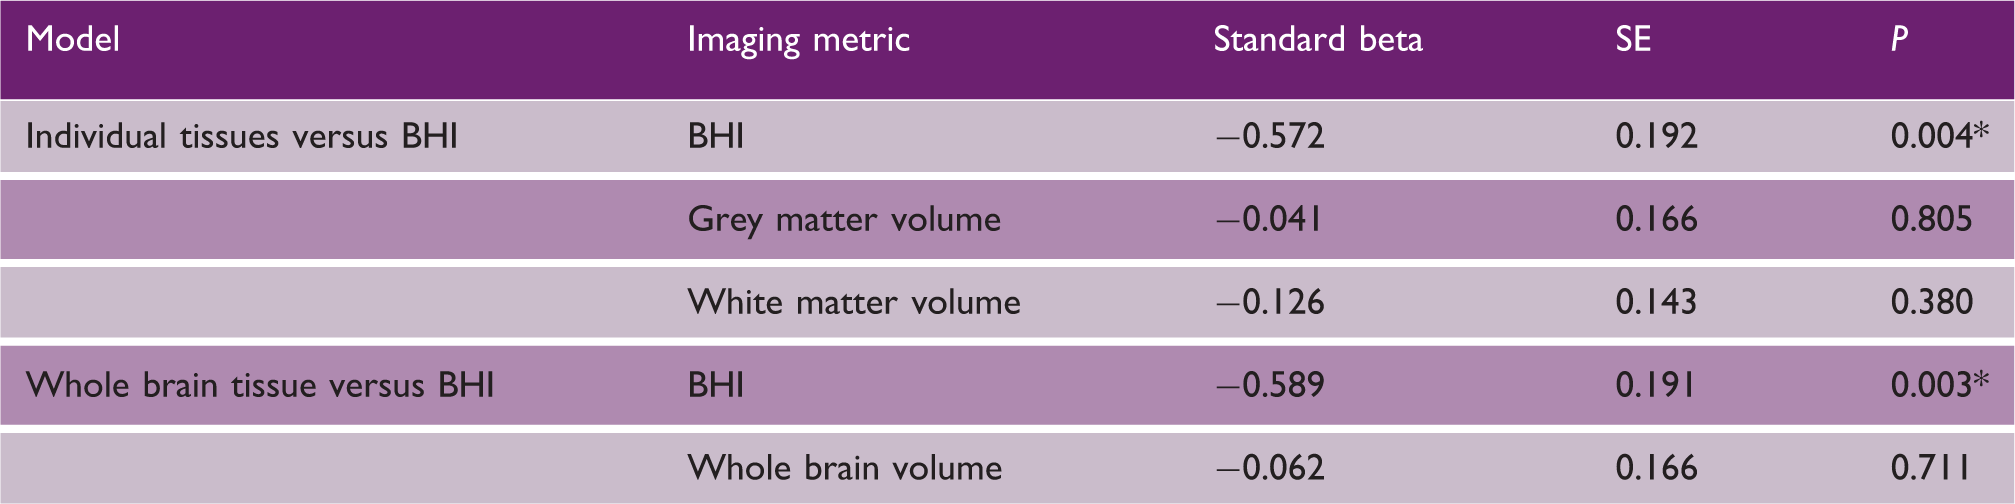
P < 0.05.
SE: standard error; BHI: brain health index.
Age adjusted analyses
Associations between BHI and ACER remained statistically significant in stroke patients (beta = 0.27, P = 0.003) but not in SLE patients (beta = 0.37, P = 0.09) after adjusting for age. The statistically significant association between reaction time and BHI remained after adjusting for age in healthy participants (beta = −0.32, P = 0.04).
Discussion
The BHI is a new automated approach for determining the combined effects of whole brain tissue atrophy and vascular disease in a single measure. It mirrored a recently validated combined SVD clinical rating score but was more strongly correlated with cognitive performance in three independent samples representative of a wide range of brain damage and clinical presentations.
The BHI compares favourably with existing qualitative and quantitative image analysis methods because: (1) it requires very limited labour time and manual intervention compared to WMH volumes which can take up to 1 h per subject 11 ; (2) the BHI is on a continuous scale versus clinical scales which often lack granularity; (3) the BHI assesses whole brain rather than tissue- or lesion-specific damage 31 ; and (4) the BHI was significantly and more strongly associated with cognitive function compared with the commonly used imaging metrics assessed here. The stronger associations with cognition may reflect the inclusion of brain atrophy, a marker of tissue loss secondary to vascular disease and to neurodegeneration, as well as the vascular lesions. For example, a participant with a large burden of WMH but little atrophy would limit correlations in atrophy only assessments, whereas a participant with little WMH and much atrophy would limit correlations in WMH only assessments. WMH and atrophy have been shown to correlate with cognition individually, 32 and combing them into a single measure may thus strengthen associations with cognition. Given the potential use of BHI, we will make the MATLAB executable code publicly available via our website (https://datashare.is.ed.ac.uk/) following wider compatibility testing on other operating systems and hardware.
Despite these strengths, there are limitations in this work. The BHI requires T1, T2, T2*, and FLAIR MRI to capture the full range of SVD and atrophy features and, in its current implementation, would likely provide unstable results if any of these four sequences were missing. However, all four of these sequences are commonly collected in SVD, ageing, and neurodegenerative studies and indeed are considered as standard in STRIVE guidelines.11,26,31,33 We used two Gaussians to cluster voxels as these provided the most stable results across subjects with a wide range of SVD features. There were some misclassifications of normal tissue as “unhealthy” at the grey/CSF boundary in BHI (Figure 1). Further work is required to determine dependency on image acquisition factors such as slice thickness or gap, or whether additional clusters, e.g. grades of isointense and hyperintense voxels, can be stabilized to improve classifications at tissue boundaries. Although we had a rich diversity of acquired data in three independent cohorts, the sample sizes (total N = 288) are relatively small compared to others.33,34 Stroke patients included here were those who returned for one-year follow-up. These patients are likely healthier than those who did not return and this limits the generalization of our results to all ischaemic strokes. However, this is a common problem in observational cohort studies 35 and there are limited solutions to address this problem. BHI was not significantly associated with ACER in SLE patients when adjusting for age; however, statistically significant associations remained in stroke patients and healthy participants. The small sample size in SLE patients may explain this attenuation (P was close to significance at 0.09). The assessment of BHI was mainly cross-sectional and further work is required in longitudinal imaging studies to determine the predictive utility of BHI.
Notwithstanding these limitations, we present the first results of a new, automated measure of whole brain damage in cerebrovascular disease. The BHI correlated more strongly with cognitive deficits commonly seen in stroke and SVD than a validated clinical scoring method and validated tissue volume processing methods. The BHI may therefore be a useful marker of brain damage in large-scale studies of cerebrovascular disease and should be tested more widely.
Footnotes
Declaration of conflicting interests
The author(s) declared no potential conflicts of interest with respect to the research, authorship, and/or publication of this article.
Funding
The author(s) disclosed receipt of the following financial support for the research, authorship, and/or publication of this article: Funding from the Stroke Association (DAD), Technology Strategy Board/ Innovate UK (46917-348146), Wellcome Trust (WT088134/Z/09/A), Row Fogo Charitable Trust, Lupus UK, National Institutes of Health (R01 EB004155-03), European Union Horizon 2020 PHC-03-15, project No 666881, SVDs@Target, and Fondation Leducq (Transatlantic Network of Excellence for the Study of Perivascular Spaces in Small Vessel Disease, ref no. 16 CVD 05) is gratefully acknowledged.