
Abstract
Introduction
We aimed to validate and compare two clinical prognostic models for mortality which include the National Institutes of Health Stroke Scale (NIHSS); the Age and NIHSS Score (ANS) and case mix model (CMM) of the Sentinel Stroke National Audit Program (SSNAP). The NIHSS on admission was also tested as a prognostic score.
Patients and methods
Prospectively collected data from the SSNAP register for a cohort of patients (ischaemic and haemorrhagic stroke) admitted over 1 year to Gloucestershire Royal Hospital, England were accessed. The ANS and CMM were calculated and tested for in hospital, 30-day and 90-day mortality using calibration plots with Hosmer–Lemeshow tests, receiver operating characteristics curves and other measures of prognostic accuracy.
Results
Of 848 patients, 110 (12.9%) died in hospital, 112 (13.2%) at 30 days and 164 (19.2%) at 90 days. Calibration for all three scores was good, although Hosmer–Lemeshow test p values were <0.05 with the NIHSS alone for in hospital and 30-day deaths, suggesting deviation from good fit. The c-statistics for in hospital, 30-day and 90-day mortality were ANS (0.783, 0.782, 0.779) and CMM (0.783, 0.774, 0.758), respectively. The NIHSS alone showed fair discrimination but performed less well. A NIHSS score ≥6 was associated with significant mortality (p < 0.0001) in comparison to a score <6.
Conclusion
A simple prognostic model containing age and admission NIHSS only, performed as well as a more complex score at predicting in hospital, 30-day and 90-day mortality. Admission NIHSS recording should be encouraged for stroke registries.
Introduction
Stroke is the third highest cause of death worldwide with a case fatality of 17–30% at 30 days in population based studies.1,2 Mortality in hospital and at 30 and 90 days are widely used outcomes in research and assessment of the quality of routine care. 3 Several prognostic models for mortality have been designed for clinical decision making, to aid the design and analysis of randomised trials and to allow for case mix adjusted comparisons between different cohorts of patients.4–6 Prognostic models should ideally be simple and based on easily collected variables.4,5 Some prognostic models have been criticised for lack of external validation and limited generalisability.4,5 Independent validation, ideally in several cohorts, is considered as an important step in the development of a truly useful model.5,6
The National Institutes of Health Stroke Scale (NIHSS) 7 is a component of some prognostic scores including the Get with the Guidelines–Stroke (GWTG-Stroke) risk model, 8 the Age and NIHSS prognostic score – model 2 (ANS), 9 Sentinel Stroke National Audit Program (SSNAP) case mix model – model A (CMM) 10 and the THRIVE score 11 derived from patients undergoing endovascular treatment. The ANS comprises age and NIHSS score within 6 h of onset and predicts 100 day mortality in ischaemic stroke patients admitted to acute stroke units in Germany. 9 It has been externally validated in German hospitals and in a dataset from clinical trials.12,13 It has not been tested in a cohort including primary intracerebral bleeds or for in hospital or 30-day mortality. Case mix models for standardised reporting of 30 day stroke mortality have been derived from data from SSNAP, the national register of acute stroke in England and Wales. 10 The CMM contains age, NIHSS, presence of AF and stroke type (ischaemic or primary haemorrhage). 10 The model has been externally, but not independently, validated using a cohort of stroke patients in London. 10 It has not been validated for 90-day mortality. The ANS and CMM have not been compared for prognostic accuracy on the same dataset before. The NIHSS score alone has also been found to be useful in predicting in hospital deaths, 30-day mortality and poor outcomes at 90 days (either death or nursing home residence).8,14,15
This study aimed to independently validate the ANS and the CMM for the prediction of in hospital, 30-day and 90-day mortality in a cohort of patients (comprising ischaemic and haemorrhagic strokes) with prospectively collected data. We also wished to compare the calibration, discrimination and other measures of prognostic accuracy of the two scores and NIHSS scores alone to determine their usefulness and identify the simplest model for our dataset.
Patients and methods
Study population and setting
All patients admitted to the stroke units of Gloucestershire Royal Hospital (GRH), Gloucester, England from 25 July 2015 to 25 July 2016 with a confirmed diagnosis of ischaemic stroke or primary intracerebral haemorrhage were included in the study. This 1 year time frame was chosen as it was the period after a major service reorganisation at our centre and we were confident of the completeness of NIHSS scoring in our dataset for this period. This time frame was also chosen to avoid the inclusion of any patients who may have been included in the derivation sample for the SSNAP CMM. Patients with a diagnosis of transient ischaemic attack (TIA) and stroke mimics were excluded.
Stroke was defined as ‘a clinically defined syndrome of rapidly developing symptoms or signs of focal loss of cerebral function with no apparent cause other than that of vascular origin with symptoms lasting more than 24 h or leading to death’. 16 All patients had imaging to aid the diagnosis and confirm the nature of the stroke. The stroke units at GRH consist of a 15 bed acute unit and a 44 bed rehabilitation stroke unit where patients are transferred from the acute unit typically within 72 h to 7 days of admission. The acute unit has facilities for continuous physiological monitoring and enhanced senior presence. The rehabilitation stroke unit is able to treat patients for up to several weeks depending on clinical need. The catchment area for GRH has a population of 560,000 of predominantly Caucasian origin. All stroke services for the county of Gloucestershire are centralised at GRH and includes a 24/7 thrombolysis service. Patients for thrombectomy are transferred to a tertiary centre, currently within office hours.
Prognostic models studied
The two prognostic models studied were the Age and NIHSS score prognostic model II (ANS) 9 and the case mix model – model A (CMM). 10
The ANS was calculated from age in years and NIHSS score on admission using the intercept and coefficients of the derivation logistic regression model.
9
Using the intercept −7.040 and regression coefficients 0.049 and 0.155,
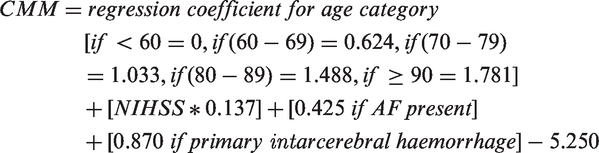
The CMM was derived from age (<60, 60–69, 70–79, 80–89, and ≥90 years), NIHSS on admission, presence of atrial fibrillation on admission, and stroke type (ischaemic or primary intracerebral haemorrhage).
10
Using the intercept and regression coefficients of the original regression model, the CMM was calculated as follows
Outcome events
The outcome events of interest were all cause death in hospital and all cause death within 30 and 90 days.
Data collection
Data were extracted from the SSNAP dataset 17 for GRH. This clinical audit programme collects a minimum dataset for stroke patients in England, Wales and Northern Ireland. Data are entered prospectively by stroke teams on all patients admitted to hospital with confirmed stroke using a secure web portal with prompts for data completeness and checks for accuracy. 17 Variables include demographic details, stroke phenotype, NIHSS score on admission (assessed by NIHSS certified clinicians as soon as possible after arrival), comorbidities, several processes of care, clinical outcomes including modified Rankin Scores (mRS) 18 and deaths by discharge. To ascertain death at 30 and 90 days (if after hospital discharge), the hospital ‘Infoflex’ database (Chamelion Information Management Services) was accessed. This database records details of all admissions to hospital, discharge summaries and death. The database directly records deaths in hospital and has robust links with general practices, county registration officers and funeral directors for capturing deaths occurring in the community. All patient identifiers were removed from the dataset before analysis. The study was exempt from ethical review and individual patient consent and had authorisation from the Health Research Authority, England.
Statistical analysis
Analysis included the calibration (observed versus predicted event rates for groups of patients) of the two prognostic scores for in hospital, 30-day and 90-day mortality using calibration plots along with the Hosmer–Lemeshow test of goodness of fit. 19 Discrimination (how well they distinguished between patients who did or did not have the outcome event) of the two scores for in hospital, 30-day and 90-day mortality were assessed by receiver operating characteristics (ROC) curves with area under the curve (AUC or c-statistic). 19 The two c-statistics were compared for statistical significance using the non-parametric (two-sided) DeLong test.20,21 A sample size calculation for a single prognostic test using the R package pROC was performed.21,22 We determined optimal cut points for the prognostic scores using criteria based on sensitivity and specificity, the Youden Index. 23 Tests of prognostic accuracy including sensitivity and specificity were calculated. 24 As the total duration of follow-up was often more than 90 days, Kaplan–Meier plots were drawn for all deaths at the end of follow up stratified by the cut points and statistical significance assessed by the log rank test. Similar methods were used for the NIHSS score alone and the results compared with the two prognostic scores. The statistical software “R” was used for analysis. 25
Results
Baseline characteristics of the cohort (n = 848).
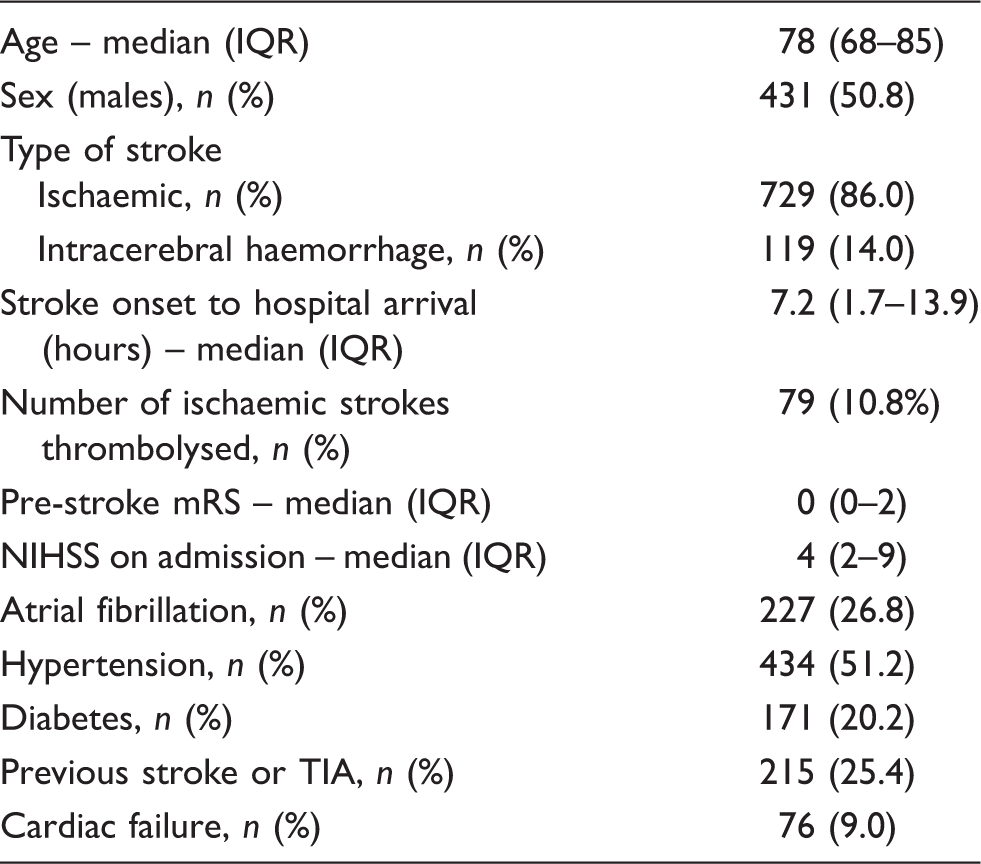
IQR: interquartile range; mRS: modified Rankin Scale; NIHSS: National Institutes of Health Stroke Scale; TIA: transient ischaemic attack.
Figure 1 shows calibration plots (predicted vs. observed deaths) for the ANS, CMM and NIHSS scores for in hospital, 30-day and 90-day mortality. Inspection of the plots show broadly similar calibration for the ANS and CMM scores with non-significant p values derived from the Hosmer–Lemeshow test (suggesting good calibration). The NIHSS score performed less well (p < 0.05) for in hospital and 30-day deaths, suggesting deviation from good fit for these time periods. The p value for the NIHSS score for deaths at 90 days, however, was non-significant. The p values for death in hospital were; ANS (p = 0.1454), CMM (p = 0.1552) and NIHSS (p = 0.0034). 30-day mortality; ANS (p = 0.27), CMM (p = 0.267) and NIHSS (p = 0.0055). 90-day mortality; ANS (p = 0.4842), CMM (p = 0.5488) and NIHSS (p = 0.186).
Calibration plots for the ANS, CMM and NIHSS scores for in hospital, 30-day and 90-day mortality.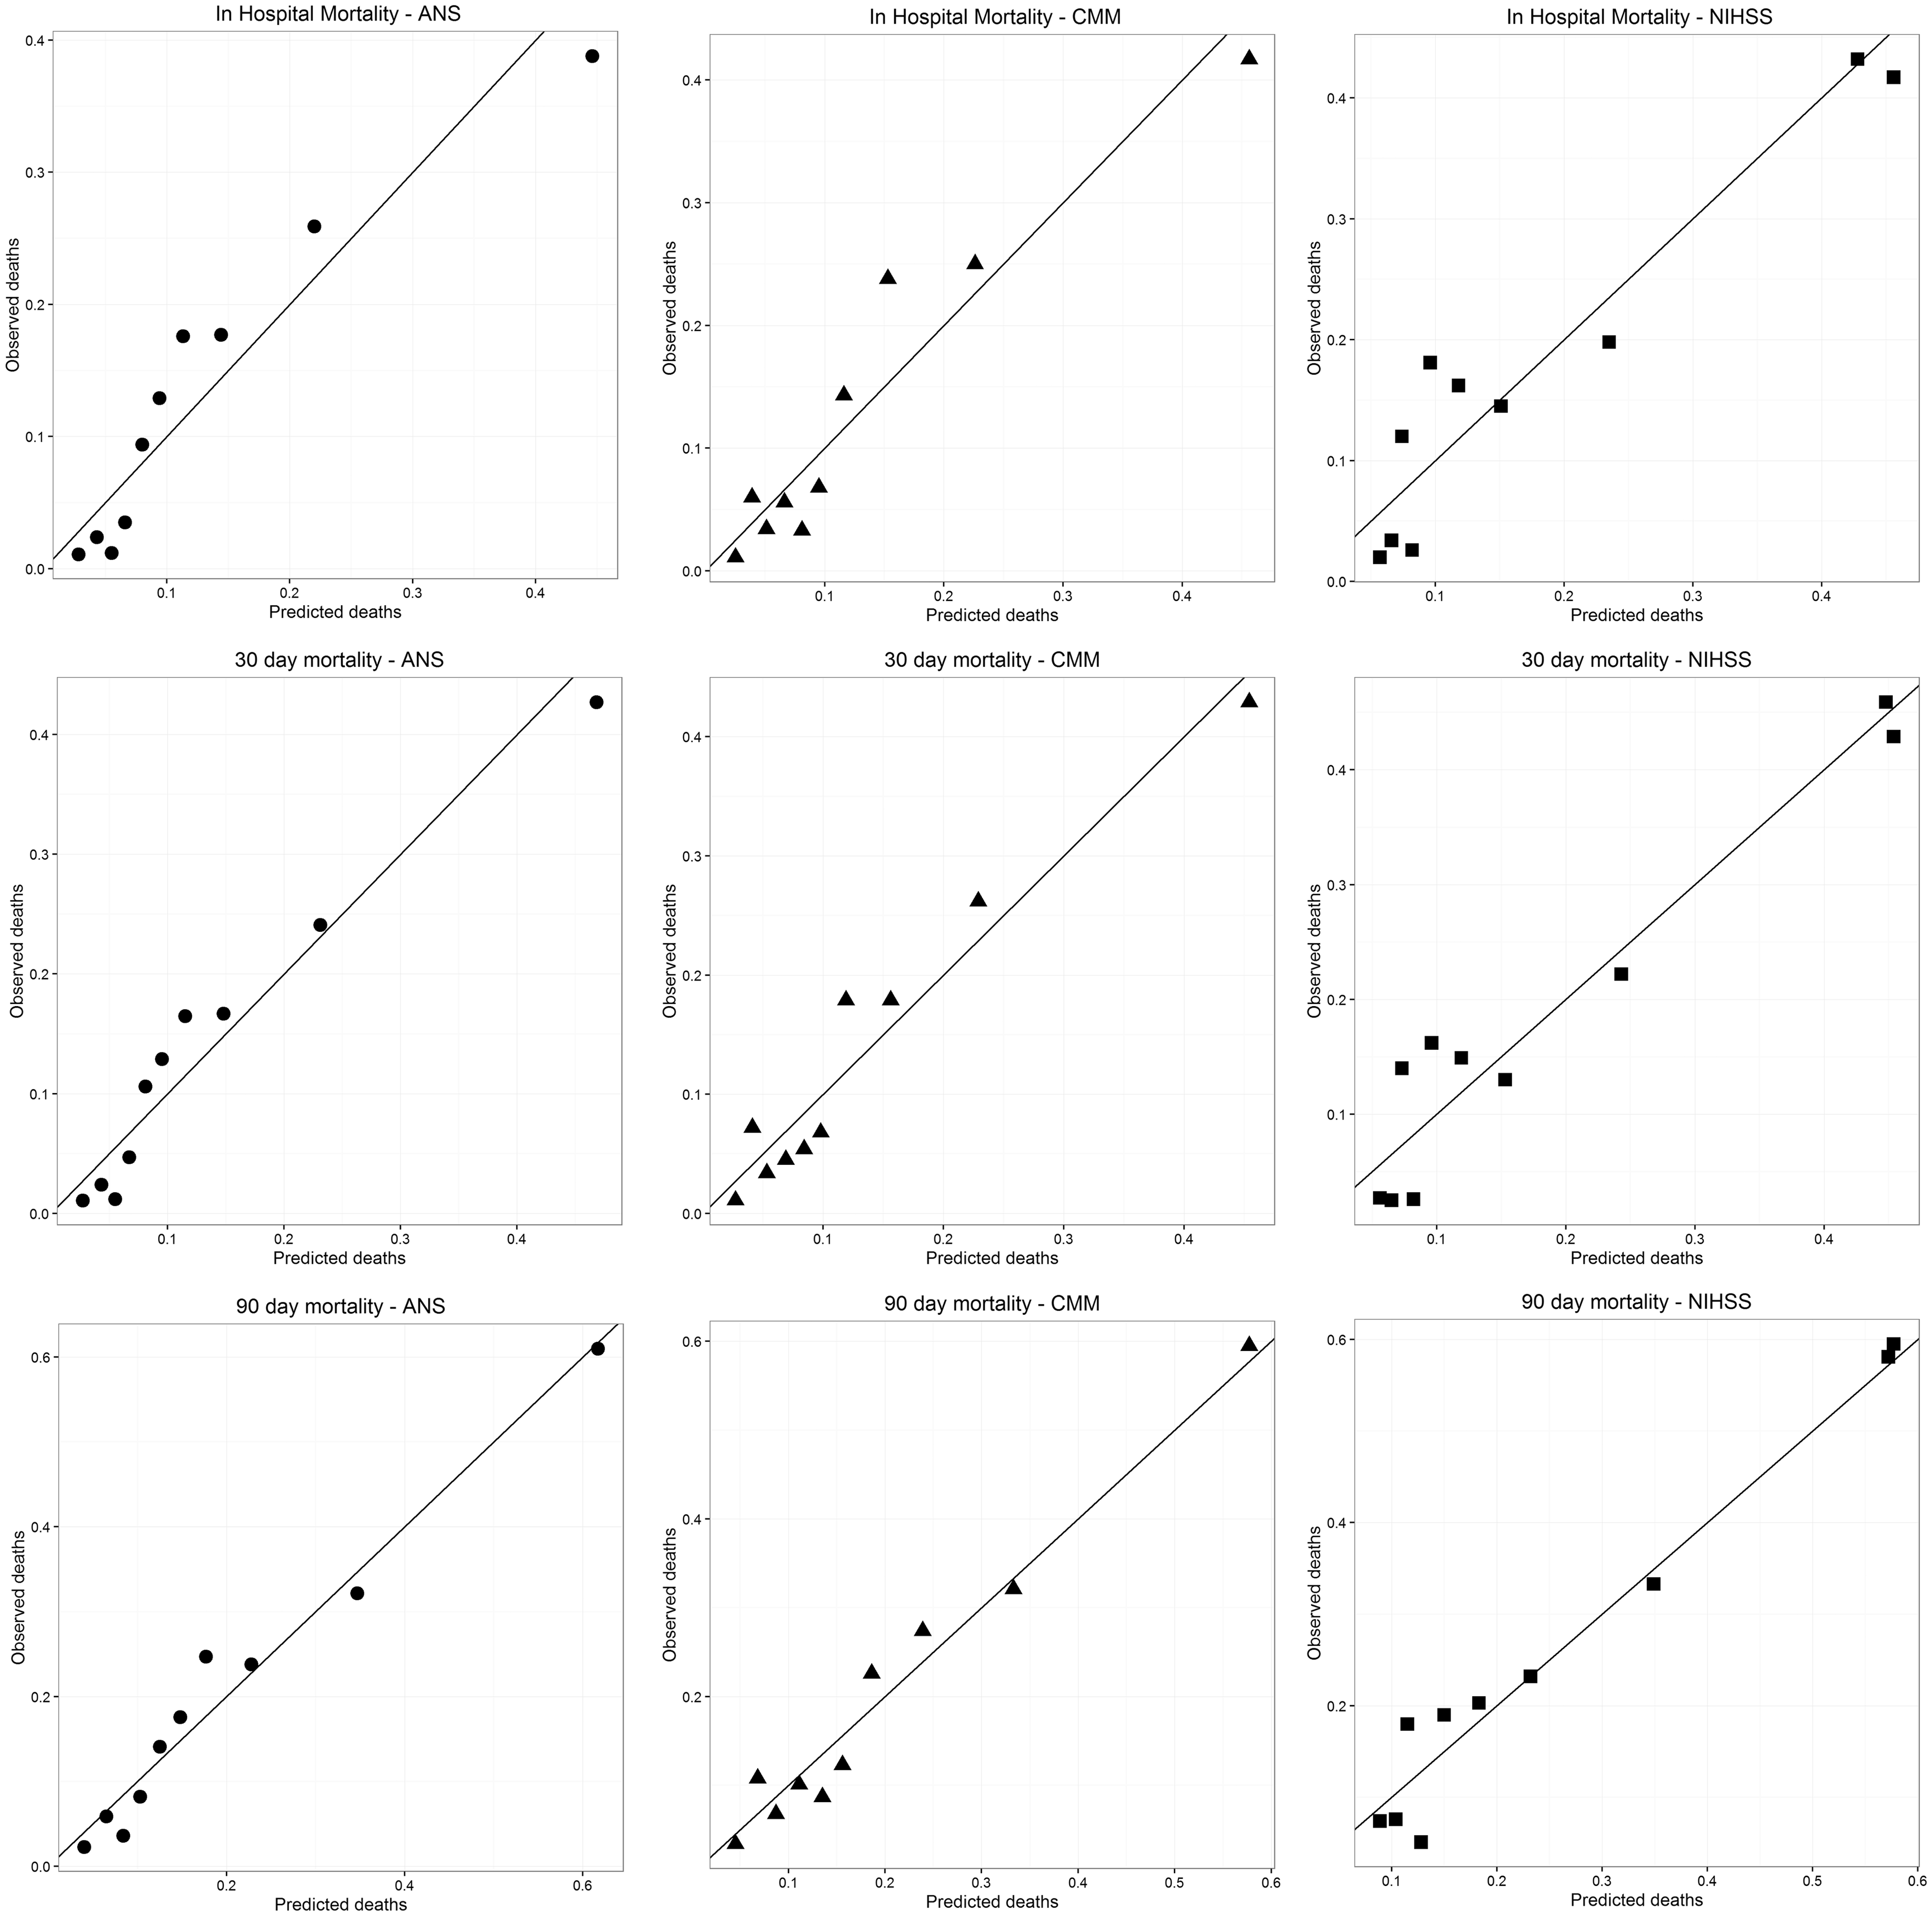
ROC curves and the AUC (c-statistics) with 95% CI are shown for the three scores in Figure 2. The best c-statistics were obtained for the ANS, 0.78 for in hospital, 30-day and 90-day deaths although the confidence intervals overlapped for the three scores. Significance tests for the difference in c-statistics using the DeLong
20
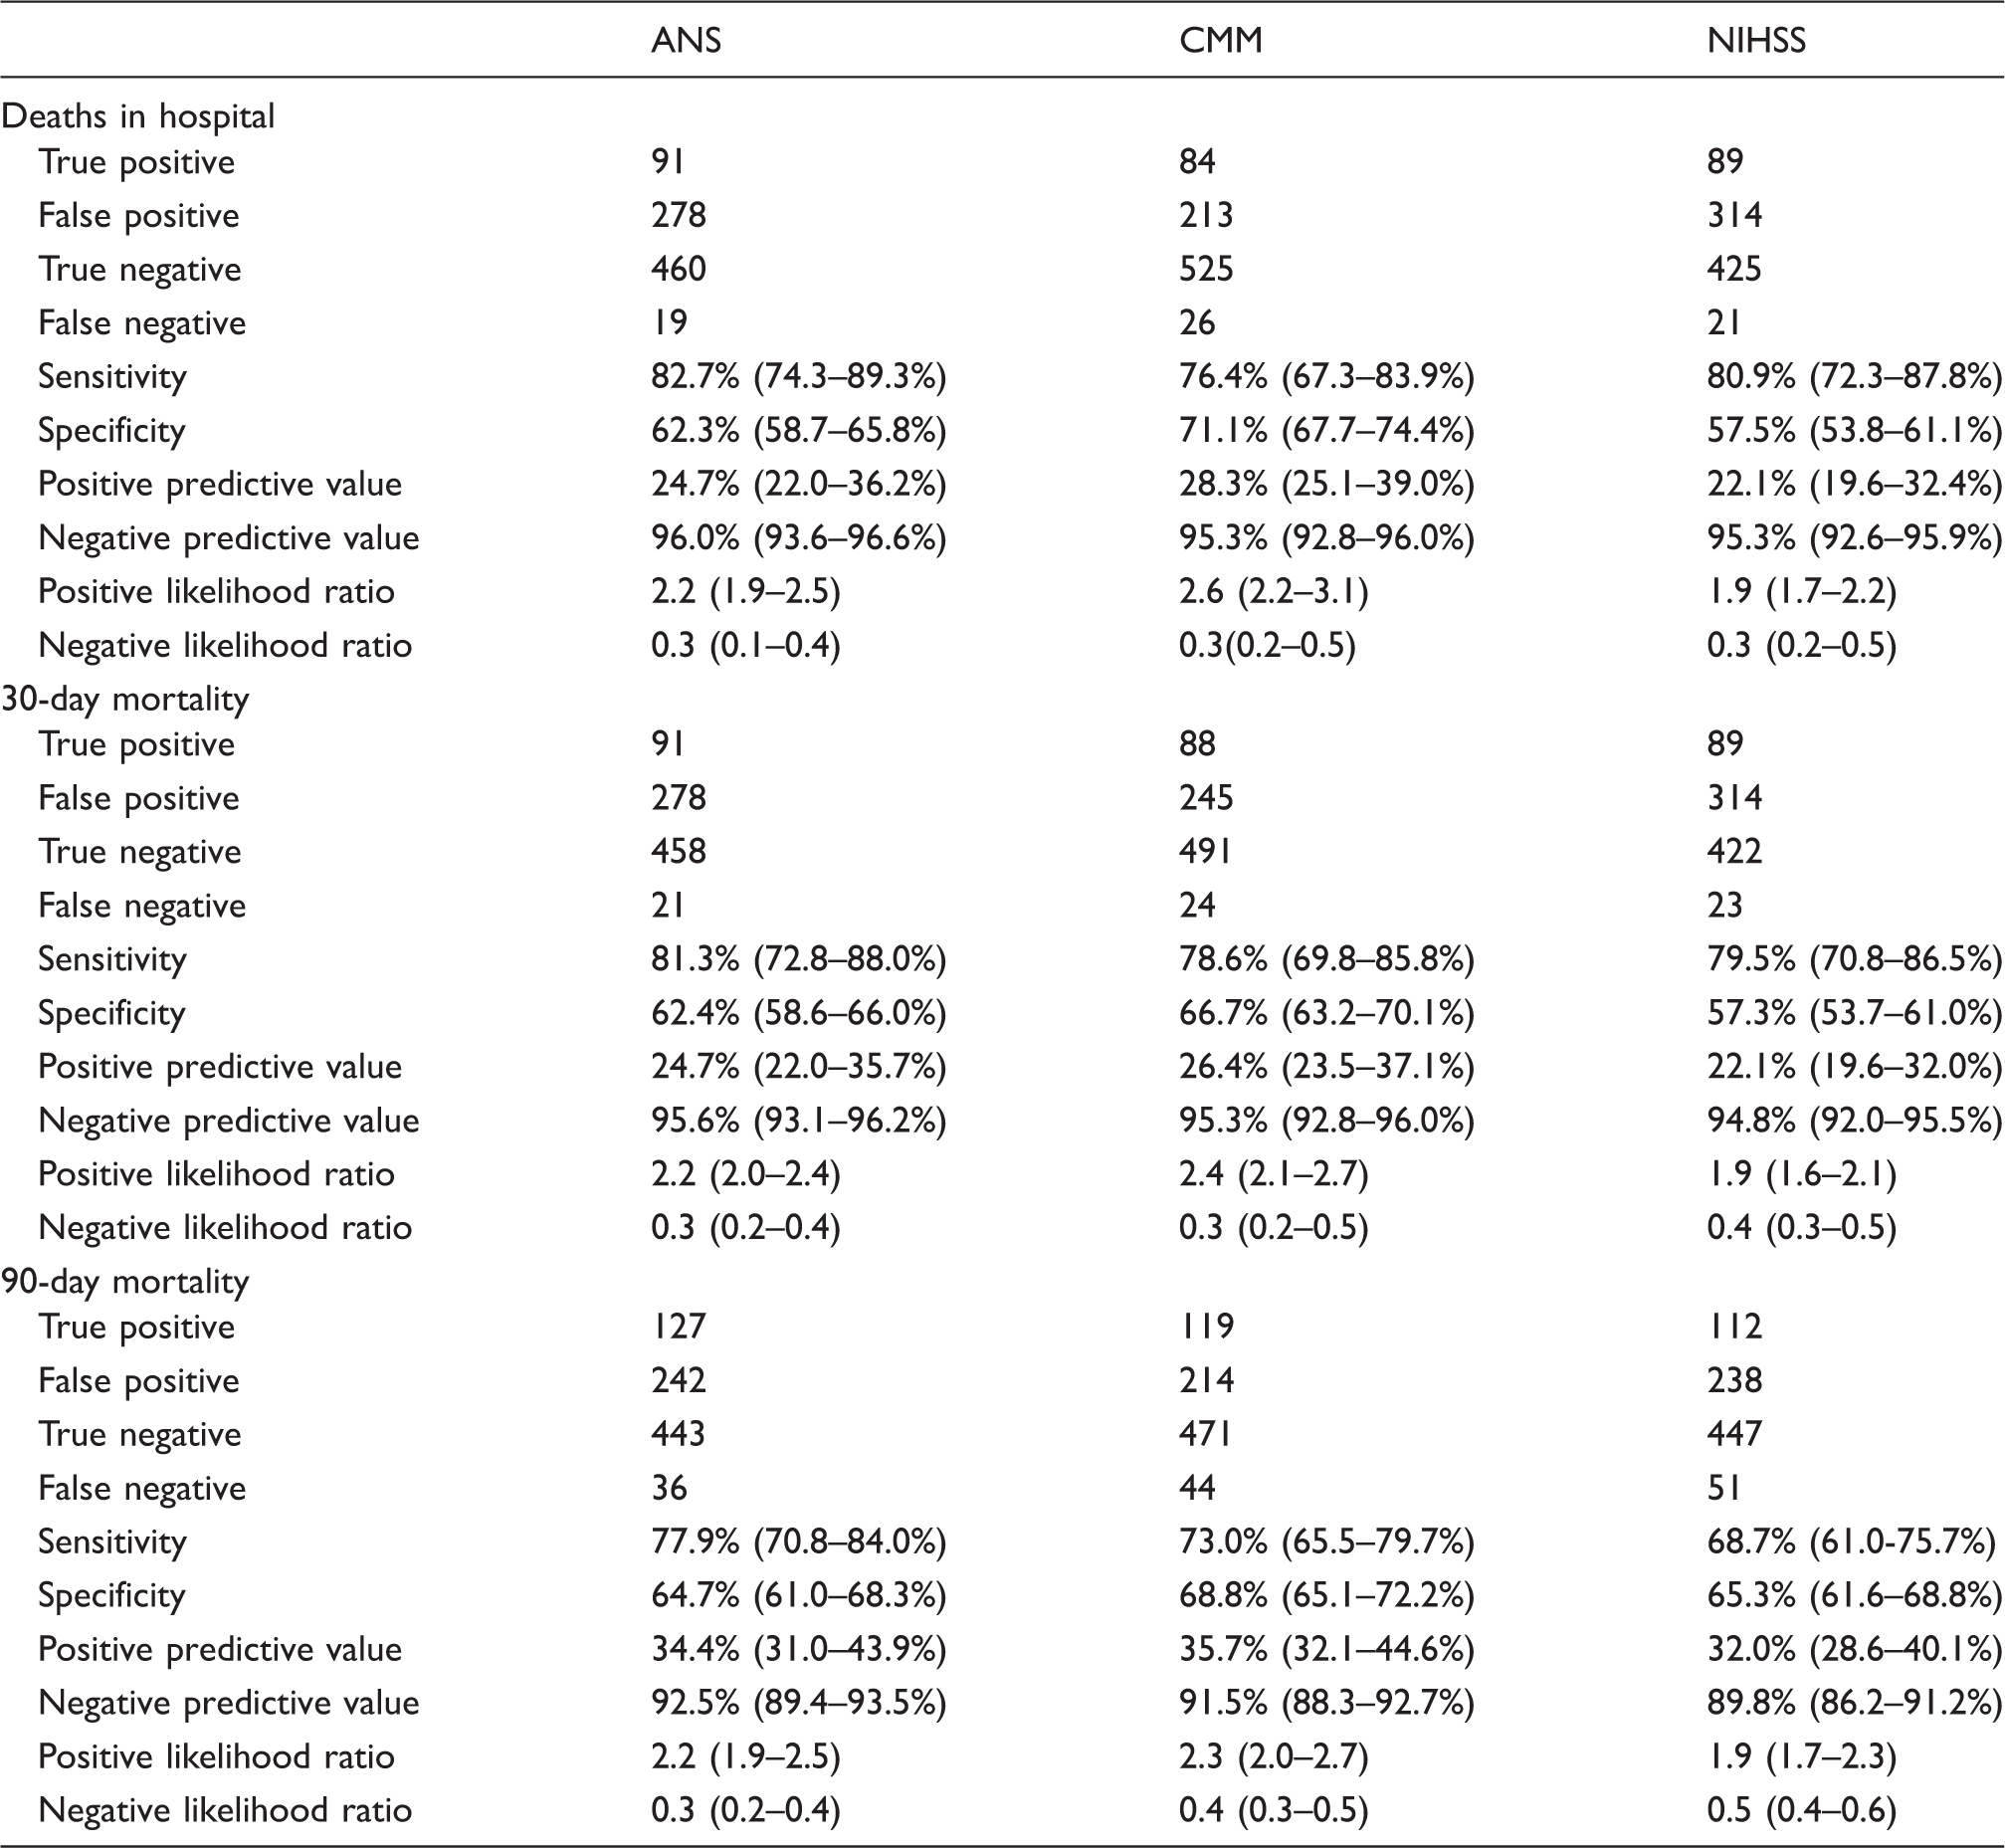
method were conducted and the results shown in Table 2. These results suggest that there was a consistently significant difference between the ANS and NIHSS score for in hospital, 30-day and 90-day mortality and a significant difference between the CMM and NIHSS only for 90-day deaths. As the ANS has not been validated in intracerebral haemorrhage before, the performance of the three scores was tested separately in infarcts and haemorrhages (online Supplementary Table 1). Although the number of haemorrhages in our sample was small (n = 119), there appeared to be no major difference in the c-statistics of the ANS and CMM while the c-statistic of the NIHSS was lower (0.698) for patients with haemorrhages dying in hospital.
Receiver operating characteristics curves for the ANS, CMM and NIHSS scores for in hospital, 30-day and 90-day mortality. Comparison of c-statistics and significance test results for the three scores. ANS: age and NIHSS score; CMM: case mix model; NIHSS: National Institutes of Health Stroke Scale. p Values by the DeLong method.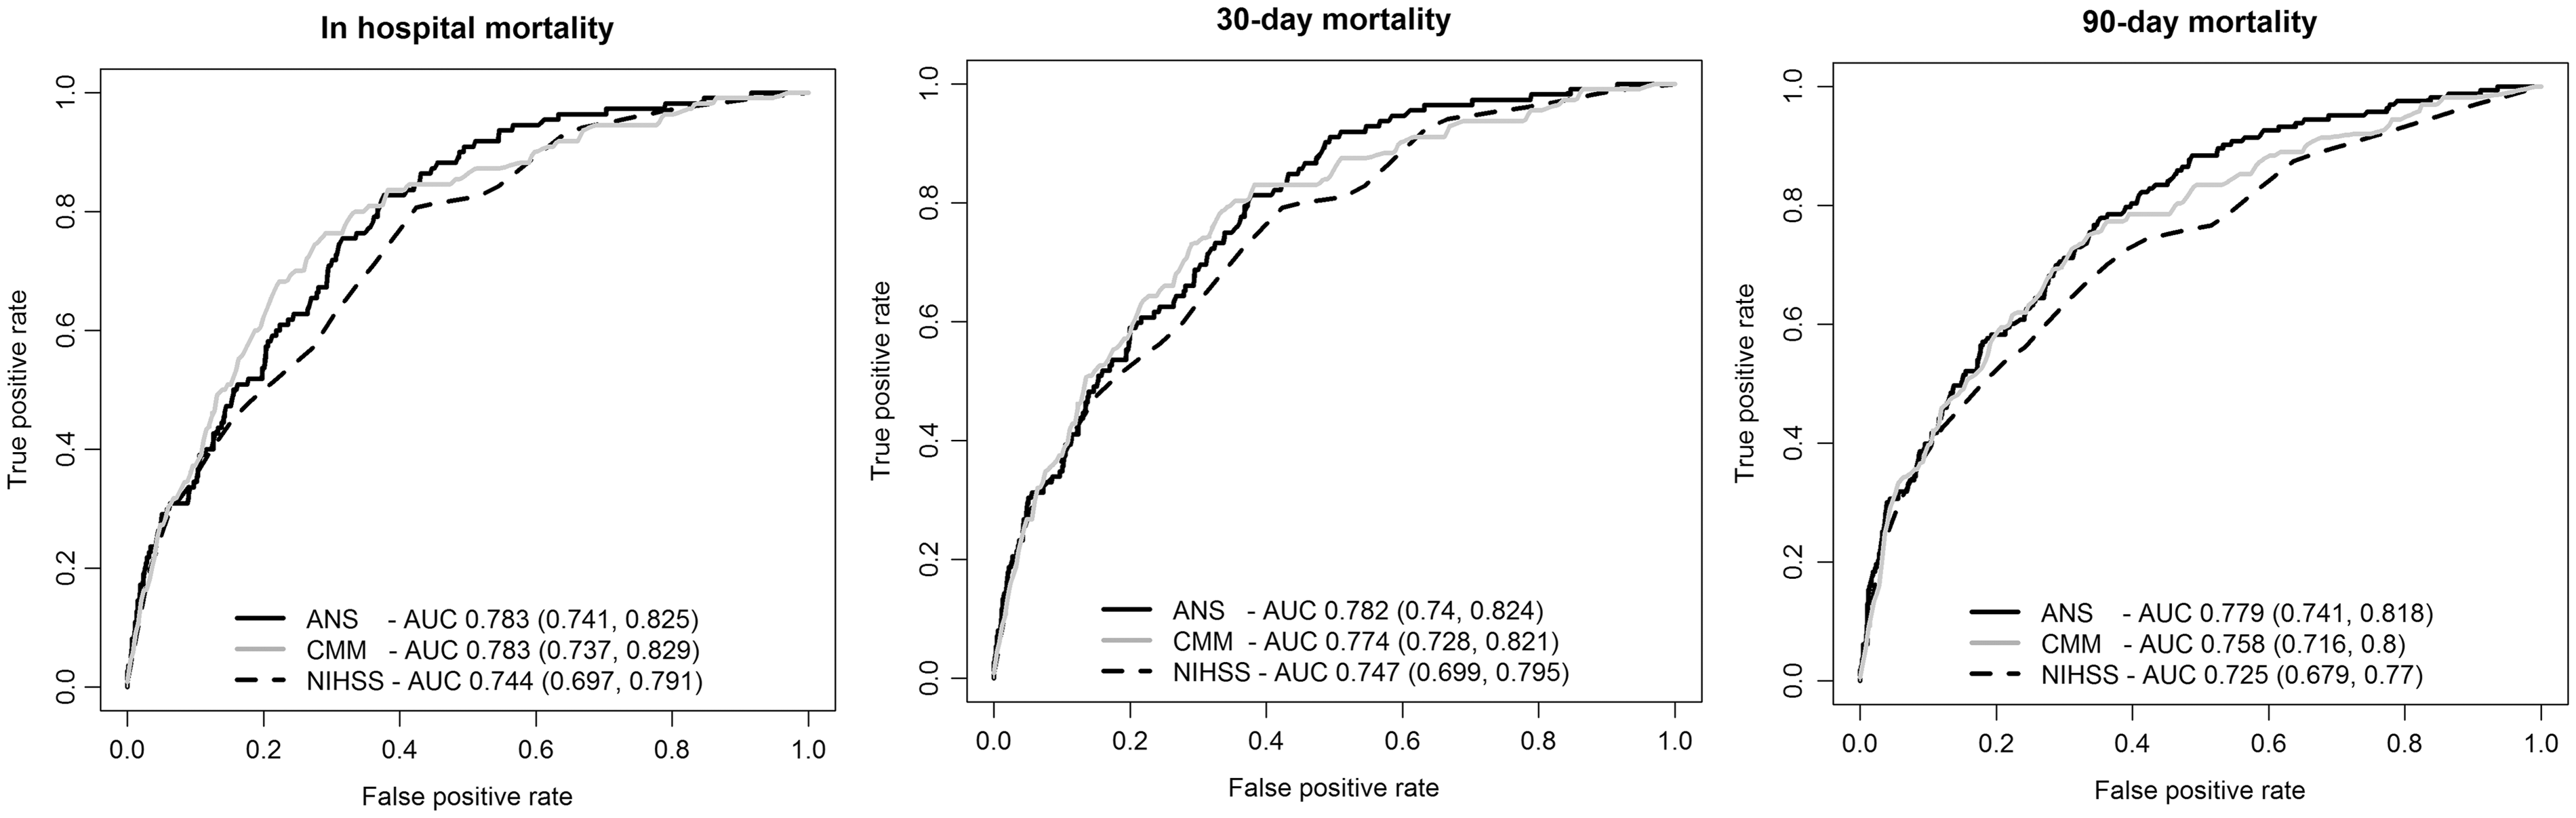
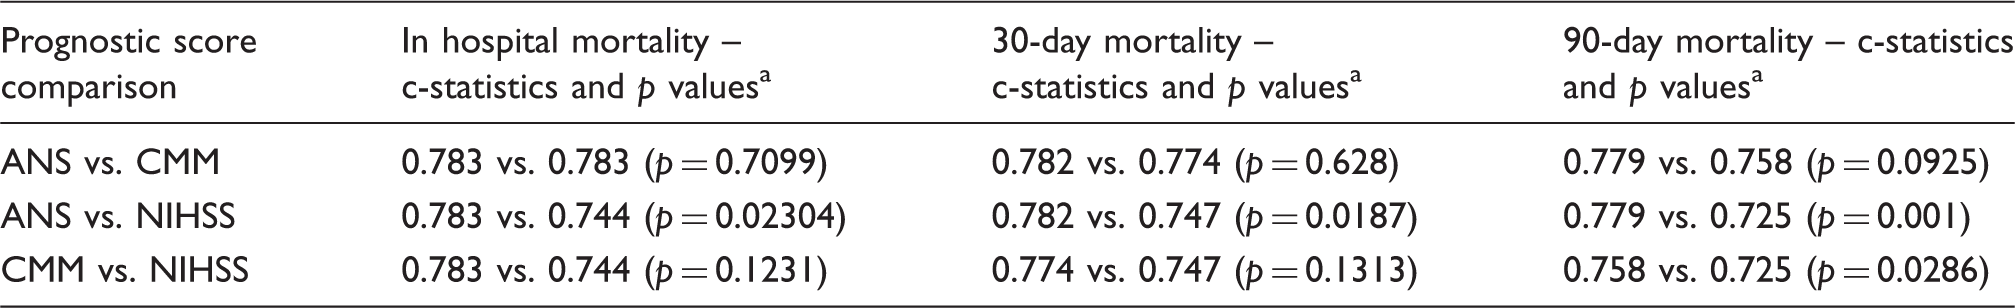
Table of prognostic significance tests using the ANS, CMM and NIHSS scores.
ANS: age and NIHSS score; CMM: case mix model; NIHSS: National Institutes of Health Stroke Scale. Confidence intervals (95%) are shown where available.
For all patients discharged alive, follow-up was for more than 90 days. Kaplan–Meier curves were obtained for all deaths by the end of the study stratified by the cut points obtained for the ANS, CMM and NIHSS score as high risk and low risk (online Supplementary Figures 2–4). All the scores demonstrated highly significant p values (<0.0001) by the log rank test. A NIHSS score of ≥6 was associated with a significant higher mortality in comparison to scores <6.
Discussion
In this study, we have independently validated two clinical prognostic scores incorporating the NIHSS, the ANS and CMM scores and compared their performance on the same cohort of patients. The results of our study suggest that both scores had fair discriminatory performance (AUC between 0.7 and 0.8) but the simplest risk score (ANS) based on just two variables, age and NIHSS on admission, performed as well as the CMM which contains additional factors. In fact, the c-statistics of the ANS were marginally, but not significantly, better than the c-statistic of the CMM for in hospital, 30-day as well as 90-day mortality. The NIHSS score on admission alone provided AUCs which would be considered to be fair, although significantly lower than the ANS score.
Both the scores were used slightly differently in this study than originally intended; the ANS was not designed to predict in hospital or 30-day mortality and had never been intended for cohorts containing haemorrhagic strokes. 9 It was designed in acute stroke units in Germany and its external validity is uncertain.9,13 The NIHSS scores had been collected within 6 h of onset in the original ANS derivation study, 9 but were calculated much later in our study as the median time to admission in our cohort was 7.2 h. The derivation cohort of the CMM had contained both ischaemic and haemorrhagic strokes but the score had been designed and validated only for 30-day mortality. 10
Several prognostic scores have been designed to predict stroke mortality and functional outcomes. Most include age and some measure of stroke severity. Examples include the GTWG-Stroke score, 8 iScore, 26 the six simple variable score, 27 SPAN-100, 28 ASTRAL, 29 THRIVE, 11 DRAGON 30 and TPI 31 in addition to the two scores validated in this study. Many include vascular risk factors and co-morbid conditions while others have added imaging to the scores.11,26,30 The most useful prognostic models are usually simple and derived from routinely collected clinical data. Recording of the NIHSS on admission is already mandatory for patients undergoing thrombolysis and mechanical thrombectomy. Many registries, including SSNAP, encourage the routine collection of the NIHSS for all stroke patients. 17
The c-statistic of the ANS for 90-day mortality in our study (0.789) compares favourably with the value of 0.706 in an earlier validation study using a clinical trial cohort. 13 This was in spite of our different setting, inclusion of patients with intracerebral haemorrhage and later NIHSS scores ascertainment. There are no other validation studies that have studied in hospital and 30-day mortality with this score but our c-statistics for the ANS, 0.783 and 0.782 clearly suggest fair discrimination for this score. The CMM c-statistic of 0.774 for 30-day mortality compares with values of 0.864 and 0.866 for internal and external validation in the original derivation study. 10 The original CMM training dataset was derived from hospitals in England and Wales which are broadly similar to our centre. 10 Their external validation dataset was drawn from a population based registry in London. 10 The CMM has not been tested for in hospital or 90-day mortality before and our c-statistics of 0.783 and 0.758, respectively again suggest fair discrimination.
The in hospital mortality c-statistic of the NIHSS score alone was 0.744 in this study and was 0.83 in the original GWTG-stroke risk model study. 8 Our c-statistic of the NIHSS alone for 30-day mortality was 0.747 compares the c-statistic of 0.82 in data from Medicare beneficiaries. 14 The NIHSS optimal cut point of 6 obtained in our study is in keeping cut points of NIHSS severity that discriminate between low and significantly higher mortality derived in previous studies such as the dataset from Medicare beneficiaries 14 and the GWTG-Stroke cohort where patients who survived had a median NIHSS of 4. 8 The c-statistics obtained in our validation as well as the sensitivities and specificities of the two scores suggest that they may not be accurate enough to predict individual patient outcomes but should be very suitable for the purpose of case mix adjustments in trials and comparison of outcomes for different service providers.
The strengths of this study were a reflection of the SSNAP data collection method; all data were prospectively collected via a secure web portal within inbuilt prompts for validation and completion. Consecutive patients admitted to our centre were entered into the database with no selection bias. Diagnosis was confirmed by experienced stroke physicians with the help of imaging and did not rely on coding. The NIHSS scores were ascertained by NIHSS certified clinicians as soon as possible after admission. There were no missing NIHSS scores or other variables used to calculate the two prognostic scores. No patients were lost to follow up and outcome data were complete. We are confident that we were able to ascertain all deaths in hospital (which are collected prospectively) and out of hospital because of the robust links of our ‘Infoflex’ database with various sources of death ascertainment.
The weaknesses of this study include retrospective calculation of the risk scores and ascertainment of 30-day and 90-day mortality. The sample size was more than adequate for ROC curves analysis for a single prognostic score. However, for the comparison of two or more scores with minor difference in c-statistics a larger sample would almost certainly be needed. Our sample size of nearly 850 patients admitted over 1 year is typical of larger hospitals in the UK and suggests that any of the two scores could be used for case mix comparisons for outcomes. Our median age of 78 suggests an older population in keeping with the demographics of our region. The median NIHSS of 4 in our sample is consistent with data from SSNAP for other centres in England and Wales and our 30-day mortality of 13.8% compares with a crude mortality of 13.6% for all hospitals in England and Wales in 2015–2016. 17 Our centre is slightly unusual in having a large number of rehabilitation stroke beds on site where patients are transferred from the acute stroke unit and can spend several weeks. Many stroke services transfer patients from acute stroke units to external rehabilitation units. Given these caveats, we feel that our results are generalisable to most other stroke centres in similar healthcare settings.
Conclusion
A simple prognostic score comprising age and NIHSS score on admission performed just as well as a more complex score in predicting in hospital, 30-day and 90-day mortality in a cohort of ischaemic and haemorrhagic strokes. In keeping with previous data, the NIHSS score alone showed fair predictive value and a NIHSS ≥6 was associated with significantly higher mortality. Routine recording of NIHSS for all stroke patients should be considered for all stroke registries.
Footnotes
Declaration of Conflicting Interests
The author(s) declared following potential conflicts of interest with respect to the research, authorship, and/or publication of this article: DD is the principal investigator of a Bayer sponsored randomised controlled trial and Boehringer Ingelheim sponsored AF registry. The others have no conflicts of interest to declare.
Funding
The author(s) disclosed receipt of the following financial support for the research, authorship, and/or publication of this article: SSNAP is funded by the Healthcare Quality Information Partnership (HQIP) on behalf of NHS England. There was no specific funding for this study.
Ethical approval
This study was exempt from ethical approval and individual consent. The Health Research Authority, England approved the study (IRAS ID 216501).
Guarantor
DD.
Contributorship
DD conceived the study and DD, AC and EB reviewed the literature. Data were accessed by DD, AC and EB. DD was involved in the research proposal, gaining Health Research Authority approval and data analysis. DD wrote the first draft of the manuscript. All authors reviewed and edited the manuscript and approved the final version of the manuscript.
References
Supplementary Material
Please find the following supplemental material available below.
For Open Access articles published under a Creative Commons License, all supplemental material carries the same license as the article it is associated with.
For non-Open Access articles published, all supplemental material carries a non-exclusive license, and permission requests for re-use of supplemental material or any part of supplemental material shall be sent directly to the copyright owner as specified in the copyright notice associated with the article.