
Abstract
Background
Case-based learning (CBL) and team-based learning (TBL) in preclerkship medical education are popular learning methods. Our institution utilizes a novel approach of using CBL as prework for TBL. Research has shown that smaller group sizes are better for CBL, whereas larger group sizes are better for TBL. Further, the spatial relationship of students in classrooms and subsequent academic performance has been studied previously but has not yet explored the medical student population during active learning methods. We investigated the effect of group size in active learning, classroom location, and subsequent performance on TBL and final exam questions.
Methods
Student performance data from 4 preclerkship medical cohorts were analyzed. Descriptive statistics was conducted to compare performance of each cohort. Regression analysis was conducted to determine the explanatory and predictive power of group size and location on individual and team TBL performance and exam performance.
Results
Larger groups had increased individual and team performance on TBL. Classroom location had mixed effects on TBL and exam performance. One cohort experienced a change in group sizes and learning environment which may be related to the lower TBL scores compared to other cohorts. We found no significant relationships between group size and exam scores.
Conclusions
Our findings indicate that larger groups are associated with increased TBL performance. Exam scores are more likely impacted by individual factors, as opposed to group factors. Our findings were mixed in comparison to previous research, reaffirming the need to further study group sizes and locations specifically within the health science education active learning.
Introduction
One of the challenges of modern learning is the necessity for faculty to teach an expanding knowledge base to large class sizes in a limited amount of time. In addition, students are tasked with understanding both the fundamentals of course material as well as how learning objectives can be applied to real-world scenarios.1 Particularly in medical education, students must learn both biological fundamentals and clinical applications to be successful in the classroom and professionally. One modality of teaching designed to help faculty successfully approach large class sizes with vast quantities of information is team-based learning (TBL). Many medical schools in the past 20 years have integrated TBL exercises into their medical curriculum.2–6 The AAMC reported that approximately 54% of medical schools utilized TBL in the 2019–2020 academic year.7 The use of TBL in the preclinical years of medical education has been shown to provide many benefits including improved performance on exams and improved critical thinking.2,3,8,9 As it pertains to medicine, the TBL format promotes learning through teamwork and helps future healthcare workers learn how to work effectively in teams while assessing knowledge and problem-solving abilities.10,11 Another modality of teaching utilized by many medical schools is case-based learning (CBL). The AAMC reported that approximately 97% of medical schools utilized CBL in the 2019-2020 academic year.7 CBL typically involves a small group of students learning new concepts and information while working through a clinical case. CBL's are versatile and often include an expansive approach to a particular case including differential diagnoses, pathophysiology, laboratory and imaging workup, and generation of treatment plans. While both CBL and TBL utilize a clinical case within small groups, the benefits and goals of each active learning method differ.11
In our legacy curriculum, Creighton University School of Medicine (CUSOM) first piloted TBL sessions in the anatomy course for first-year students. CBL was integrated into a longitudinal M2 course where students were precepted by faculty to work through clinical scenarios related to the content they were learning in their concurrent course. When CUSOM transitioned to a fully integrated curriculum based around organ-system blocks in 2019, the faculty sought to improve critical thinking and teamwork skills during preclinical training by uniquely combining a CBL and TBL using the same small groups. At CUSOM, students first engage in a CBL, whereby teams gather new information by working through a clinical case online. Then, students attend a TBL that both assesses and applies the material learned in CBL. With this approach, CBL is used as prework and preparation for TBL, instead of the traditional TBL pre-reading or online recordings. Therefore, a team's TBL performance is related to the team's ability to successfully work through the CBL prior to TBL. The majority of TBL's are paired with CBL's in our curriculum and only paired activities were included in our study. Notably, our students are part of one small group/team that remains the same for both CBL and TBL learning activities. For the remainder of the manuscript, we will refer only to “TBL teams,” though it is imperative to acknowledge that this is essentially synonymous to “CBL group.” CUSOM has recently modified the sizes of small groups used for CBL and TBL. Previously, small groups consisted of 5-6 students. For the 2023-2024 academic year, group sizes were increased to 7-8 students. This modification provides a valuable opportunity to assess how an increased group size, though a small change, may affect student academic performance.
Size
Given that groups/teams remain the same for both CBL and TBL, it's important to assess how the number of students impacts both active learning modalities. Previous studies examining aspects of CBL in medical education have utilized group sizes between 3 and 20 students, all of which demonstrated advantages with smaller groups, particularly 12 or less.5,12 However, previous studies examining aspects of TBL in medical education have demonstrated advantages for both smaller and larger groups, though the “optimal” team size for TBL is considered to be 5-7 students.1,10,11,13,14 Two large reviews examining the use of TBL in health professions education–including nursing, medical, pharmacy, and interprofessional programs–reported on teams ranging from 2 to 10 students, with several articles reporting an optimal team size of 5 to 7 students.15–17 Larger groups have enough students to successfully navigate complex problems, however cohesiveness develops slower, which may be further bolstered by a “too-much-talent effect,” resulting in a decrease in intrateam coordination and performance.1,10,14 Smaller groups may lack the necessary resources to tackle complex problems but may have better social function including improved communication and mitigation of social loafing.1,18 Overall, the educational impact of group sizes on CBL and TBL in medical education is still largely understudied and unclear.
Location
Another variable of interest is the spatial relationship of students relative to the facilitator during the TBL. In CUSOM's Active Learning Space (ALS) on the Omaha campus, 9 TBL groups at the back of the room were physically obscured from the facilitator and main projection screen by a staircase from the upper floor and lower ceiling levels while a new health science education building was being built (see highlighted tables in Appendix A). At CUSOM, teams remained in the same physical location throughout the duration of the semester. Previous research demonstrated that medical students who sat closer to the board at the front of the lecture hall had better academic performance; the authors surmised that architectural spaces may also impact academic performance.19 Further, this study of medical students found that students seated in high and medium interactional zones in relation to the professor performed better on exams. Studies from undergraduate students have also found that students who sat in the front of the classroom were more engaged, less distracted, and performed better.20,21 The location of the spatially separated groups in the ALS is a cause for concern with regards to TBL performance in relation to these findings pertaining to the impact of seat selection and academic performance. Of note, many studies examining seat location and academic performance were conducted in the undergraduate population, further demonstrating a need to examine this aspect of learning in the medical student and health sciences student population. Given the admission requirements for medical school, we can expect more homogeneity in performance than for undergraduate students.
This research is grounded in the educational theory of constructivism, which asserts that learners actively construct knowledge by integrating new experiences with their existing cognitive frameworks. Constructivism emphasizes the importance of social interaction, collaboration, and context in the learning process, which aligns closely with both CBL and TBL in preclerkship medical education. Constructivist principles support educational designs that foster engagement and critical thinking—both of which may be influenced directly or indirectly by team size and classroom location, providing a strong theoretical foundation for the study of these concepts in preclerkship medical education.22
Existing literature has focused on CBL and TBL as individual active learning methods. CUSOM's unique approach of using CBL as prework to TBL is largely unstudied in the literature, underscoring the importance of this study. Given the change in team size and configuration of the learning space, we had a unique opportunity to study the effect of both team size and physical location. In this study, we investigated the effect of team size in CBL/TBL and subsequent performance on TBL and final exam questions. We hypothesized that smaller teams would perform better on TBL and final exam assessments. Additionally, we investigated the relationship between physical location during TBL and exam performance. Within the ALS, we hypothesized that teams that are placed in the back corner, with less direct access to faculty and projector screens, would perform worse on TBL-associated exam questions.
Methods
Student data from CUSOM's Omaha classes of 2025 (N = 128), 2026 (N = 130), and 2027 (N = 132) were collected to investigate the relationship among the following variables within each academic class: mean Individual Readiness Assurance Test (IRAT) performance, mean Team Readiness Assurance Test (TRAT) performance, mean performance on exam questions, and group location within the ALS during TBL. Details of the cohorts are shared in Table 1; they will be referenced by abbreviations for the purposes of the manuscript. All data was deidentified by the Office of Accreditation and Quality Improvement and grouped according to CBL group for analysis purposes. Medical student performance on IRAT, TRAT, and associated examination questions were obtained through BlueLine (Canvas) gradebooks and ExamSoft. The nature of this study is a quantitative, cross-sectional study using student data. This study was classified as exempt by the Creighton University Institutional Review Board (IRB#2004310-01). The reporting of this study confirms to the STROBE statement.23
Cohort descriptions and associated team sizes.

Graded components for TBL included the IRAT and TRAT. During TBL, students first completed the IRAT, an individual assessment of a small set of questions. Then, students completed the TRAT, completing those same questions as a team. Further, students were also tested on the learning objectives of TBL on the final exam of each course. In this study, exam performance refers only to a student's performance on the exam questions specifically testing the TBL learning objectives, not a student's performance on the overall final exam.
Each year, CBL cases, TBL performance, and student feedback were reviewed by faculty and updated with any necessary changes (eg, word choice, answer choices, and new medical advancements). While there were changes made to some cases, the overall learning objectives remained largely unchanged. For this research, only stable IRAT/TRAT questions were selected for analysis from these cases. We defined stable as those that lacked changes spanning the last 3 academic years, specifically considering the question's wording, answer choices, and relevant information or source within the CBL. Additionally, selected stable questions had associated final exam questions related to the learning objectives of the CBL and TBL, which are the same. Twelve M1 and 10 M2 IRAT/TRAT questions that met these criteria were included in our analysis.
Location in the ALS was visualized using a blueprint (see Appendix A). Location was only studied in the M1a and M2a cohorts from the academic year 2022-2023; the medical school moved to a new building in academic year 2023-2024 where the ALS did not have any significant architectural obstructions.
Statistical Analysis
Regression analysis was conducted to determine the explanatory and predictive power of group size and location within the ALS on IRAT, TRAT, and exam performance on related assessment items. To analyze the association between team size and performance on IRAT, TRAT, and exam assessment items, regression analysis was performed with IRAT, TRAT, and exam assessment items acting as dependent variables with team size acting as the independent variable. As IRAT and exam assessment items are binary variables—with either correct or incorrect responses—logistic regression was performed. TRAT assessment items are graded on the number of guesses it takes a team to respond correctly such that points are reduced for each incorrect guess (starting at 4 down to 0) so a linear regression was performed.
Lastly, IRAT outcomes were included in the regression analysis on TRAT and exam assessment item outcomes. For TRAT outcomes, as the same questions were posed as in the IRAT assessment, the IRAT outcome data was used. For exams, an aggregate measure of total IRAT performance was used. IRAT, TRAT, and exam performance were studied among all 4 cohorts.
Results
Table 2 displays the mean performance by each cohort and class year on their respective assessment items. There were statistically significant differences found between cohorts for some of the assessment items. For IRAT items, small, but significant differences exist; the M2a cohort had higher performance than both the M1a cohort (t(2787.50) = −2.91, P < .01) and the M2b cohort (t(2520.20) = 2.68, P < .01). For TRAT items, the M2a cohort again performed higher than the M1a cohort (t(1902.60) = −3.73, P < .01) and the M2b cohort (t(1419.80) = 5.36, P < .01). The M1a cohort had higher performance than the M2b cohort (t(2369.90) = 2.25, P = .02). For exam items, the M2b cohort had higher performance than the M1a cohort (t(1662.70) = −2.21, P = .03). Due to the minor difference between cohort means, the remainder of results will be reported across each cohort rather than all cohorts being combined together.
Mean and SD of assessment performance by assessment item type.

* P < .01 compared to IRAT for M1a and M2b.
P < .01 compared to TRAT for M1a and M2b.
P < .01 compared to Exam for M1a.
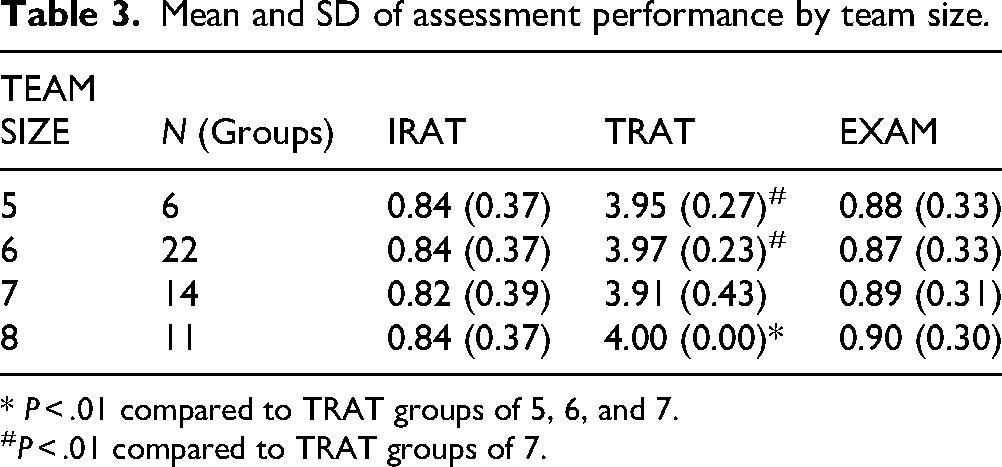
Table 3 displays the mean performance on assessment items by team size.
Mean and SD of assessment performance by team size.
* P < .01 compared to TRAT groups of 5, 6, and 7.
P < .01 compared to TRAT groups of 7.
When testing for the TRAT assessment items, groups of 8 had significantly higher average performance than groups of 5 (t(318.00) = −2.94, P < .01), 6 (t(1473.00) = −7.95, P < .01), and 7 (t(2517.00) = −5.53, P < .01). Groups of 5 and 6 had significantly higher average performance than groups of 7 (t(725.84) = 2.41, P = .02 and t(1973.10) = 5.27, P < .01, respectively). No significant difference between group sizes was found for IRAT or exam items.
Table 4 displays the mean performance on assessment items by location within the ALS for cohorts M1a and M2a. Groups in the M1a cohort located in the front of the ALS had significantly higher average performance on TRAT assessment items (t(623) = −5.42, P < .01). No significant difference was found for TRAT assessment items within the M2a cohort based on location within the ALS. No significant differences were found for IRAT or exam items.
Mean and SD of assessment performance by assessment item type, by location within the ALS.

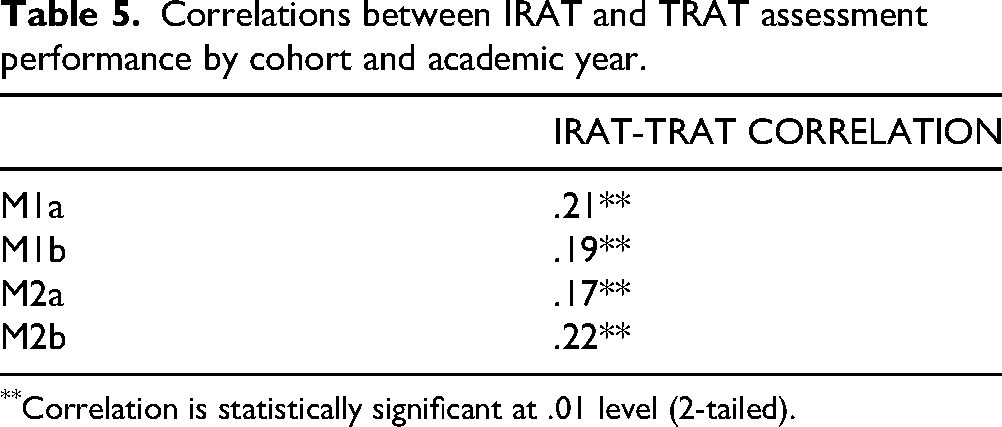
Table 5 displays the results of correlation testing that was conducted between IRAT/TRAT items by cohort and academic year. The IRAT and TRAT scores were correlated for all cohorts. Table 6 displays the results of correlation testing that was conducted between aggregate IRAT average performance for each observed student and subsequent exam performance, by cohort and academic year. The IRAT and exam performance were only correlated for M1b and M2b cohorts.
Correlations between IRAT and TRAT assessment performance by cohort and academic year.
Correlation is statistically significant at .01 level (2-tailed).
Correlations between IRAT mean performance and exam performance by cohort and academic year.

Correlation is statistically significant at .01 level (2-tailed).
When potential correlations between IRAT and exam scores were examined, the analysis revealed that the 2023-2024 cohorts (M1b and M2b) exhibited statistically significant positive correlations, with coefficients of .10 and .09 respectively, indicating a modest relationship where higher IRAT scores are associated with improved exam performance (Table 6). In contrast, the 2022-2023 cohorts (M1a and M2a) showed very low and non-significant correlations (.06 and .03, respectively), suggesting that IRAT performance in these earlier cohorts was less predictive of their exam outcomes (Table 6).
In addition to examining differences between cohorts, group size, and group location, we also performed a regression analysis to identify which variable(s) were predictive of performance on IRATs, TRATs, and exams.
IRAT Performance
In the regression analysis using team size and location to predict IRAT performance, the M2a cohort shows a significant association of team size when accounting for location within the ALS (ß = 0.63 [0.05, 1.21], P = .03). In assessing the predicted probabilities of obtaining the correct IRAT answer, observations in groups of 6 had higher probabilities of obtaining the correct IRAT answer than groups of 5 regardless of location within the ALS.
For the M2b cohort, there was a significant association between IRAT performance and team size (ß = 0.54 [0.14, 0.97], P = .01). In predicting the probability of obtaining the correct IRAT answer, the teams of 8 had higher probabilities of obtaining the correct answer than teams of 7. There was no significant association for the M1a or M1b cohorts.
TRAT Performance
In the regression analysis using team size and location to explain TRAT performance, the M1a cohort shows a significant association of location within the ALS both when accounting for team size (Adjusted R2 = .03, F(2, 1555) = 22.26, P < .01) and not (Adjusted R2 = .03, F(1, 1556) = 43.91, P < .01). A small negative effect of being placed in the back of the ALS was identified, yet the low R2 value (.03) suggests that unanalyzed variables also potentially influence TRAT performance.
Conversely, the M2a cohort experienced a small positive effect of being placed in the back of the ALS on TRAT scores when both team size and location are included in the model (Adjusted R2 < .01, F(2, 1258) = 3.155, P = .04). While these results were the opposite of the M1a cohort, the low R2 value (less than .01) implies that variation in performance are likely impacted by variables not included in the analysis.
A positive association between larger team sizes and TRAT scores was observed for the M1b and M2b cohorts (Adjusted R2 = .01 and P < .01 for both, M1b F(1, 914) = 12.04 while M2b F(1, 1276) = 13.85), indicating that larger teams generally performed better. However, the low R2 values in these analyses again indicate that other unmeasured variables might be influencing the results more substantially.
Exam Performance
In the regression analysis using team size and location to predict exam performance, there were no significant effects found across any of the cohorts. Team size and location in the ALS had no impact on exam performance.
Discussion
Team Size
The analysis demonstrates that group size does have an impact on learning outcomes, particularly in team-based settings like TRAT. Larger groups (specifically those consisting of 8 members) performed better compared to smaller groups across all cohorts. This suggests that more participants might provide a richer pool of knowledge and perspectives, potentially leading to more effective problem-solving and learning. As highlighted in the constructivist pedagogy, learners actively construct knowledge through interaction, reflection, and collaboration, thus supporting the idea that larger teams, such as 8 versus 5 students, may result in improved learning.22 However, the minimal effect sizes, particularly for TRAT performance, indicate that while group size influences performance, it is one of many factors that contribute to the educational outcomes of TBL activities. Previous studies argue for small group sizes between 5 and 7 students when using TBL as a learning method in order to successfully navigate complex problems and achieve higher level thinking.1,10,11,15–17 One study considering performance on the NBME Psychiatry Subject Test found that teams composed of less than 5 members did not have the necessary resources to tackle complex problems within the TBL format and argued for teams of 5-7 students. Notably this study only included one group of 8 students, which may have contributed to their recommendation for teams of 5-7 students.10 Our study included 11 groups of 8 students, therefore, our findings suggest teams of 8 students with our differing team size population. Conversely, a meta-analysis of undergraduate students and graduate medical students found that content knowledge outcomes were greater in TBL teams composed of less than 5 members. This was based on the reasoning that group discourse and communication are facilitated by smaller group size and social loafing is more likely to be mitigated, though these findings were not specific for health professions education.18 While many studies support an optimal TBL team size of 5-7 students, others—including our own—report improved outcomes with groups fewer than 5 or larger than 7 students. This variability highlights the need to evaluate TBL within the context of individual institutions especially given the diverse implementations of TBL in preclerkship versus clerkship medical education.
Alternatively, previous studies examining CBL in medical education have demonstrated advantages with smaller groups.5,12,13 Given that CUSOM uses the same teams/group for both CBL and TBL, we must distinguish that our study only considered TBL performance outcomes, which supports previous literature showing improved performance with larger teams. Despite the statistical significance of improved performance on TRAT with larger teams, the effect size is minimal indicating that differences in team sizes for these cohorts are unlikely to be practically meaningful. We suspect that by all teams having a minimum of 5 students, there is enough collective knowledge to be successful in TBL, making any small differences in TRAT performances negligible from an overall grade perspective.
Two (M2a and M2b) of the 4 cohorts showed a significant association between increased IRAT performance and team size. These observed differences in IRAT performance in larger teams may be a byproduct of the collaborative nature of these specific cohorts that may allow the flow of more diverse perspectives, greater opportunity for peer-to-peer learning, and enhanced accountability to ensure group preparedness during CBL and TBL. More experience, second year students versus first year students, may also contribute to second year students benefiting more from a larger team size. On the other hand, half of the cohorts saw no difference in IRAT performance based on team size which could imply that IRATs, which assess personal understanding and preparation, are less influenced by group dynamics during CBL learning and more by individual study habits and capabilities. Therefore, we can’t reject the hypothesis that team size and dynamics affecting CBL learning may play a role in TBL performance.
Location
The location within the learning environment also had a statistically significant association with student performance, albeit with mixed effects. Students placed in the back of the ALS exhibited varied responses in TRAT performance; the M2a cohort benefited from this positioning, contrary to expectations, while the M1a cohort experienced slight disadvantages. This discrepancy might be attributed to different engagement levels or perhaps the physical layout's interaction with other environmental factors, such as acoustics and visibility, which may affect student concentration and participation differently across cohorts. These findings suggest that the physical setup of learning spaces should be carefully considered to ensure equitable learning opportunities for all students, regardless of their seating position. Efforts to rotate group locations or redesign spaces to minimize obstructions and enhance visibility could be beneficial. Specifically, subsequent cohorts at CUSOM now rotate locations within the ALS during TBL activities. Additionally, there were no significant relationships between exam performance and location in the back of the classroom during active learning, contrary to our hypothesis and current literature. A study by Zomordian et al showed a positive correlation between exam performance in medical students who sat in a higher interactional zone.19 Studies among undergraduate students also found a positive relationship between academic performance and students sitting in the front of the classroom.21,24 The lack of observed difference in exam performance as a function of seat location in our study is likely a function of the homogeneity of the medical student population when compared to the heterogenous undergraduate populations that have been previously studied, particularly relating to academic achievement, study habits, academic and professional maturity, and intrinsic motivation. Another significant difference between our study and previous studies is that our students did not choose their own location within the ALS. Students were randomly assigned to teams at the beginning of the year. Thus, a selection bias may be present in other studies as students who were less invested in the subject matter may have chosen to sit in the back. This could contribute to the observed variance in academic performance. Further, one study found that students who sat in the front of the classroom did not perform any better, but did participate more.24 It is possible that students who sat in the front participated more, however, that was not reflected in improved performance in our study. Future study may explore how classroom location influences TBL participation in preclerkship medical education, particularly given constructivist principles that emphasize the role of social interaction in the learning process.22 Given TBL's emphasis on teamwork and collaboration, physical space and classroom location may impact student engagement, and ultimately learning outcomes. Anecdotally, CUSOM students spend more time studying for exams than they do for TBLs, likely because exams are typically about 70% of a student's final course grade, whereas each TBL is just 1% to 2% of a student's final course grade. Therefore, it's possible that there may be a negative effect of sitting in the back of the classroom on exam performance, such as what we found with TRAT performance in the M1a cohort, but that effect is mitigated by individual studying in preparation for the exam. Overall, we anticipate that exam performance is largely dictated by the amount of time a student studies which likely offsets any effects that team size or location may have on a student's learning in TBL.
Change in Team Size and Location
Focusing on the Class of 2026 that was observed during their M1 and M2 years provides valuable longitudinal insights into how group dynamics and educational strategies affect the same cohort over time. Notably, there was a decline in performance from the M1 (M1a cohort) to the M2 year (M2b cohort) in TRAT scores, which might reflect the adjustment challenges to changes in group size and learning environments. There was also a decline in IRAT and TRAT performance compared to the M2a cohort of the previous year. This cohort's experience underscores the importance of stability and gradual adaptation to new learning modalities and environments. The Class of 2026 cohort underwent change to a new academic building that included different classrooms, study space, small group rooms, and technology. Further, this cohort underwent a change in group size from the M1 to the M2 year. Additionally, the Class of 2026's experience highlights the critical role of educational continuity and the need to consider cohort-specific characteristics when implementing and adjusting educational strategies. Tailoring approaches to fit the evolving needs of a cohort, such as adapting group sizes or modifying the learning space based on feedback and performance trends, could mitigate transitional challenges and enhance learning outcomes.
An unexpected outcome of this work is the observation that IRAT scores were predictive of exam performance, but only for both cohorts of the 2023-2024 academic year. This finding contrasts with the 2022-2023 cohorts, where there was no significant correlation between IRAT performance and exam outcomes. This divergence suggests that IRAT effectiveness as a predictive tool can vary significantly between academic years, which may reflect changes in teaching strategies, student engagement, or other variables. The ability of IRAT to predict exam success in the more recent cohorts could also indicate improvements in how these assessments are integrated with the course content or how well they are preparing students for the types of questions and problem-solving required on final exams. Further analysis is needed to understand the underlying factors contributing to these year-to-year differences and to explore whether adjustments made in the academic strategies or curriculum in 2023-2024 enhanced the alignment between preparatory assessments and final exam performance. Such insights could guide future curriculum development to optimize the efficacy of early assessments across all cohorts.
Our findings underscore the necessity of studying CBL and TBL within the specific context of individual institutions. While most literature suggests optimal team sizes of 5-7 students, our study demonstrates improved outcomes with larger groups, albeit with a smaller effect size. Differing findings highlight the influence of contextual factors such as classroom environment, group dynamics, educational culture, and curriculum on academic performance. Our findings offer practical implications for curriculum planning in medical education. For example, the conclusion that larger teams may improve performance in some instances can inform decisions about optimal team composition when scheduling courses or generating teams. Institutions may consider implementing flexible team sizes based on specific learning objectives or characteristics of each medical cohort. Similarly, awareness of how classroom location affects engagement and performance may support the use of rotating seat assignments and improvements in classroom design (eg, improved acoustics and visibility) to ensure equitable learning environments. Further, there is variability in TBL implementation across medical and health professions education systems which may also impact TBL's impact on academic performance.15,16 Similarly, the design and delivery of CBL varies across institution affecting student learning and clinical reasoning applications. 11 Overall, these findings suggest that CBL and TBL, though popular learning methods in medical education, may be implemented differently to achieve the unique goals of each program.
One of the novel aspects of our approach is the use of CBL as preparation for TBL, which is a relatively underexplored approach in the medical education literature. Traditionally, TBL preparation involves individual reading assignments or recorded lectures, whereas our approach integrates interactive, CBL that may promote greater engagement and peer learning prior to the TBL session. Future studies could compare the effectiveness of CBL preparation versus traditional preparation formats with regard to academic performance, knowledge retention, clinical reasoning, and collaboration skills.
This study was conducted at a single institution with a unique approach that aligns CBL and TBL active learning pedagogies which limits generalizability. Because significant efforts were made to focus on only stable IRAT/TRAT questions, the small number of questions also limits the potential significance of some variables. There are several variables that we were unable to study that may have a significant effect on IRAT, TRAT, and exam performance and should be considered in the future to gain a more robust understanding of factors influencing student performance. Specifically, we were unable to consider student engagement in CBL and TBL, individual study time outside of CBL and TBL, and student perception and feedback on group dynamics. Another important aspect of TBL includes the application assignments that were not studied here. Future study should consider whether team size plays a role in the performance on application assignments which often require higher order thinking of complex cases, in which larger group sizes may be beneficial. CUSOM embodies a non-competitive, non-ranked culture that may also have significant effects on student academic performance and group dynamics. Further study should consider the effects of team size and seat selection among other groups of health science students, particularly at institutions that utilize a ranking system or are known to have a more competitive culture.
An additional limitation includes the fact that TRAT assessment items are not graded on a continuous scale, but rather on a (4, 2, 1, 0) scale. Therefore, the linear regression performed on these items may not capture the full relationships between input variables (location within the ALS, team size, and IRAT performance) and the dependent variable of TRAT performance. Linear regression was used in this study for the purposes of maintaining interpretability and initial exploration of the relationships between the independent input and the dependent outcome variables. Future research in this area may make use of ordinal logistic regression in order to better understand these relationships.
Conclusions
We found that larger teams are associated with increased performance on IRAT and TRAT. Although several statistically significant relationships between team size and academic performance were observed, the explanatory power of these relationships was generally low. We also found conflicting results regarding the relationship between classroom location and subsequent TBL and exam performance, reaffirming the need to further study team sizes and seat selection specifically within the medical student population. No significant relationships were observed between team size or classroom location and exam scores, suggesting that exam scores are likely impacted by additional factors such as individual study time. The observation that IRAT scores predicted exam performance only in the 2023-2024 cohorts underscores the variability of early assessment tools as predictors of final outcomes. While our study suggests that larger teams may improve performance on some assessments, their impact on long-term academic success is less clear. Educators may also consider how team size influences peer interactions, engagement with material, and success on clinical application exercises. Importantly, this research addresses a gap in the literature by examining the combined use of CBL and TBL in medical education, which have been studied separately, but rarely together. For medical schools adopting these methodologies, this work points to a need for ongoing data collection, review, and analysis to fully understand the benefits and potential unintended consequences of these active learning methodologies.
Footnotes
Acknowledgments
The authors would like to thank the medical students whose educational data was used in this study.
Author Contributions
CAE served as primary advisor, critically reviewed the study proposal, and provided overall guidance throughout. AMT designed the project, was the lead investigator and contributed to writing the original draft. KADP contributed to writing the original draft. TS analyzed and interpreted the student data and contributed to writing the original draft. KLK and CH contributed to overall study design. All authors contributed to revisions and editing the manuscript. All authors read and approved the final manuscript.
Funding
The authors received no financial support for the research, authorship, and/or publication of this article.
Declaration of conflicting interests
The authors declared no potential conflicts of interest with respect to the research, authorship, and/or publication of this article.
Data availability statement
The data that support the findings of this study are available on request form the corresponding author. The data are not publicly available due to privacy or ethical restrictions.
Appendix A