
Abstract
OBJECTIVES
In-training examinations (ITEs) are a popular teaching tool for certification programs. This study examines the relationship between examinees’ performance on the National Commission for Certification of Anesthesiologist Assistants (NCCAA) ITE and the high-stakes NCCAA Certification Examination.
METHODS
We utilized a mixed-methods approach in our study. Before estimating the models for the predictive validity study, a series of interviews with program directors were conducted to discuss the role of the ITE in students’ education. Multiple linear regression analysis was then used to assess the strength of the relationship between the ITE and Certification Examination scores, while considering the percentage of program examinees completed in their anesthesiologist assistant program between their ITE and Certification Examination attempts. Logistic regression analysis was used to estimate the probability of passing the Certification Examination as a function of ITE score.
RESULTS
Interviews with program directors confirmed that the ITE provided a valuable testing experience for students and highlighted the areas where students need to focus. Moreover, both the ITE score and the percentage of the program between exams were deemed statistically significant predictors for Certification Examination scores. The logistic regression model indicated that higher scores on the ITE implied a higher probability of passing the Certification Examination.
CONCLUSION
This research demonstrated the high predictive validity of the ITE examination scores in predicting the Certification Examination outcomes. Together with the proportion of the program covered between exams, the variables explain a significant amount of variability in Certification Examination scores. The ITE feedback helped students assess their preparedness and better focus their studies for the high-stakes certification examination for the profession.
Keywords
Objectives
In-training examinations (ITEs) have become a popular teaching and assessment tool for many areas of medical specialization. Studies conducted by several organizations of physicians and allied health professionals demonstrated the high predictive power of a comprehensive ITE for the subsequent certification-level examination. In addition, most studies supported the utility of ITEs as an essential self-assessment tool for preparing candidates for the high-stakes certification test required for practicing the profession in their medical field.1–15 The current research investigates whether the ITE for anesthesiologist assistants is an effective tool to prepare students for their national certification examination, which is administered by the National Commission for Certification of Anesthesiologist Assistants (NCCAA).
The NBME helped the NCCAA develop, administer, and score the Certification Examination from 1992 to 2021 and the ITE from 2014 to 2019. The scoring method used for both examination programs is similar. Examinees receive percent correct scores based on all scored items on the examination and subscores reflecting performance across different content areas. The annual statistical analyses of scores on ITE and Certification Examinations over the study period show that both assessments consistently perform well from a psychometric standpoint; reliabilities of both the ITE and Certification Examination, as measured by coefficient alpha, consistently exceeded .8, and both exams have similarly high average item discrimination measures. The ITE was administered at the same time of year for all programs, but its timing in the program's educational sequence varied due to differences in the curricula.
We examine the hypothesis that students’ performance on the ITE can predict their subsequent performance on the Certification Examination while moderated by the ITE's timing in their academic program. Additionally, we investigate whether students with a more significant percentage of coursework or practicum work to cover after the ITE but before the Certification Examination have a more substantial or differential performance increase than those with less material to cover before the Certification Examination.
Methods
Psychometricians at NBME (Philadelphia, PA) and the NCCAA Certification Examination Committee (Florence, KY) conducted the study retrospectively using test scores and program information. Our mixed-methods research was comprised of two parts.
Qualitative study
In the first qualitative part of our study, we conducted a series of semi-structured, 1-hour interviews with program directors. The purpose of the interview process was to collect information about the usage of the ITE by programs, the timing of the examination, the proportion of content covered by the program before ITE, and the remediation work that followed. The questionnaire was reviewed and approved by the NCCAA and sent to participants ahead of time (see Online Appendix S1 for a copy of the questionnaire). Eleven out of 12 program directors provided their responses (92%). The interview data were used to inform statistical models estimated in the second quantitative part of the study.
Quantitative study: statistical analysis
In the second quantitative part of the study, we applied linear and logistic regression models to investigate the strength of the relationship between ITE and Certification Examination scores and whether that relationship was moderated by the percentage of program examinees completed in their anesthesiologist assistant program between their ITE and Certification Examination attempts. We used a significance level of .05 for the models we tested.
Linear regression models
We estimated a series of nested linear regression models using the ITE score and the percentage of the program between the ITE and Certification Examination as predictors. To reduce multicollinearity and test for a significant interaction, both predictor variables were centered before including them in the models.
16
The baseline model with only the ITE score predicting the Certification Examination score was Model 1A:

To test the hypothesis that the percentage of program completed between the ITE and Certification Examination attempts predicted additional variation in Certification Examination scores, we added the Percentage of the Program between ITE and Cert (Perc_Prog) to our model, as reflected in Model 1B:

The full model (Model 1C) examined whether examinees with different percentages of the program between ITE and Certification attempts had a differential relationship between ITE scores and Certification scores. That is, we wanted to test whether the two sets of scores have a stronger or weaker relationship depending on the amount of additional learning time in the program between the two examinations. It was hypothesized that the interaction between ITE scores and Percent of Program could explain other significant variation in Certification scores, above and beyond, including the two main effects (ie, ITE_score and Perc_Prog), as expressed in Model 1C:

Logistic regression model
To investigate whether the ITE score successfully predicted examinees’ Pass/Fail outcomes for the Certification Examination, we also estimated the logistic regression model with the ITE score as a predictor (Model 2):

Results
Qualitative study: program director interviews
We facilitated structured interviews with each of the program directors over Zoom. Results are summarized below and were synthesized to determine the appropriate impacts on our quantitative analyses (the second part of our research). Summaries of the qualitative data were cross-validated by researchers independently compiling notes based on the videos of the interviews and cross-referencing for consistency.
Usefulness of ITE
Most program directors noted the high value of the ITE for introducing students to the computer-based format of the Certification Examination and the content on which they would be assessed. As was mentioned in several interviews, the ITE provided a valuable testing experience. In preparing for the Certification Examination, the ITE helped students see areas where they needed to focus and assisted the faculty in preparing individualized study plans. One of the program directors remarked that the effect of taking the ITE “can be fairly transformational for some students.”
Several program directors noted that ITE results were helpful to them in assessing their curriculum breadth and depth. Feedback reports provided to the program directors after the exam administration were used to compare their students’ performance to that of the national group and to adjust the curriculum, if necessary. One other program director said that the results of the ITE helped faculty and program directors “gauge their program performance” and assess their curriculum strengths and weaknesses. The overwhelming majority of program directors described the ITE as a helpful practice test that helped students better prepare for the high-stakes Certification Examination. For many programs, results provided a benchmark for where students are with their content knowledge when sitting for the ITE.
Most program directors said the ITE served as a stimulus that encouraged their students to begin more directed exam preparation and create an effective study plan. Reviewing the results of the ITE with faculty and mentors helped students identify their strengths and weaknesses and refine exam preparation techniques. Program directors noted in the interviews that discussions of results with the students helped focus the exam preparation on specific areas where exam performance was lower than expected or those that still needed to be studied.
Impact of qualitative results on quantitative study
Results from the interviews supported analyzing the data from all programs when comparing ITE and Certification Examination scores. Each program director provided information about the length of their program (in months) and when their examinees would typically complete the ITE and Certification Examination in the sequence of their program, which varied by program. These pieces of data were ultimately used as part of the regression models and to exclude examinees that were not in a standard testing sequence from the study.
Interviews pointed to the differences in additional coursework completed between the two exams across programs. Hence, we included an additional predictor in the model to account for it. Interestingly, one program director mentioned that their program does not rely on the ITE results for formal remediation (ie, remediation based on ITE is completed based on the desire of the individual students) due to the lack of data supporting that ITE performance was related to Certification Examination performance. The regression results we present in this study provide this desired predictive validity evidence for the ITE.
Quantitative study: regression analyses
Table 1 shows the key statistics for scores for both examinations by form and overall. The correlation coefficient between the ITE and Certification Examination scores was estimated as .627 (p < .001). Because correlations within samples were highly similar (.65 and .64 for Forms 1 and 2, respectively), the scatterplot of ITE versus Certification Examination scores is shown for the total sample in Figure 1.

Scatterplot of ITE and Certification Examination scores for the total sample (N = 1193).
Descriptive statistics for independent variables.

Note. Examinees with missing data on modeled variables were excluded from the sample.
The distribution of the score change between examinees’ Certification Examination and ITE scores is displayed for the total sample in Figure 2. It can be noted from Figure 2 that percent correct scores increased from the ITE to the Certification Examination for most examinees. The large proportion of examinees with a positive increase in scores is likely due to the intense studying in the last year of the NCCAA program and concentrated preparation for the Certification Examination.

Score change from the ITE to Certification Examination for the total sample (N = 1193).
As noted earlier, the timing of the ITE was uneven across the programs, and the time intervals between the ITE and the Certification Examination varied across programs (see Table 1). Thus, students from different programs had different amounts of time left in their studies following their ITE attempt to prepare for the high-stakes certification examination. The average percentage of the curriculum covered between the ITE administration and the Certification Examination was 40% (SD = 8%), ranging between 14% and 67%.
Linear regression analyses
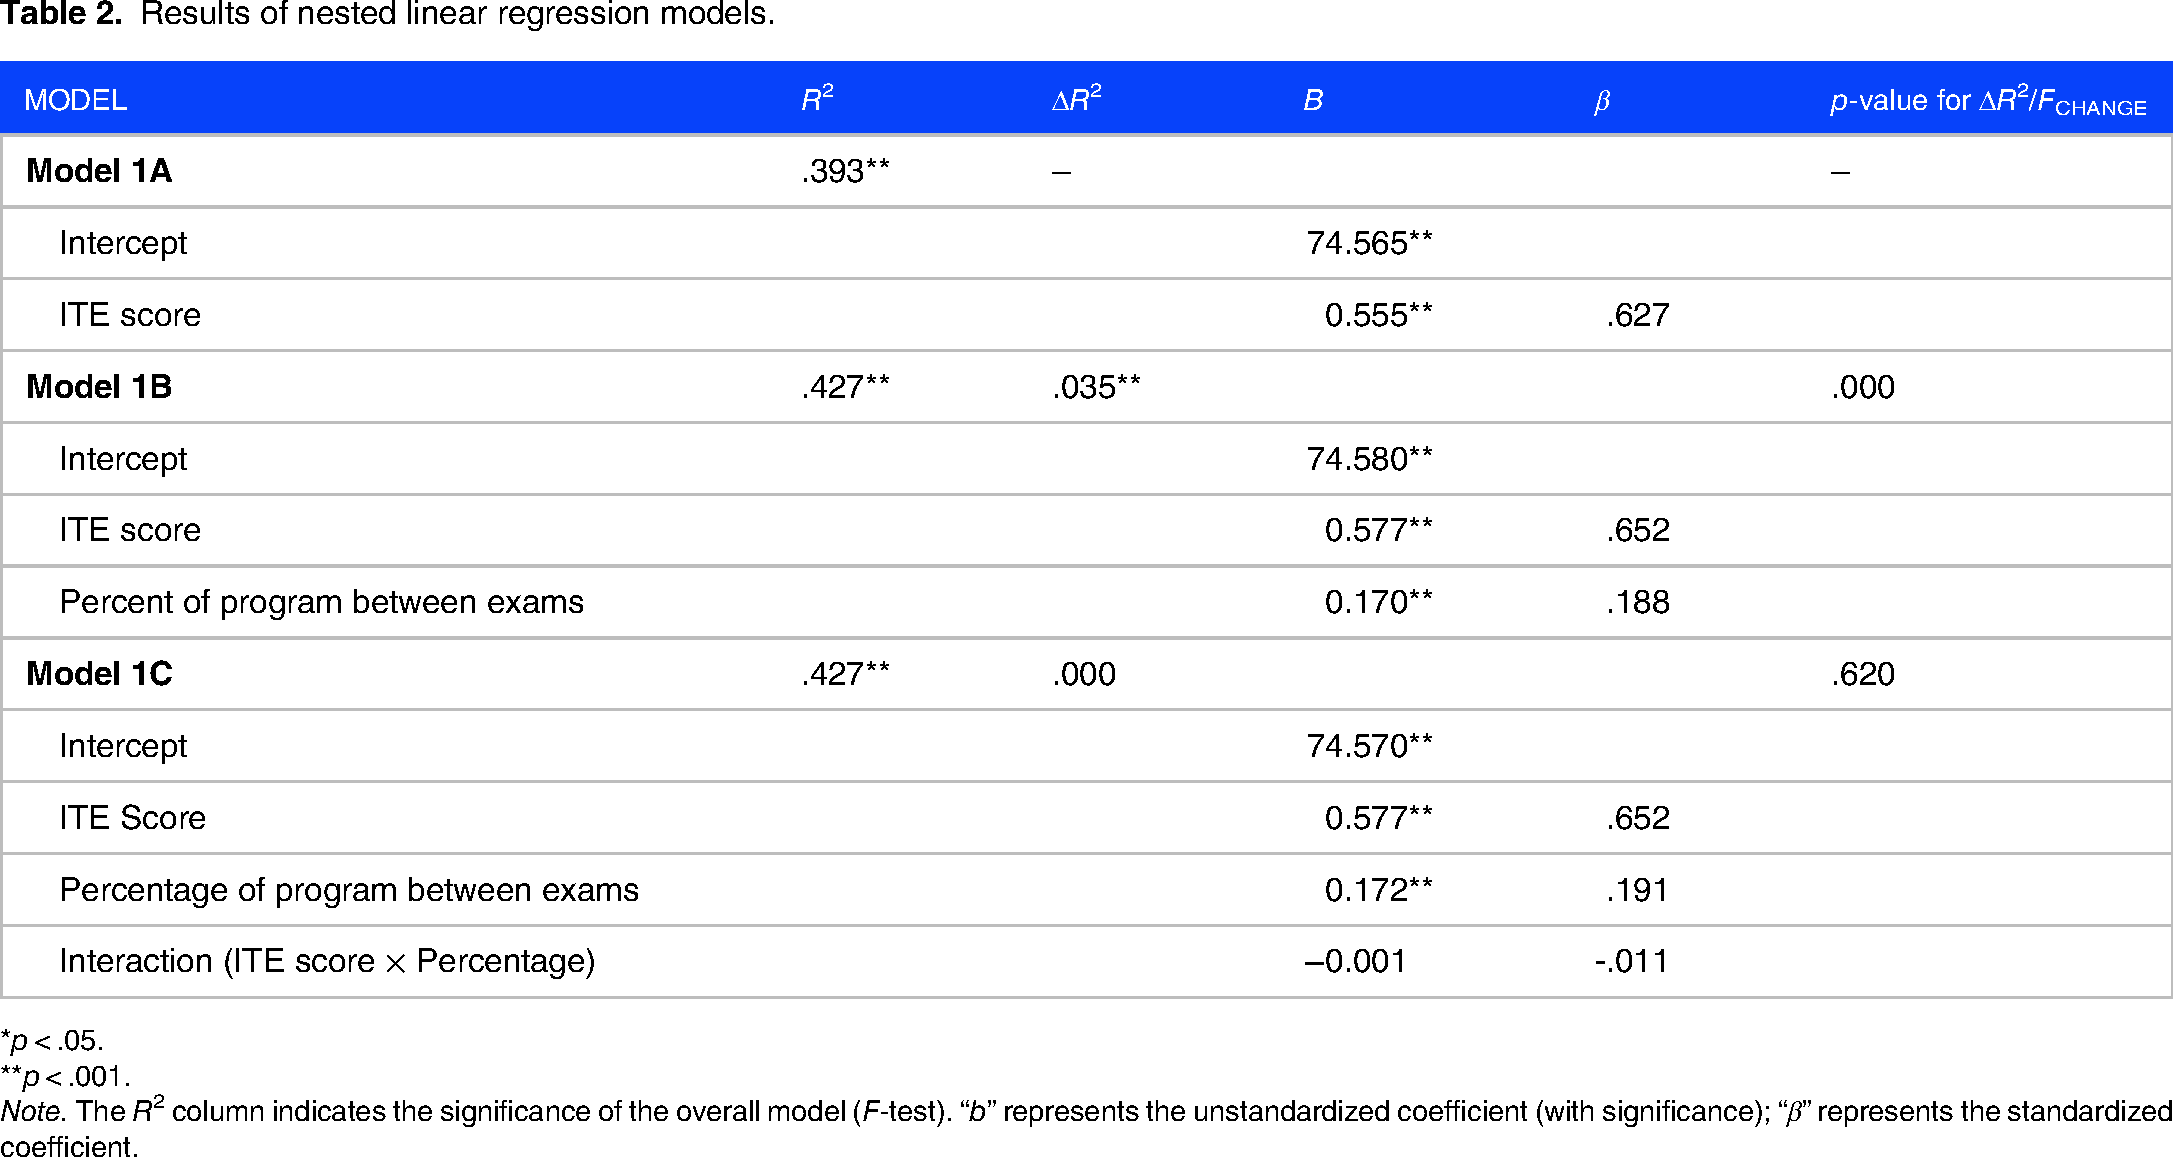
The nested linear regression models were first estimated separately by form. Because the results were highly similar for each form, results are presented based on the total sample to avoid overinterpretation of any minor differences in the relationships at a form level and support generalizability to future forms (see Table 2).
Results of nested linear regression models.
*p < .05.
**p < .001.
Note. The R2 column indicates the significance of the overall model (F-test). “b” represents the unstandardized coefficient (with significance); “β” represents the standardized coefficient.
All three linear regression models were statistically significant. Adding the variable representing the percentage of the program covered between the ITE and Certification Examination in Model 1B explained a considerable amount of additional variation beyond ITE scores alone in predicting Certification scores (ΔR2 = .035, Fchange = 71.824, p = .000 for Model 1B to 1A, see Table 2). However, as can be seen in Table 2, incorporating the interaction term (Model 1C) did not explain significant variation in Certification Examination scores above and beyond the inclusion of ITE exam scores and percentage of the program between the exams (ΔR2 = .000, Fchange = .247, p = .620 for Model 1C to 1B). Therefore, we championed Model 1B as the most appropriate model to describe the relationships between these variables. Parameters for this model with ITE scores and percentage of the program between exams are summarized below. The coefficient R2 estimates the proportion of variance explained by the final championed model using the ITE score and the percentage of program completed between the two exams as linear predictors. The R2 coefficient for this model was estimated at .427. Therefore, approximately 43% of the total variance in Certification scores was explained in the final model. The power of final regression tests for both forms was estimated as equal to 1.0 using the G*Power application. 17
Because the predictor variables were centered, the intercept shows that the expected Certification Examination score for an examinee with an ITE score equal to the average ITE score of 58% correct would be 75%. The positive values of regression coefficients for predictor variables indicate that, on average, Certification Examination scores will be higher for students with higher ITE scores and a longer percentage of the program between the two examinations, holding the other predictor constant. For example, one percentage point increase in an examinee's ITE score corresponds to a 0.577% increase in their Certification score when controlling for the percentage of program completed between the two exams.
Logistic regression analyses
It is often of interest to program directors to estimate the likelihood of passing the Certification Examination given the ITE score. As with the linear regression analyses, the logistic analyses were first evaluated by form. Results for the logistic regression were different by form and therefore are presented in Table 3 for both forms. Model 2 was statistically significant for both samples of examinees who saw Form 1 and Form 2, according to the Chi-squared statistic. The coefficients with ITE score were estimated using Wald statistics (df = 1) at the .001 significance level and were positive. As the ITE score increases, students are more likely to pass the Certification Examination. The log odds ratio estimates were equal to 1.279 and 1.251, respectively. Model 2 predicted pass/fail results correctly for 95.9% of Form 1 and 96.0% of Form 2. The Nagelkerke pseudo Chi-squared statistics were .290 and .267 for Forms 1 and 2, respectively. The log odds ratio interpretation suggests that an increase of 1% correct score point on the ITE will increase the log-odds ratio by .246 for Form 1 and .224 for Form 2. This translates to an increase in the odds of passing the Certification Examination by exp(0.246) = 1.279 and exp(0.224) = 1.251 for Forms 1 and 2, respectively. In other words, these results suggest an approximately 27.9% increase in the odds of passing the exam for Form 1 and a 25.1% increase in the odds of passing for Form 2 with each percentage point increase in the ITE score. Finally, the power of the logistic regression model fit was estimated using α-level (.05), sample size, and odds ratio for each form, yielding statistically acceptable values of .81 and .79. 17
Results of logistic regression model.

*p < .05.
**p < .001.
Figure 3 provides a graph plotting the probability of passing the Certification Examination as a function of the ITE score for both forms. It can be seen from the graphs that the red curve is positioned below the blue curve on the whole range of ITE scores, indicating that the second form was somewhat easier than the first one (assuming the samples included equally skilled examinees, as we would anticipate). For example, a 50% score earned on the second form of the ITE exam (red curve) indicates an 87% chance of passing the Certification Examination. In comparison, a 50% score on the first form suggests at least a 95% chance of passing the Certification Examination. Despite some differences in form difficulty, the predicted probabilities of passing converge at 65%, at which point examinees have an anticipated 100% chance of passing the Certification Examination on either form.

Probability of passing the Certification Examination based on ITE score.
Conclusions
The ITE and Certification Examination scores examined in the study had a strong positive linear association, confirming the observation by the program directors that the better students did on ITE, the better they performed on the Certification Examination. The percentage of the program completed between the ITE and Certification Examinations explained a small but statistically significant increment in variation beyond ITE scores alone. Using this auxiliary program curriculum information, we modeled a more accurate and robust relationship between ITE and Certification Examination scores controlling for the varying percentages of program students completed between the two examinations.
The ITE score significantly predicted the Certification Examination's Pass/Fail result. The graph of the predicted probability of passing, given the ITE score, is helpful to faculty and students in identifying the need to intensify their preparation for the Certification Examination. Additionally, the results of the interviews suggested that the ITE is a useful, practical tool for the programs as they assess the strengths and weaknesses of academic curricula. The results of this study further support the utility of leveraging the ITE results in preparing students for the Certification Examination.
Study limitations
The NBME psychometric team in collaboration with the NCCAA leadership developed the survey used in the study. It was not piloted before being used in the current research.
Supplemental Material
sj-docx-1-mde-10.1177_23821205231179534 - Supplemental material for On the Predictive Power of the In-Training Examination for the Certification of Anesthesiologist Assistants
Supplemental material, sj-docx-1-mde-10.1177_23821205231179534 for On the Predictive Power of the In-Training Examination for the Certification of Anesthesiologist Assistants by Irina Grabovsky, Jerusha J. Henderek, Ulana A. Luciw-Dubas, Brent Pierce, Soren Campbell and Katherine S. Monroe in Journal of Medical Education and Curricular Development
Footnotes
Acknowledgments
The authors wish to acknowledge help from the Program Directors who participated in the interviews and provided valuable information about their educational program and the utility of the ITE in the students’ exam preparation process.
Confidentiality
Examinee data is protected in secure internal servers, and NBME researchers follow organizational security and confidentiality procedures.
Declaration of conflicting interests
The author(s) declared no potential conflicts of interest with respect to the research, authorship, and/or publication of this article.
Ethical approval
This paper is a collaborative effort between the NBME and NCCAA. This research investigates the strength of the predictive relationship between the In-Training Examination for Anesthesiology Assistants and the Certification Examination. This research has been determined by the American Institutes of Research (AIR) as not meeting the federal definition of research with human subjects and is therefore exempt from IRB review and oversight (Project No. EX00398).
Funding
The author(s) received no financial support for the research, authorship, and/or publication of this article
Informed consent
The research sample consisted of 1193 students from 12 Anesthesiology Assistant programs who took the NCCAA ITE between 2014 and 2019 and subsequently took the NCCAA Certification Examination. Examinees who requested their data be withheld from research were excluded. Existing examinee score data from NBME's database were de-identified before being used for this research. Staff members conducted analyses of de-identified data at the NBME in collaboration with the NCCAA. The research team did not utilize identifiable data for their analyses. Standard NBME consent procedures were followed. Program directors consented to the recording of their interviews for use strictly for this research study.
Risk/benefit analysis
This study supports medical education research using the data from administered ITE. There were no added risks to privacy or confidentiality, as individual examinee data is not identifiable.
Supplemental material
Supplemental material for this article is available online.
References
Supplementary Material
Please find the following supplemental material available below.
For Open Access articles published under a Creative Commons License, all supplemental material carries the same license as the article it is associated with.
For non-Open Access articles published, all supplemental material carries a non-exclusive license, and permission requests for re-use of supplemental material or any part of supplemental material shall be sent directly to the copyright owner as specified in the copyright notice associated with the article.