
Abstract
Highlights
This framework is initiated by incorporating model outputs from an epidemic model to a machine learning model.
An informed random forest (RF) is instantiated to model government and public responses to the COVID-19 pandemic.
This framework does not require data transformations, and the epidemic model is shown to boost the RF’s performance.
This is a baseline knowledge-informed learning framework for assessing public health interventions in Botswana.
Keywords
Infectious diseases such as coronavirus disease 2019 (COVID-19) constitute a significant concern worldwide due to their increasing prevalence, associated health risks, and socioeconomic costs. The determinants of a given infectious disease are complex, and they include but are not limited to 1) environmental factors (i.e., weather and climate) and 2) human behavioral characteristics (i.e., public mobility) and political factors such as government policies and interventions. Previous studies have shown that machine learning (ML) models 1 and epidemic compartmental models 2 formulated using deterministic differential equations are the dominant tools for examining, modeling, and analyzing the transmission of infectious diseases.
An ongoing discourse on the mentioned paradigms of modeling highlights the various viewpoints and approaches for epidemiological studies. Although ML models enable the extraction of insights from data, 3 their performance may be inconsistent 4 when exposed to stochasticity, scenarios of an unpredictable nature with data distributions that change over time. This can result in biases due to model drifts 5 that can lead to poor generalization on new cases. 6 Likewise, the capability of epidemic models is constrained to the problem of parameter dimensions and estimation. 2
Currently, discussions persist as to whether knowledge-informed learning (KIL) is a viable avenue to bridge the gap between ML and dynamic models—to inform decision support systems for ML practitioners, policy developers, and decision makers. KIL, 7 also framed as physics-informed ML (PIML), 6 entails the synthesis of multiple viewpoints, principles, and evidence to provide informative priors for modeling. There is no standard method to incorporate prior knowledge in ML.
This research aims to construct a random forest (RF) ensemble 8 informed by the susceptible infected recovery (SIR) model, 9 then test it by conducting a retrospective study of the evolution of the COVID-19 disease. The study objective is 2-fold: 1) to predict new infections using variables that have greater associations to the state of the function dictating the growth rate of COVID-19 cases and 2) to extract the information about the constructed model using variable importance 10 and partial dependence 11 functions. The next section discusses the related literature. The third section presents the methodology to achieve the research aim and objectives. The fourth section presents the findings. The fifth section presents discussions, while the sixth section concludes.
Related Literature
Previous scholars have discussed various approaches of KIL 7 to improve ML models, and they revolve around the use of biases in observations, inductions, and learning. 6 Observational biases 12 can be achieved by introducing data characterizing the underlying dynamic system of interest into an ML model. 6 The inductive bias approach 13 uses mathematical expressions to 1) adapt variables (feature engineering) for data assimilation or augmentation or 2) tailor the model’s structure to satisfy certain physical principles, assumptions, constraints, and boundary conditions. 6 The approach of learning biases implicitly enforces prior knowledge to impose ML constraints by properly penalizing loss functions. 6
Common methods for training, testing, and validating ML models include percentage splitting and cross-validation using a loss function. 14 Strategies for reducing computational time include testing models using only a subset of instances 15 or via online ML using individual instances on the fly. 16 Meanwhile, ML models are known to be prune to concept drifts, phenomena in which relationships between dependent variables and independent variables change over time due to data drifts. 5 The term data drift defines the changes in data distributions (indicated by the model’s variables) over time. 17 As new data accumulate, the model may struggle to maintain accurate predictions, leading to model drifting (reduced performance).
There is not a one-size-fits-all consensus to guide the sampling of data for ML; researchers use different splitting ratios. 14 Moreover, the topic of hyperparameter tuning to optimize loss functions continues to be a longstanding subject in predictive modeling. 18 Loss functions are used to strike a balance between fitting the training data accurately and avoiding model overfitting. 19 Chicco et al. 20 claimed that the coefficient of determination is the only informative metric in regression. To test this claim, this work examines the accuracy, consistency, and interpretability of a default RF 8 and an informed RF (IRF) when exposed to data drifts and stochasticity using standard loss functions, taking COVID-19 as a case study (see Appendix 1).
Current PIML literature is focused on deep learning models, 6 while the scope of RF is less explored despite its successful applications. 21 To support this premise, the following search string “TS = (COVID-19 and Random Forest (RF)) and English (Languages)” was used to extract related work from the Web of Science collections, focusing on the RF applications in addressing COVID-19. Only 3 of 8 publications22–24 met our criteria. We also queried ScienceDirect using the following search string: “TS = (COVID-19 and Random Forest) and TS = (prediction or forecast) and TS = (regression),” focusing on English as a language, and retrieved 1 of 33 publications (see Table 1 and Table 4 in the Appendices).
Related Work on Applications of the Random Forest (RF) for COVID-19 Based on Web of Science and Science Direct

The output from the search process supports Biau and Scornet 26 in that there is a lack of agreement regarding the optimal parameters of the RF. For instance, Biau and Scornet 26 noted that the forest’s variance decreases as the number of trees grows, while accurate predictions are likely to be obtained by choosing a large number of trees. Meanwhile, Díaz-Uriarte and Alvarez de Andrés 21 argued that the value for the number of trees is irrelevant. In terms of the number of variables tried at split nodes of a tree, Díaz-Uriarte and Alvarez de Andrés 21 argued that it has a little impact on the performance of the RF and that larger values may be associated with a reduction in the RF’s predictive performance. Likewise, Genuer et al. 27 claimed that the default value is either optimal or too small.
Bentéjac et al. 28 compared the performance of the XGBoost, LightGBM, CatBoost, and the RF on 28 different data sets using default and tuned settings. They found that the differences in terms of generalization accuracy of the configured versions was small. Bentéjac et al. 28 found that default versions of the RF and CatBoost produced consistent and stable results compared with their tuned counterparts. Szczepanek 29 made the same remark after comparing default settings for XGBoost, LGBoost, CatBoost, and RF in forecasting stream-flow in mountainous catchment. We chose to use the RF since it has few arguments to tune and can perform well in both default and tuned settings, 30 with the following contribution:
This work focuses on investigating and evaluating the performance of a RF ensemble to allow a thorough analysis and understanding of its behavior, strengths, and limitations using real data. This is expected to provide insights into its accuracy and consistency under different time frames in the presence of data drifts and prior domain knowledge.
We integrate the basic principles of observational bias and induction bias to optimize loss functions used to evaluate the default RF algorithm, showcasing its performance in predicting COVID-19 cases in the context of Botswana.
This analysis can inform technology transfer when incorporating known principles to enhance interpretability of ML.
Methodology
Data Collection and Understanding
The Google mobility indices used to indicate visits to public places are
31
1) retail and recreation, 2) grocery and pharmacy stores, 3) transit stations, 4) parks and outdoor spaces, 5) workplace visitors, and 6) residential. The economic indices include 1) income support and 2) debt and contract relief. Epidemiological indices are 1) new COVID-19 cases, 2) smoothed new COVID-19 tests, 3) total COVID-19 cases, 4) effective reproduction rate
The Containment and Health Index (CHI), adapted from the SI, was used to aggregate the effectiveness of containment measures and health regulations comprising public information campaign, face coverings, school closing, workplace closures, cancellation of public events, cancel public gatherings, restrictions on gathering size, travel restrictions, international travel controls, close public transport, restrictions on internal movement, stay-at-home requirements, contact tracing, and vaccination availability. To introduce observational biases to the RF model, we use the effective reproductive rate
List of Variables Sourced from Multidomains, with the Time Frame of Observation and the Number of Missing Values

OXCGRT, Oxford COVID-19 Government Response Tracker; WHO, World Health Organization.
Table 2 shows the variables used in this work; the right-most column reports the number of missing values in the data set. Missing values indicate that the event did not occur or say the count is zero. The positive rate index has
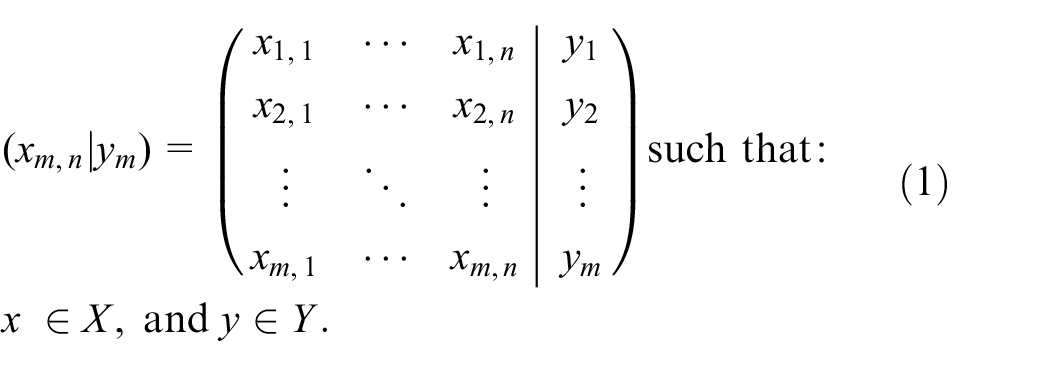
Hence, we use a structured labeled data set
Informed Machine Learning
Data sampling
The RF is trained and validated on data in a sequential order, with each time frame building upon the previous one. The process of training, testing, and validating the constructed RF model has 3 phases as follows 36 :
Training: The informed RF is trained on a partition of labeled data set, of
Testing: The model’s hyperparameters are fine-tuned based on its performance on a separate testing data set (out of bag), a
Validation: The model is evaluated on a completely separate (extra) data set that it has never encountered before. This validation data set is optional 14 to provide an unbiased assessment of the model’s performance on new (unseen) data.
Mathematical statement
Our task is to build a regression
Random forest
A RF algorithm is one of the widely used ensemble models in practice.8,14,26,37 The RF ensemble is a decision tree (DT)–based model aimed at improving model accuracy and robustness.
14
A DT uses a tree like structure,
38
in which each node denotes a decision based on the values of

A tree structure with the root node on the left, branches in the middle, and leaf nodes on the right. Every instance in the training data set must end up in 1 and only 1 leaf node. Leaf nodes are collectors of instances matching the decision tree rules.
DTs are built recursively by splitting

where

Here,
We chose the RF for several reasons: 1) reproducibility, it has few arguments to tune 26 and is easy to reproduce; 2) uncertainty quantification, as an ensemble, a RF uses aggregations to reduce overfitting, thus improving generalization performance 8 ; 3) scalability, it also scales well with varying sample sizes and high-dimensional spaces, 8 and robustness, it is a nonparametric model and hence not sensitive to assumptions about data distributions37,39; and 4) model interpretability, lost in the RF compared with DT, 14 we circumvented this problem using post hoc interpretations such as variable importance 37 and partial dependence functions. 11 The SIR model is deployed to inform the RF ensemble.
SIR model
The SIR model is used to understand the dynamics of infectious diseases in a population of size


where
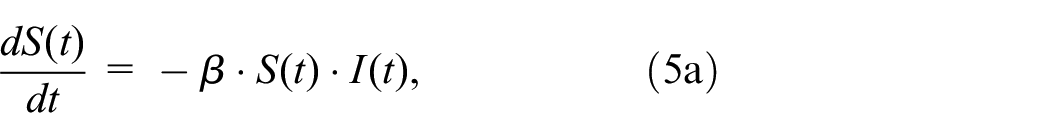


We extend the SIR model to include vaccinations (V) and hospitalizations (H) to get 5 compartments

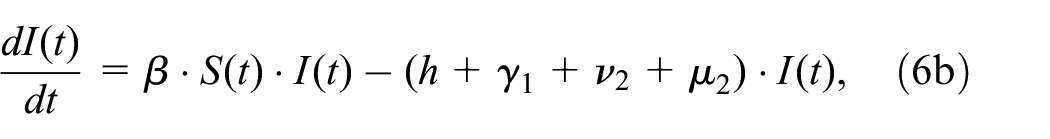
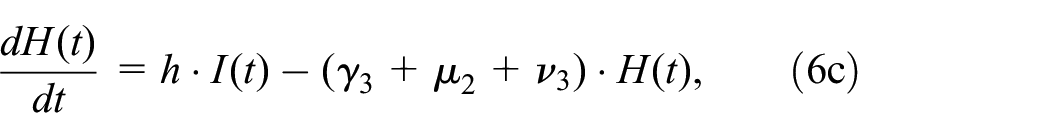
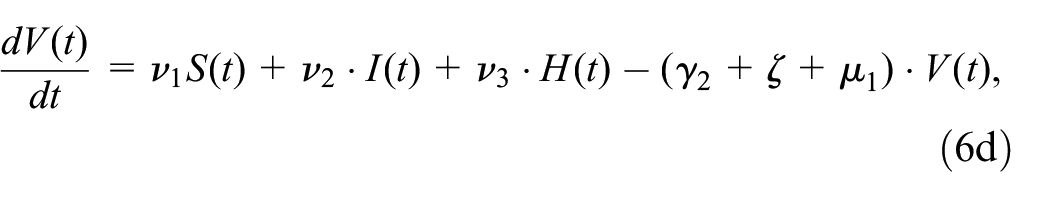

where

The basic susceptible infectious removed (SIR) model and its modification to accommodate vaccinations and hospitalizations. (a) Basic SIR model. (b) Adapted epidemic disease model (SIRVH).
Effective reproductive rate
This is an estimate of the reproduction rate of COVID-19
32
assuming the transmission rate

where

Using Eq. 6c, we solve

Informed RF Model
Embedding physics principles in to the RF
Our final multidomain data set contains observations for the period from February 17, 2020, to August 10, 2022, with 32 variables (31 independent and 1 dependent) of which
The SI is a mean score
41
computed using the adopted COVID-19 policies

2. The positive rate (PR) is the proportion of conducted COVID-19 tests (SNCT) that yielded a positive (NCCs):

The final data set

Framework for informed RF using outputs from the SIR model and observed data to predict COVID-19 cases.
Model Evaluation Using Loss Functions
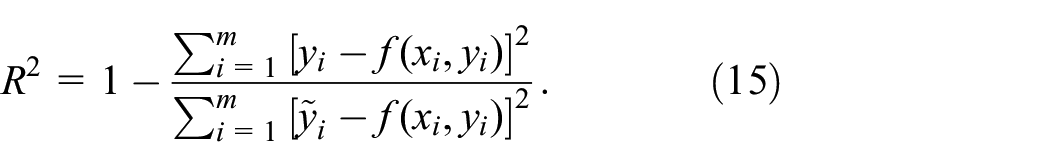
To measure the average magnitude of the differences between the predicted and actual values, we used the coefficient of determination

The MAPE 20 measures the average percentage difference between the predicted values and actual values as:

The SMAPE20,43 is a scale-invariant metric of the average percentage difference between predicted and actual values:

We use the
In this context,
Post Hoc Interpretation
We also used post hoc interpretation to analyze the results generated by the proposed informed RF ensemble as follows.
Variable importance (VI) functions
We used the vip package
10
as an interface to the model-agnostic approach of quantifying how important a given variable

where:
Partial dependence (PD) function
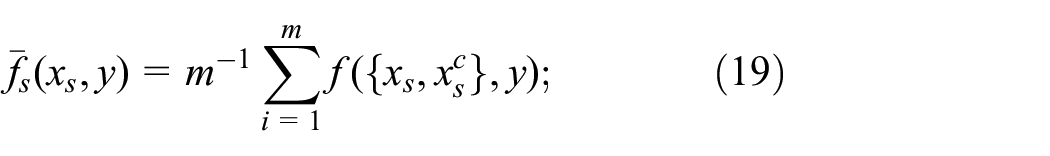
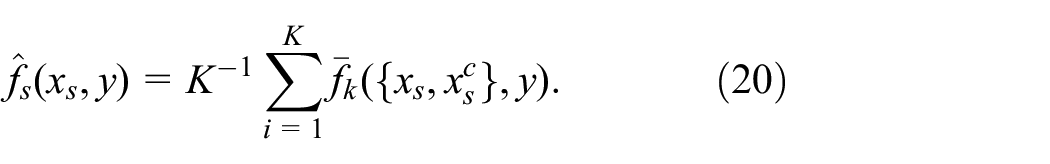
The partial dependence of
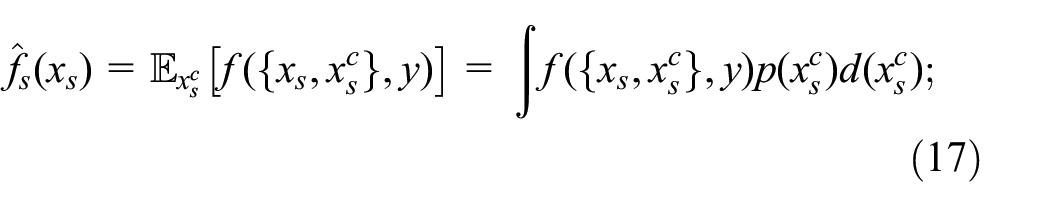
where
Although
where
Friedman
46
argued that taking the marginal distribution instead of the conditional distribution preserves the additive structure in

Correlation Analysis
COVID-19 disease exhibits temporal dynamics in which interventions and their impacts change over time. Thus, we divided the data into batches of differing time frames and then used the Spearman’s rank correlation coefficient 49 to identify the strength and direction of the nonlinear relationship between numerical variables based on the ranks of the data points as:

where
Our design method makes use of a dynamic rolling window approach, in which the RF ensemble is incrementally updated with new modeling data and parameters as the time frame progresses. A window is basically a set of labeled instances defining a context of interest. In our COVID-19 case, the rolling window approach can be considered a form of cross-validation, in which the RF ensemble is trained and validated on different subsets (i.e., by adding or dropping data) from different time frames.
Our tailored algorithm embodies the following ideas from 5 1) modification of the concept description in response to changes in the contents of the window, 2) decision on when and how many old instances to include or delete from the window, and 3) assessment of the relative merits of concept hypothesis. We refer to our strategy as sequential learning with cross-validation (SLCV). The SLCV is useful when evaluating the model’s performance on temporal (time-dependent) data over time. It allows ML practitioners to manually dissect, simulate, and examine how the model would perform when trained and adapted to new data. We use human feedback and annotations to identify the occurrences of context change in our data.
This research methodology received no external funding.
Results
The main question was whether KIL is a viable avenue for bridging the gap between pure ML (i.e., RF) models and dynamic epidemic models (i.e., SIRVH). This is vital to inform decision support systems for ML practitioners, policy developers, and decision makers. The objective was to inform the RF using outputs from the SIRVH model (i.e., the effective reproductive rate) then examine the appropriate loss function to assess the IRF model. This section showcases the performance of the IRF on 2 random data frames; later on, the process is generalized to other data frames.
A data set of
Figure 4 shows that the IRF attained
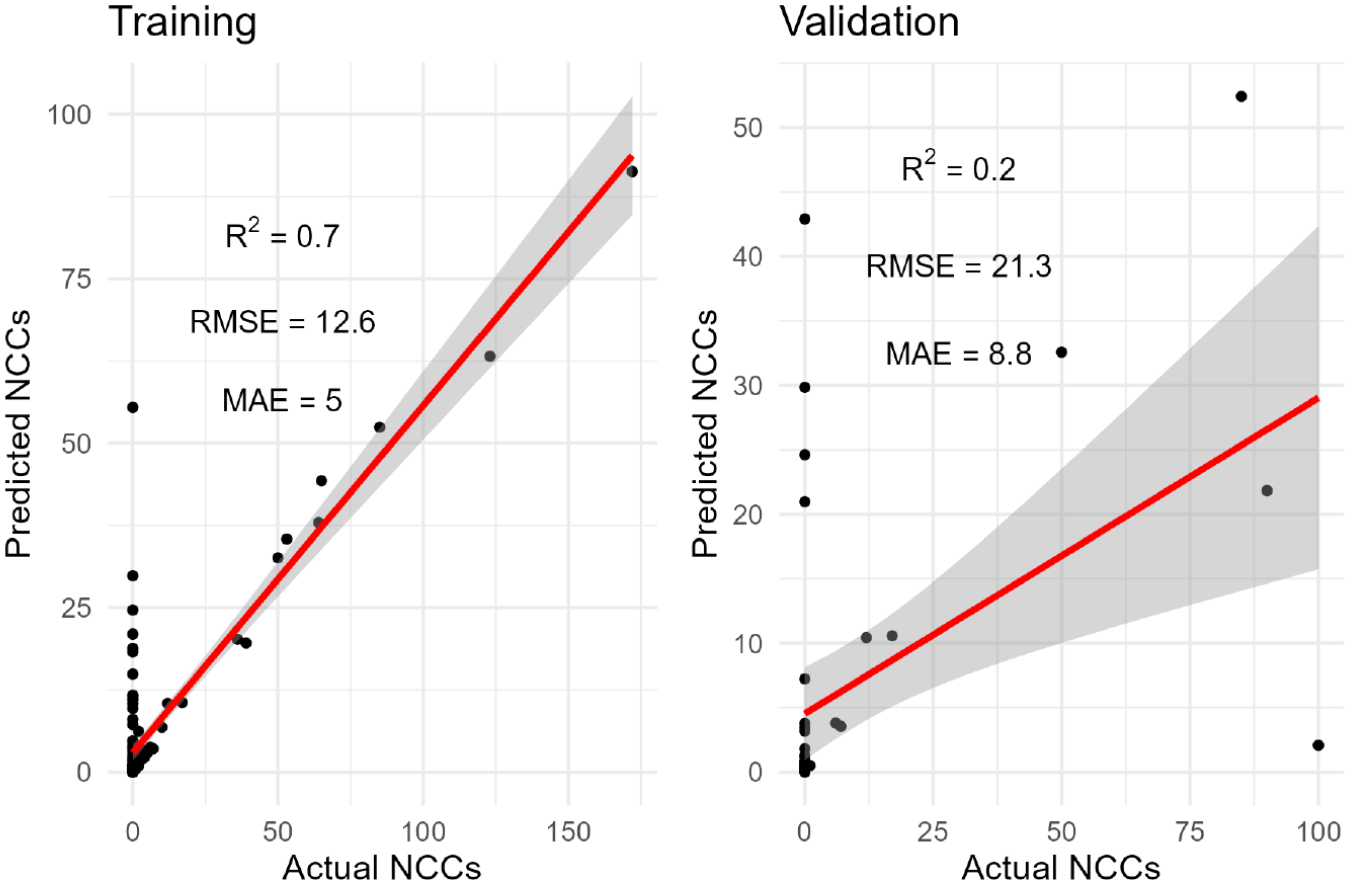
Outputs of the informed random forest on training and validation using the data from February 17, 2020, to August 10, 2020.
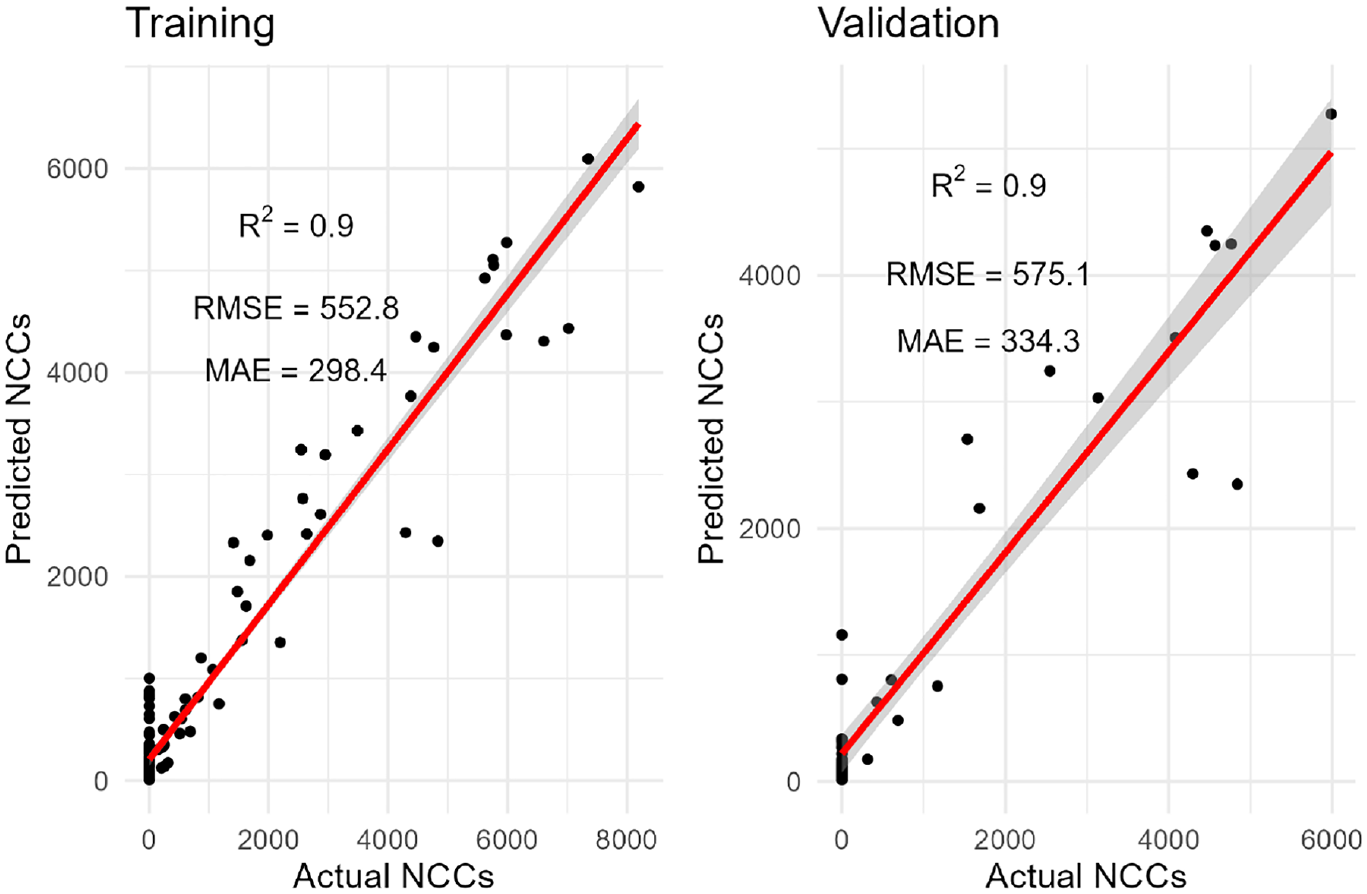
Outputs of the informed random forest on training and validation using data from June 19, 2021, to December 31, 2021.
Using the evidence in Figures 4 and 5, it is impossible to tell whether PIML (i.e., the effective reproductive rate) can improve the performance of a default RF. To further interpret the model outputs, the partial dependence functions are next used to depict relationships between predictors and the target variable, and the process is later on generalized to various data frames.
Dependence of COVID-19 Cases on Adopted Policies and Public Mobility Patterns
Figures 6 and 7 show the top 6 predictor variables of NCCs for 2 randomly selected batches (February 17, 2020, to August 10, 2020 and June 19, 2021, to December 31, 2021). The black line is the PDP trend, which illustrates a fluctuating monotonic relationship between the predictors and NCCs. The blue line shows the smoothed relationship between the predictor and the NCCs. The shaded region around the blue line represents confidence intervals showing the uncertainty in the partial dependence of the predicted NCCs for a particular predictor; a wider shaded region indicates more uncertainty.
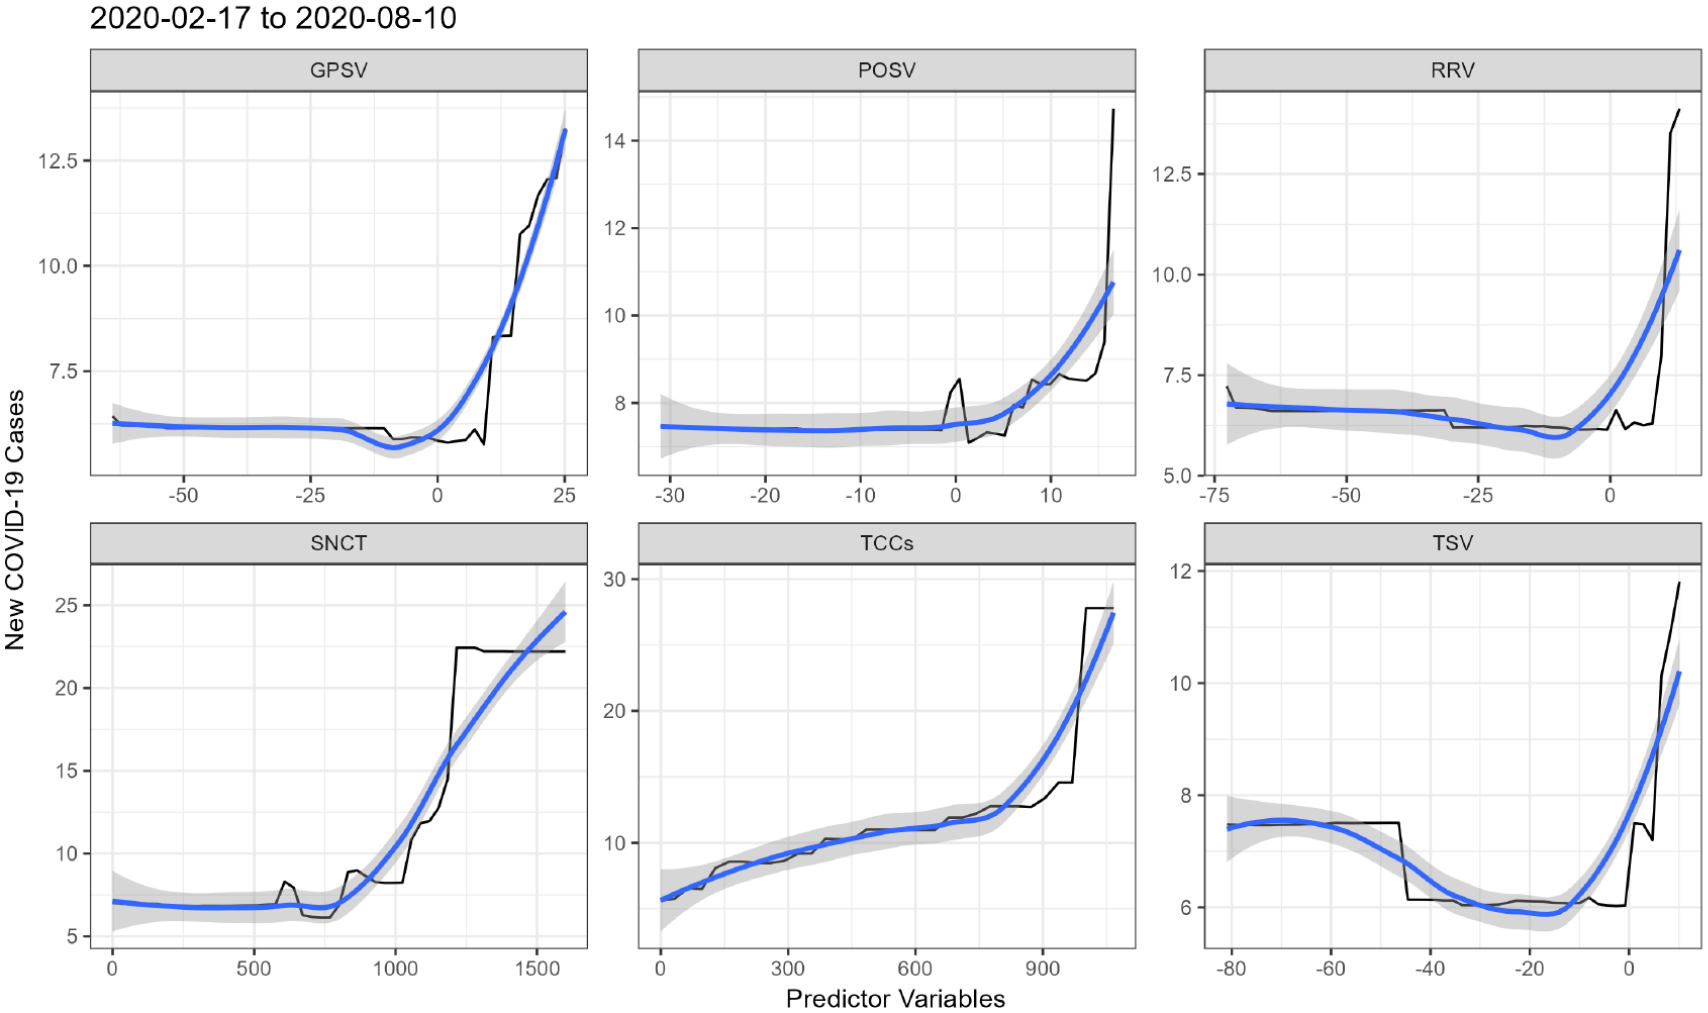
The dependency of predicted new COVID-19 cases (NCCs) on grocery and pharmacy (GPSV), parks and outdoor spaces (POSV), retail and recreation, COVID-19 tests (SNCT), total COVID-19 cases (TCCs), and transit stations (TSV).

The dependency of the predicted new COVID-19 cases on visits to grocery and pharmacy (GPSV), new COVID-19 deaths (NCDs), effective reproductive number (R), residential, retail and recreation (RRV), and transit stations (TSV).
Figure 6 reveals that the RF predicts on average low numbers of NCCs when high stringency measures such as lockdown (indicated by negative values) were adopted to restrict visits to public places like groceries and pharmacy stores (GPSV), parks and outdoor spaces (POSV), retail and recreation spaces (RRV), and transit stations (TSV). However, the number of predicted NCCs increased when restrictions on public mobility were relaxed. Likewise, the more COVID-19 tests (SNCT) were conducted, the more infectious individuals were recorded, which makes sense. Not surprisingly, the number of new cases (NCCs) predicted by the RF increased as the total number of infected individuals (TCCs) increased.
Figure 7 shows that a decrease in the values for mobility indices (i.e., visits to grocery and pharmacy store [GPSV], transit stations [TSV], retail and recreation [RRV] is associated with a decrease in the predicted NCCs, but later on, the predicted NCCs increase as these indices increase, and these agree with the reproductive rate (R), as also illustrated in Appendix 3.
Generalization of the Informed RF to Different Time Frames
Figure 8 shows a visual and informative way to intuitively assess the performance of the RF on validation using different time frames. Results show that the RF has captured a significant portion of the underlying relationship between the predictors and the target variable (NCCs). The closeness of the black points to the red line suggests that the IRF’s predictions are accurate and consistent across the entire time span of the data, with the IRF attaining R2 values greater than or equal to 0.7 (except for batch 2). This indicates that the IRF’s predictions are very close to the true values; thus, the IRF is a good fit for our data.
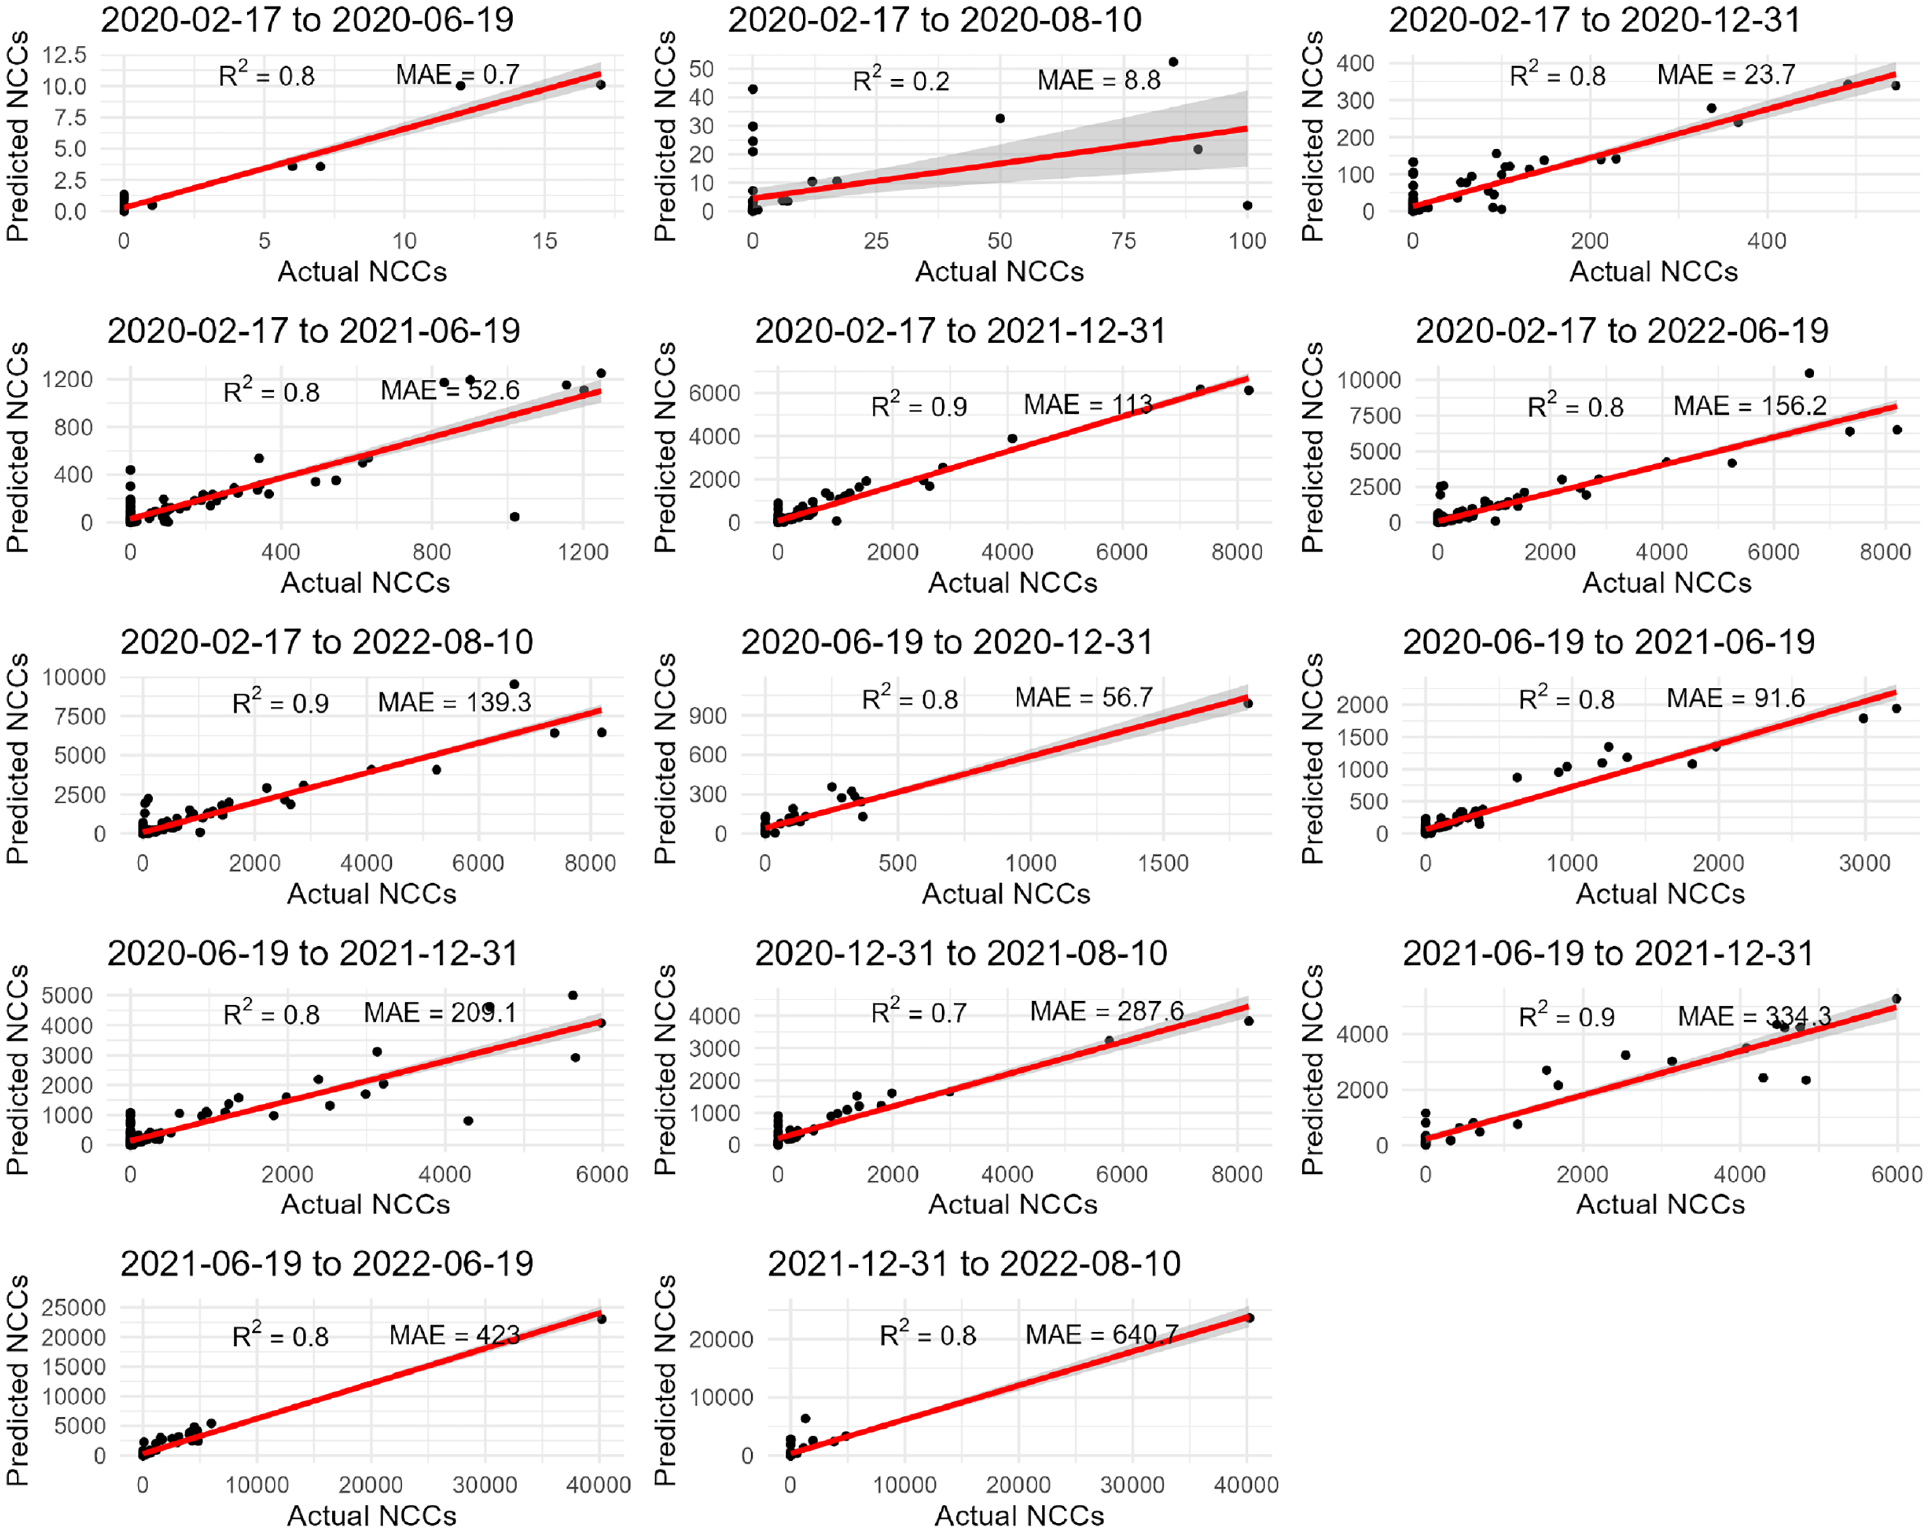
Report on the outputs of the informed random forest model on the validation data using the selected 14 data batches.
Thus, to assess the overall fit of the RF model, we focused on the
Table 3 shows that the default RF performed better when using 0.75 as a splitting ratio by yielding 93%; however, using 0.90 as a splitting ratio yielded the lowest performance (61%). In general, the default RF performs better (84%) when including the effective reproductive rate
Aggregated Results of the Random Forest (

Impact of Adopted Policies and Public Mobility Patterns on COVID-19 Cases
Figure 9 shows that the stay-home requirements (SHR) variable, having a variable importance value of

Importance of variables on predicting new COVID-19 cases (NCCs) with a random forest.
The COVID-19 deaths (NCDs) variable is a strong predictor for NCCs from batch 3 to 14. The prominence of NCDs in these batches suggests that it may contain valuable information for predicting NCCs during these time frames. However, looking at Table 10 and 11 are in the Appendices, we see that a number of COVID-19 waves occurred in these time frames, which were also accompanied by many COVID-19 deaths, and this inflated other variables. The effective reproductive rate
Discussion
We have discussed a basic yet powerful approach of incorporating prior knowledge into a data-driven model. This approach 1) can be instantiated using any supervised ML algorithm. 2) has a post hoc phase that takes into account the effect of each predictor variable on the dependent variable (NCCs) in the model, 3) is consistent and uses the same interpretation regardless of the time frame it is exposed to, and 4) has the potential to help interpret nonlinear interaction effects in the presence of data drifts and outliers. In the end, we built an informed RF to predict the number of new COVID-19 cases for a given location (i.e., Botswana). We chose the RF model due to its ability to handle outliers8,14 that may arise due to novel data drifts.
The approach used so far involves a dynamic and iterative process of training, testing, and validating the RF ensemble using the data sets
Research Contribution
We proposed a reproducible framework for KIL that integrates ML and epidemic model outputs to examine government responses and public responses. This work extends the existing evidence on epidemiology by addressing both prediction and inferences using observational biases (i.e., multiple data sources) and induction biases (feature engineering to generate variables such as SI, CHI, and PR) for data aggregation. Following the evidence in YeŞİlkanat,
36
we note that the default RF performs well in predicting COVID-19 cases with an average of 75%. Using outputs from the SIRVH model (i.e.,
Besides confirming the power of KIL 7 in boosting a default RF ensemble, the steps taken in this work can be packaged into a reproducible framework to help current and future users of ML in identifying appropriate ways to use prior knowledge in mitigating ML challenges (i.e., handling noisy data, missing data, and insuffïcient data) for policy analysis and assessment.
Figure 7 shows that between February 17, 2020, and August 10, 2020, a decrease in mobility indices (i.e., visits to grocery and pharmacy store [GPSV], transit stations [TSV], and retail and recreation [RRV]) was associated with a decrease in the predicted NCCs, but later on, the predicted NCCs increased as these indices increased. The same applies to time period between June 19, 2021, and December 31, 2021, during which an increase in the values for mobility indices (i.e., visits to transit stations and residential, retail, and recreation, see Figure 11; parks and outdoor spaces, see Figure 10) was associated with an increase in the predicted NCCs. This can be attributed to unpredictable public health measures and public responses.
In terms of previous published work on the examination of adopted government policies and their impacts on public mobility and COVID-19 cases, our findings corroborate studies from China, 50 South Korea, 51 and the United States, 52 which reported that stringent COVID-19 policies and mass vaccination campaigns reduced the number of daily COVID-19 new cases and deaths. Such hypotheses are also made for populated countries such as Brazil, China, India, and the United States 53 as well as for low- and middle-income countries (Botswana, India, Jamaica, Mozambique, Namibia, and Ukraine). 54 This work extends the study by Lane et al. 54 by exploring analyses of up to 906 (they used 100) days from the onset of COVID-19.
This study contributes to ongoing debates on the effect of parameter tuning or estimation in the context of RF. Bentéjac et al. 28 compared the performance of the XGBoost, LightGBM, CatBoost, and the RF on 28 different data sets using default and tuned settings and found that default versions of the RF and CatBoost generated consistent and stable results compared with their tuned counterparts. Szczepanek 29 made the same claim after comparing default settings for XGBoost, LGBoost, CatBoost, and RF in forecasting daily stream flow in mountainous catchment. This study confirms the case of a default RF.
The use of MSE, RMSE, and MAPE seems to be less informative when the model is exposed to data drifts (COVID-19 waves). In our case, the RMSE can range from 0.3 to as large as 3075.1 (see Table 12 in the Appendices), indicating that data drifts and outliers have a significant impact on RMSE.14,20 Compared with RMSE, the MAE showed to be more robust to outliers, with values ranging between 0.2 and 834.5 (see Table 12 in the Appendices). We believe that MAE and R2 are more informative and robust to data drifts.
Chicco et al. 20 argued that the MSE, RMSE, MAE, and MAPE are unsuitable for regression analysis. 55 Prior studies suggested the use of R2 because “it considers the distribution of all the ground truth values, and produces a high score only if the model correctly predicts most of the actual values.”20(P. 17) To corroborate such claims, we suggest that R2 is ideal for evaluating the performance of the RF since both R2 and the RF do not require any data transformations. 20 This results in a model that is quick to deploy, guided by prior knowledge, and has evidence to inform policy and decision making in emergency responses.
Lessons Learnt
There is no universal approach to best develop an informed model that is interpretable and efficacious. Different tasks require different approaches. The best strategy might vary across problems, and at times one needs to integrate different actors, tools, methods, and techniques. When fitting KIML models to data containing data drifts, it is essential to use specific expertise (domain knowledge) to inform the choice of appropriate data (observational bias), model structures (induction bias), and the choice and even modification of loss functions (learning bias) to enable model assessment and interpretation (see the “Related Literature” section).
Research Implications
This work shows an efficacious way to combine epidemic model outputs with RF to accurately forecast the complex spatiotemporal dynamics of COVID-19 while capturing key model properties such as consistency, accuracy, and interpretability.
The study contributes to health care by offering insights into relationships between the indices derived based on policies, public mobility, epidemiology, and economic interventions during a pandemic. It provides evidence-based information on the effectiveness of different interventions in reducing the spread of COVID-19 at a national level.
The integration of ML (i.e., RF) and epidemic (i.e., SIRVH) models to examine COVID-19 interventions can contribute to knowledge and technology transfer from research into practice. This can enhance collaboration between ML researchers, health care providers, and policy makers to develop decision support systems for infectious diseases. 56
Research Limitations
The data used is an aggregation of indices from multiple sources, making it difficult to pinpoint data for specific locations (i.e., towns, villages, or districts). Moreover, we used only Google mobility data because they are openly available, making other potential sources to be ignored due to data access implications beyond the researchers’ control. This is a challenge that may lead to selection bias, a scenario in which certain locations are overrepresented or underrepresented.
We used only the RF model for predictions; other ML models of deep learning could be used to enable comparisons.
This work is limited to the batch approach of building RF models in an offline fashion (i.e., using percentage splitting). The proposed IRF uses raw data as they are, which might not accommodate direct integration and comparison with ML models such as ANN and SVM, which require additional data transformation. Likewise, the consolidated information is from public documents, such as government gazettes reporting on the adopted policies; links to the sources could be modified by the time of publication. Finally, the domain knowledge was fuzzy, hence limiting the analyses for inferences. To compensate for this limitation, we collected the data from various sources to complement the extracted evidence.
Generalization, Reliability, and Validity
We used historical data comprising government stringency policies, public mobility indices, economic indices, and epidemiological priors. The distributions of the chosen data sets differ due to evolving factors (i.e., stringency policies and human behavioral changes). To assess external validity, we examined whether a default RF and an IRF can effectively predict the number of COVID-19 cases of different time frames. Specifically, we examined whether the predictions generated by the RF model remain accurate and consistent when applied to shorter and longer time series with different data distributions.
This study showed that both the default RF and the IRF can accurately and consistently capture variations and trends specific to selected data batches of time series with data drifts and outliers (see Figure 8). These findings can be generalized and applied to other domains such as weather forecasting and financial markets, in which the data distributions are characterised by stochasticity.
Conclusions
This study proposed an informed learning approach that integrates ML with an epidemic model to accurately depict, analyze, and infer the dynamics of infectious diseases. For that, we used a case study of COVID-19 disease, incorporating prior knowledge on epidemic modeling into a default RF using known assumptions, mathematical expressions, and equations. We used multidisciplinary indicators that include epidemiological indices, government policies, public mobility, and economic indicators to predict the number of COVID-19 cases. We used the effective reproductive rate to inform the RF and compare it with the default RF. We assessed the models to test and validate their feasibility, predictability, and consistency in the presence of data drifts. Experimental results revealed that both the default and IRF generate accurate and effective results that are consistent in capturing the hidden nonlinear relationships in the presence of stochasticity (i.e., COVID-19 waves). Interestingly, our approach can be easily transferred from research into practice without background knowledge on numerical analysis (i.e., stability conditions) and mathematical optimization. However, the proposed approach needs some technical knowledge of programming and detailed awareness of the functions to process fuzzy data for implementation of the appropriate models using available packages or libraries. This approach can be extended to perform parameter estimation of compartmental models for related infectious diseases. The proposed IRF to analyze and forecast time series provides extracts with potential to improve preparedness and response strategies to health outbreaks. Further investigations are needed (i.e., using transformed data and other ML models, using data from different countries) to strengthen the reliability and validity of this study. Most importantly, this work seeks to motivate multidomain collaboration to inform continuous development of ML-based decision support systems for tracking, monitoring, and assessing health outbreaks and their interventions.
Supplemental Material
sj-docx-1-mpp-10.1177_23814683231218716 – Supplemental material for Informed Random Forest to Model Associations of Epidemiological Priors, Government Policies, and Public Mobility
Supplemental material, sj-docx-1-mpp-10.1177_23814683231218716 for Informed Random Forest to Model Associations of Epidemiological Priors, Government Policies, and Public Mobility by Tsaone Swaabow Thapelo, Dimane Mpoeleng and Gregory Hillhouse in MDM Policy & Practice
Supplemental Material
sj-pdf-2-mpp-10.1177_23814683231218716 – Supplemental material for Informed Random Forest to Model Associations of Epidemiological Priors, Government Policies, and Public Mobility
Supplemental material, sj-pdf-2-mpp-10.1177_23814683231218716 for Informed Random Forest to Model Associations of Epidemiological Priors, Government Policies, and Public Mobility by Tsaone Swaabow Thapelo, Dimane Mpoeleng and Gregory Hillhouse in MDM Policy & Practice
Footnotes
Acknowledgements
We acknowledge Google, for mobility data; the World Health Organization, for health data; and the R community, for R packages. The data used in this work are available online. Any other material will be made available upon request to the first author. Moreover, the code and data will be made available on GitHub upon acceptance.
The authors declared no potential conflicts of interest with respect to the research, authorship, and/or publication of this article. The authors received no financial support for the research, authorship, and/or publication of this article.
Authors’ Contributions
Conceptualization, TST, DM, and GH; methodology, TST; validation, TST, DM, and GH; data analysis, TST; formal analysis, TST, DM, and GH; data curation, TST; writing—original draft preparation, TST; review and editing, TST, DM, and GH; visualization, TST; supervision, DM and GH. All authors have read and agreed to the final version of this article to be published.
References
Supplementary Material
Please find the following supplemental material available below.
For Open Access articles published under a Creative Commons License, all supplemental material carries the same license as the article it is associated with.
For non-Open Access articles published, all supplemental material carries a non-exclusive license, and permission requests for re-use of supplemental material or any part of supplemental material shall be sent directly to the copyright owner as specified in the copyright notice associated with the article.