
Abstract
Highlights
This study uses a mathematical model to compare different adaptive nonpharmaceutical intervention (NPI) strategies for COVID-19 management across 3 dimensions: threshold when the NPI should be implemented, time it takes to implement the NPI, and the effectiveness of the NPI.
All adaptive NPI response scenarios considered substantially reduced peak hospitalizations compared with no response.
Slower NPI implementation results in a somewhat higher peak hospitalization and longer time spent with the NPI in place but may make an adaptive strategy more feasible by allowing the population sufficient time to prepare for changing restrictions.
A stronger, more effective NPI response results in a modest reduction in the time spent under the NPIs and slightly lower peak hospitalizations.
A higher threshold for triggering the NPI delays the time at which the NPI starts but results in a higher peak hospitalization and does not substantially reduce the time the NPI remains in force.
Introduction
Severe acute respiratory syndrome coronavirus 2 (SARS-CoV-2), the virus responsible for coronavirus disease 2019 (COVID-19), has presented an ongoing public health challenge since its emergence in December 2019. In the early stages of the pandemic, nonpharmaceutical interventions (NPIs), such as physical distancing and mask wearing, represented the best available strategies for mitigating the impact of COVID-19. 1 The emergency use authorization of the first COVID-19 vaccine in late 2020 signaled a new phase of the pandemic, with public health strategies expanding to include vaccination.2,3 Optimism surrounding the availability of vaccines has contributed in part to the relaxation of NPIs in many populations.4,5 However, circulation of more transmissible variants (e.g., delta, omicron) and breakthrough cases among vaccinated individuals underscore the necessity of multifaceted prevention strategies.6–8 Even among highly vaccinated populations, outbreaks amidst relaxed NPIs and waning immunity may require renewed actions to control transmission.
At the beginning of the pandemic, many US states issued stay-at-home orders shortly after the first cases of COVID-19 were detected within their borders. 9 These orders were largely intended to be short-lived with the goal of providing health systems with time to increase personal protection equipment supply and expand health care capacity. However, during subsequent COVID-19 waves, measures to combat case growth were often initiated only after health systems had been heavily stressed, if not overwhelmed. To support proactive decision making, mathematical models have been leveraged throughout the pandemic to identify surveillance indicators that may signal when strengthening NPIs is necessary to ensure population health care needs do not exceed health care capacity.10–13 Indeed, this is the premise behind CDC’s “community levels,” which seek to adjust recommended mitigations in a given community based on the danger that local hospital capacity will be overwhelmed. 14
One of the earliest models of COVID-19 transmission estimated peak intensive care unit demand when specific NPIs (e.g., school closures) were implemented upon reaching different surveillance thresholds in a simulated population. 10 Models have subsequently been used as a tool for comparing expected COVID-19 outcomes under longer, less restrictive periods of intervention to outcomes expected under shorter, more restrictive periods of intervention. 11 A number of studies have also highlighted that the timeliness with which NPIs are implemented contributes to their effectiveness.15–17 An adaptive COVID-19 response can thus be distilled down to 3 components: 1) a surveillance indicator threshold at which to implement the NPI, 2) the time needed to implement the NPI, and 3) the effectiveness of the NPI. Previous studies have focused on only a subset of these components in their modeled scenarios (e.g., varying thresholds and NPIs with fixed response time). Importantly, these components are interdependent, and the feasibility of a given adaptive NPI strategy is contingent on resource availability and public adherence, among other factors. In this article, we collectively consider these variables in a series of simulated scenarios designed to highlight pertinent tradeoffs. We then discuss how policy makers can leverage the individual components of an adaptive COVID-19 response to balance public preference and public health goals in designing response policies.
Methods
Overview
We developed a compartmental model of SARS-CoV-2 transmission and downstream health care utilization for the state of Minnesota. Health states in our model consisted of susceptible, exposed, asymptomatically/subclinically infectious, symptomatically infectious, hospitalized without ventilation, hospitalized with ventilation, recovered, and dead. Allowed transitions between health states are depicted in Figure 1. The model was age-stratified to capture age-related heterogeneity in contact patterns, presentation of symptomatic infection, and severity of infection outcomes, such as the likelihood of hospitalization and death. The model was parameterized to reflect the demographics of the state of Minnesota and calibrated to COVID-19 outcomes in Minnesota from March 23, 2020, to August 2, 2020. A comprehensive description of the model and input parameters is provided in the Supplementary Materials. Using the calibrated parameters, the model was used to evaluate COVID-19 outcomes under different adaptive NPI strategies, simulated from September 1, 2020, through March 22, 2021. The model and related analyses were implemented in R version 4.0.3. 18 Model code is available for download at https://github.com/evaenns/Adaptive-COVID19-Mitigation-Strategies-Model.

Model state-transition diagram with susceptible (S), exposed (E1, . . . , E m ), asymptomatically infectious (I A 1, . . . , I An ), symptomatically infectious (I S 1, . . . , I Sn ), hospitalized without mechanical ventilation (H), hospitalized with mechanical ventilation (Vent), recovered (R), and dead (D). The model includes series of m exposed states and n infectious states to reflect incubation and infectious periods that are not exponentially distributed (see Supplementary Materials for details). In the model, patients are stratified into H and Vent states upon admission to the hospital and do not transition between the two states. Patients leave H and Vent states either through discharge (to the recovered R state) or by dying (to the dead D state), with rates that vary by need for mechanical ventilation and age.
Infection and Hospitalization Parameters
Infection progression parameters, including the mean incubation period, mean infectious period, and age-specific proportion of infections that are asymptomatic/subclinical, were estimated from the published literature.19–21 The probability of hospitalization by age group was estimated from data on the age distribution of hospitalized cases in Minnesota and adjusted in model calibration. The probability of requiring mechanical ventilation if hospitalized, the probability of dying following hospitalization with and without mechanical ventilation, and the length of hospital stay with and without mechanical ventilation were estimated, by age, from Minnesota Department of Health surveillance data on hospitalized COVID-19 cases. 22 Notably, hospitalized individuals on a ventilator experienced a longer length of stay and a higher probability of death as compared to hospitalized individuals who required no ventilation, and the risks of hospitalization and death were highest in older age groups.
Transmission Parameters
The rate at which susceptible individuals were infected was the product of the transmission probability per infected contact and the total number of infected contacts per time step. The per-contact probability of infection was estimated through model calibration and was assumed to be the same for both symptomatic and asymptomatic infections. Contact patterns that dictate how different age groups interact with each other, and thus the risk of SARS-CoV-2 transmission, were based on a study that extrapolated the European POLYMOD contact survey data to a US context, balanced to be consistent with the demographics of Minnesota. 23 These contact patterns were assumed to reflect pre-pandemic behaviors. We therefore applied a time-varying, age group–specific set of contact reductions to baseline contact rates to account for changing behavior in response to different levels of restrictions, policies, and recommendations, as described below.
Time-Varying Contact Reductions
Based on the timing of Minnesota’s stay-at-home order (SAH), 24 we defined 3 distinct periods of contact reductions: 1) the model start date up until the start of SAH (March 23, 2020, to March 27, 2020), 2) the SAH order (March 28,2020, to May 18, 2020) and 3) the end of SAH through the end of the calibration period (May 19, 2020, to August 2, 2020). For each time period, we allowed the population to engage in different levels of “effective” contact reductions, which could also differ by age group. We assumed that this effective contact reduction was a combination of behaviors that reduce transmission between contacts (e.g., masking, physical distancing, moving interactions outdoors) and behaviors that reduce the number of daily contacts (e.g., working from home) and varied by age group. Effective contact reductions were applied to the average number of daily pre-pandemic contacts (e.g., a 50% effective contact reduction in an age group with 10 daily contacts reduced the number of daily contacts to 5). These age-specific effective contact reductions were estimated through model calibration.
Adaptive NPI Scenarios
We considered several scenarios to explore how adaptive behavior change in response to rising hospitalizations can affect COVID-19 outcomes in a population. Scenarios consisted of different behavioral assumptions about the level of effective contact reduction that could be induced by the NPI, the trigger at which the NPI is instituted, and the time it takes for the NPI to reach maximum effectiveness. We evaluated scenarios by first simulating COVID-19 outcomes using the calibrated parameter values from March 23, 2020, to August 31, 2020 (assuming that the calibrated parameters estimated for the May 19, 2020, to August 2, 2020, period continued through August 31, 2020) and then implementing the adaptive policy beginning on September 1, 2020, and continuing the simulation through March 22, 2021 (a full year from the start of the model simulation period).
As a baseline, we established a steady-state scenario (scenario A) in which, starting on September 1, 2020, the population maintained an effective contact reduction that produced a relatively constant level of prevalent hospitalizations over time. This steady-state effective contact reduction was estimated in model calibration. We then defined a comparison scenario (scenario B) in which the population experienced COVID fatigue starting on September 1, 2020, represented as a sustained but lower than the steady-state effective contact reduction that produced a dangerously high second wave of prevalent hospitalizations. 25 The extent of COVID fatigue in the population (defined as the difference in effective contact reduction from steady-state levels) was varied in sensitivity analysis.
Scenarios A and B were intended to reflect lower and upper bounds, respectively, of possible outcomes when behavior is consistent over time. We then designed several adaptive behavior change scenarios (scenarios C–F) in which we assumed more restrictive (“on”) levels of effective contact reduction were triggered when defined thresholds on the number of new weekly hospitalizations per 100,000 population were reached. The population started each scenario at the “off” level of effective contact reduction (defined as the COVID fatigue contact reduction maintained in scenario B) on September 1, 2020. If the hospitalization trigger was reached, NPIs were turned “on,” and the population began to move to a more restrictive “on” level of effective contact reduction, with the NPI reaching its full effectiveness after some adjustment period (varied by scenario). The duration of the “on” period was determined by prevalent hospitalizations, with the “on” contact reduction being maintained from the trigger point through the 14th day past the peak in prevalent hospitalizations. A 14-days delay following peak hospitalizations was used to ensure hospital conditions would continue to improve after NPI relaxation and to account for the time needed to identify that hospitalizations have in fact peaked.
Once NPIs were relaxed, the population would begin moving from behavior reflective of the stricter NPI back to the “off” level of effective contact reduction over the adjustment period (assumed to be the same as the adjustment period from “off” to “on”). For simplicity, we assumed that behavior changed linearly over the adjustment period. We assumed a baseline adjustment period of 7 days but also a slower adjustment scenario (14 days; scenario D) and varied the length of the required adjustment period in sensitivity analysis.
We set the effective contact reduction during the NPI “on” period to 80% in the base case, which is the highest level of contact reduction that was estimated in model calibration for any age group in previous time periods. We also considered a scenario with a stronger NPI response during the “on” periods (90% effective contact reduction; scenario E) and varied NPI effectiveness in sensitivity analysis.
The baseline threshold for triggering the “on” contact reduction was 8 new weekly hospitalizations per 100,000 population, which represented the high-risk threshold outlined by state decision makers in Minnesota. 26 We also considered a higher threshold (10 new weekly hospitalizations per 100,000 population; scenario F). Scenario descriptions and parameter settings are summarized in Table 1.
Scenario Definitions a

All scenario simulations begin on September 1, 2020, with nonpharmaceutical interventions “off.”
Model Calibration
The model was calibrated to prevalent hospitalizations, overall and by age group, and cumulative deaths in Minnesota from March 23, 2020, through August 2, 2020. Further, to estimate a contact reduction that would achieve an approximately steady-state level of hospitalizations from September 1, 2020, onward (scenario A), we included an additional calibration target that held hospitalizations constant from August 2, 2020, through early December 2020. Model calibration was conducted using an approximate Bayesian computation method, which generated a posterior sample of parameter sets that were used in scenario analyses.27,28 Additional details can be found in Supplementary Materials.
Outcomes
For each scenario, we calculated the average and 95% credible interval of outcomes of interest. These outcomes included the cumulative proportion of the population infected, the peak number of prevalent hospitalizations, the average duration of “on” and “off” periods, respectively, and the total percentage of time spent with NPIs “on” over the simulated time horizon.
Sensitivity Analysis
Since the initial emergence of COVID-19, numerous variants have evolved with differing levels of transmissibility and severity. Vaccination and widespread prior infection also influence transmission rates and severity of new variants, as does a continuing progression toward pre-pandemic norms of interaction. To gain insight into how changing pandemic conditions might affect the performance of the adaptive NPI scenarios, we conducted 1-way sensitivity analysis on viral transmissibility, severity (in terms of risk of hospitalization), and the level of population COVID fatigue after September 1, 2020.
While the adaptive NPI scenarios were designed to illustrate influences of key response components on outcomes of interest, we also conducted 1-way sensitivity analysis on scenario specifications (level of NPI effectiveness, trigger threshold, and adjustment time) to characterize these influences more systematically.
Each 1-way sensitivity analysis was conducted by varying the parameter of interest over a specified range and, for each value, simulating model outcomes over the posterior sample of calibrated parameter sets. Sensitivity analysis results were summarized as the mean over this posterior sample.
Results
Scenario A (Figure 2), which is not a trigger scenario, represents a steady state in which prevalent hospitalizations remained relatively constant over time with an average maximum of 439 (95% credible interval [CI]: 131–908) hospitalized COVID-19 patients (Table 2), which is lower than or similar to the peak of 731 prevalent hospitalizations during Minnesota’s first wave. This steady state was achieved with an average effective contact reduction of 48.2% (95% CI: 24.2%–64.4%). In contrast, the COVID fatigue scenario B (Figure 2) depicts a significant second wave of hospitalizations for most trajectories that was achieved with a 10-percentage-point absolute decrease from the steady-state effective contact reduction. This resulted in a an average COVID-fatigue effective contact reduction of 38.2% (95% CI: 14.2%–54.4%). This was also the effective contact reduction used during the “off” periods in the adaptative NPI scenarios. While the effective contact reduction in scenario B was just 10 percentage points lower than in scenario A, the average peak in prevalent hospitalizations in scenario B was nearly 5 times greater at 1,968 (95% CI: 501–5,367) hospitalizations.

Prevalent hospitalization trajectories reflecting 95% credible region of postcalibration posterior parameter distributions for nontrigger scenarios. Scenario A reflects a sustained level of contact reduction from September 1, 2020 (MMWR week 36) through the end of the simulated time horizon that maintains a relatively stead level of hospitalizations. Scenario B reflects a COVID fatigue scenario where the population sustains a contact reduction that 0.10 less than the steady-state contact reduction of scenario A.
Model Outcomes from September 1, 2020, through March 22, 2021, for Each Scenario, Averaged over Postcalibration Posterior Parameter Distributions with 95% Credible Intervals Shown in Parentheses
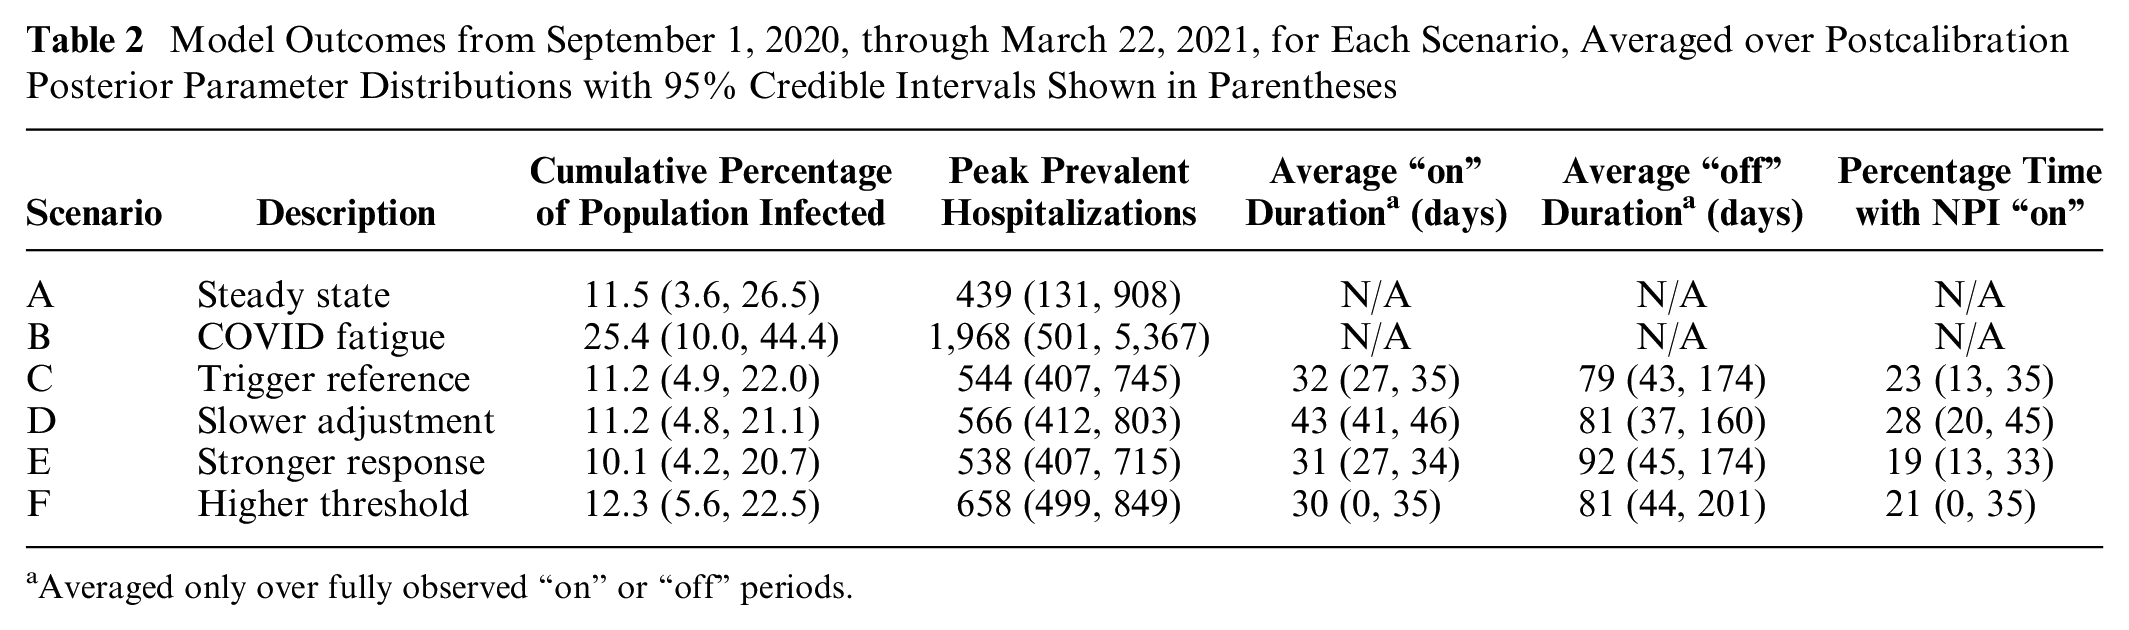
Averaged only over fully observed “on” or “off” periods.
Outcomes for all trigger scenarios are summarized in Table 2. The adaptive action taken in scenario C, our reference trigger scenario, reduced the average peak hospitalizations to 544 (95% CI: 407–745), with NPI “on” periods lasting an average of 32 (95% CI: 27–35) days and 23% (95% CI: 13%–35%) of the simulation period spent with the NPI “on,” on average. If the adjustment period was longer (scenario D), the average hospitalization peak increased slightly, but with significant increases in the required duration of the NPI “on” period. Increasing the effectiveness of the NPI (scenario E) had little effect on the peak hospitalizations but reduced the percentage of time spent with the NPI “on” to 19% (95% CI: 13%–33%). A higher threshold for triggering the NPI (scenario F) achieved a similar reduction in duration of NPI “on” periods as the stronger response (scenario E) but at a much higher average hospitalization peak of 658 (95% CI: 499–849) COVID-19 patients. Similar observations can be drawn from more extensive sensitivity analysis on scenario parameters (effectiveness, threshold, and adjustment time) presented in Supplementary Materials (Figure S3).
One-way sensitivity analyses on epidemiological features of COVID-19, including transmissibility and severity, are presented in Figure 3 for average outcomes of peak prevalent hospitalizations and percentage of time spent with the NPI “on” under scenarios C–F. Higher transmissibility resulted in higher peak hospitalizations and percentage of time spent with the NPI “on” for all scenarios; however, the increase in these outcomes was less pronounced with a more effective NPI response (scenario E). At lower levels of transmissibility, a higher threshold scenario (scenario F) resulted in the highest peak hospitalizations, while at sufficiently high levels of transmissibility, a longer adjustment time (scenario D) resulted in the highest peak, even with the more conservative trigger threshold. Changes in disease severity, reflected in the relative risk of hospitalization compared to the base case, had comparatively little impact on simulated outcomes over the range of values considered, though peak hospitalizations and percentage time with the NPI “on” did increase with increasing hospitalization risks. We also varied the extent to which the population experienced COVID fatigue during the “off” periods. If there was less COVID fatigue from steady state (a −0.05 change in effective contact reduction), all scenarios resulted in similar levels of peak hospitalizations and time spent under the NPI. As COVID fatigue increased (to −0.15 or −0.20 change in effective contact reduction), peak hospitalizations and time spent with the NPI “on” increased for all scenarios, but there was also a greater divergence in outcomes between scenarios, with a more effective NPI scenario (scenario E) resulting in the least increase in both outcomes. Time spent with the NPI “on” increased the most for the slower adjustment scenario (scenario D), while peak hospitalizations was highest for the higher threshold scenario (scenario F).

Sensitivity analysis on epidemiological model parameters after September 1, 2020: (a) variant transmissibility, varied from 0.8× to 2.0× the baseline per-contact probability of infection; (b) variant severity, varied from 0.5× to 1.2× the risk of hospitalization; (c) extent of population COVID fatigue, varied as a −0.20 to −0.05 absolute change in contact reduction from steady-state behavior (baseline was −0.10). Plotted outcomes are averaged over the postcalibration posterior distribution of calibrated parameters.
Discussion
We used a compartmental model of SARS-CoV-2 transmission in Minnesota to simulate various adaptive NPI responses to regulate COVID-19 hospitalizations. Specifically, we examined how the threshold of a surveillance indicator, the time needed to implement an NPI response, and the effectiveness of an increased NPI response collectively affect our ability to manage peak hospitalizations and the duration of time under more restrictive interventions. In theory, the steady-state scenario presents the simplest approach to avoiding an overwhelming number of COVID-19 hospitalizations, as behaviors do not require adjustment over time. However, we illustrate that if a population cannot maintain the level of effective contact reduction needed to create a steady state (i.e., COVID fatigue), failing to trigger behavioral adjustments as hospitalizations rise can result in dangerous exponential growth. We also demonstrate that hospitalizations can be contained by a variety of adaptive NPI strategies and that having a feasible response strategy with which a population will comply is more important than the specific features of that response, at least among the scenario specifications considered in base-case and sensitivity analyses.
Intuitively, if a higher threshold for a surveillance indicator is adopted as a trigger for strengthening NPIs, health systems should be prepared for higher peaks in prevalent hospitalizations. With a maximum hospitalization capacity defined for a population, this kind of analysis can be used to back into scenarios that would prevent this capacity from being exceeded. The preferences of a population in terms of the strength versus the duration of a period of stricter NPIs as well as the feasibility of reaching specified levels of effective contact reductions should be considered under such trigger scenarios.
When a surveillance indicator signals the need for behavioral changes to reduce effective contacts, timeliness in implementing NPIs can decrease their necessary duration. Certain individuals and businesses, however, may find it preferable to have more time to prepare for impending changes (longer adjustment period) at the expense of extending the duration of the strengthened intervention (longer “on” period). For example, parents may need time to arrange for childcare in the event of school closures, and restaurants may wish to exhaust perishable inventory before the onset of indoor dining restrictions. 29 For populations in which adjusting to different levels of NPIs presents logistical or other challenges (e.g., confusion over changing recommendations), periods of more restrictive interventions may be considered tolerable when they can reduce the total number of adjustments needed. Schools, for example, may welcome a period of complete online learning (stronger “on” period) if it means that in-person learning can resume uninterrupted for a longer period of time (longer “off” period). 30 The baseline effective contact reduction of the population during “off” periods also influences how often and how long NPIs are needed. While maintaining high levels of individual-level mitigations may be infeasible, effective contact reductions can also be achieved through structural changes to indoor environments, such as improved ventilation and filtration. Structural changes are likely more sustainable than individual behavior change, and, in practice, they can be quite effective.31,32 Importantly, designing COVID-19 response strategies with consideration to population preferences may lead to increased adherence to NPIs. 33 Establishing transparent surveillance indicators that trigger defined NPI responses can provide individuals, businesses, and schools with lead time for planning while encouraging more cautious personal behaviors when a threshold is neared.
The effective contact reduction parameter used in our analyses is a combination of physical distance, mask use, air ventilation, and a variety of other factors that are not directly observable as a single estimate. Consequently, a challenge to interpreting our trigger scenarios is the inability to directly translate model effective contact reductions to specific population-wide behavior or policy changes. Mobility data and contact surveys can supplement historically calibrated effective contact reductions to provide insight on this relationship. 34 Model estimates derived from calibration to historical data serve as a point of reference for effective contact reductions assumed in model scenarios. Of note, we also simulated a trigger scenario in which effective contact reduction was assumed to be more restrictive (90%) than any effective contact reduction calibrated in previous time periods in Minnesota. We also acknowledge that the level of effective contact reduction that can be achieved within a population is neither definitive nor universal. We simulated NPIs that induced a certain level of contact reduction on average in the population; understanding the influence of differential behavioral responses among the different age groups and/or subpopulations may be important in designing the specifics of an adaptive NPI policy. Although the model results are not directly translatable into concrete policies, the modeling environment allows us to explore various NPI responses and provide insight on the expected direction and magnitude of changes that could be generalized to other populations.
It is important to emphasize that the model used in these analyses is necessarily a simplification of reality. Model scenarios are hypothetical and are intended to be interpreted relative to each other; they are not forecasts. Although we reflect hospitalization outcomes at a population level, the model did not include detailed patient-specific hospitalization dynamics, nor did it include other types of health care utilization, such as emergency department visits or ambulatory clinic visits, which may also be overburdened during surges. Limited capacity for mechanical ventilation was included in the model, but limitations on other resources, such as hospital beds and staffing, were not accounted for.
Reflective of the time frame over which this analysis took place, our model scenarios did not explicitly consider COVID-19 variants or vaccinations. Instead, we considered how our conclusion might change if the transmissibility and severity of the circulating fall strain were different from base-case estimates, which could reflect a combination of the emergence of a new variant35,36 and changes in the underlying immunity of the population due to vaccination and/or previous infection. We note that a more effective NPI is the most robust in maintaining lower peak hospitalizations and also less time spent with the NPI “on” across different transmissibility and severity assumptions. Although using a higher threshold to trigger the NPI generally leads to higher peak hospitalizations, we also noted that for highly transmissible variants, a slower adjustment time may be worse. Decision makers may wish to invest in infrastructure to facilitate the rapid adoption of NPIs and/or consider more conservative trigger thresholds for populations that cannot respond quickly to changing policies. More generally, model scenarios such as the ones explored in this study have the flexibility to be designed to reflect the epidemiological conditions expected at the time decisions need to be made. In anticipation of additional waves, this approach can serve as a tool to estimate immunity thresholds that could allow for delayed and/or less restrictive NPIs.
Although it was posited that reaching herd immunity through vaccine uptake and infection could prevent future exponential growth of SARS-CoV-2 infections, waning immunity and the immune-escape capabilities of new variants have compromised the level of control that can be achieved with vaccination alone. 37 The limitations of a vaccine-only strategy highlight the need for adaptive mitigation efforts. The triggering of an NPI response upon reaching a defined surveillance threshold thus remains a relevant strategy to combat future waves of COVID-19. Notably, the methods described here are not limited to COVID-19, as they have the potential to be applied to outbreaks of other emerging infectious diseases. The tradeoffs illustrated in our model scenarios provide policy makers a set of considerations when implementing adaptive NPI responses in the face of new threats posed by COVID-19 or other infectious diseases.
Supplemental Material
sj-pdf-1-mpp-10.1177_23814683231202716 – Supplemental material for Adaptive COVID-19 Mitigation Strategies
Supplemental material, sj-pdf-1-mpp-10.1177_23814683231202716 for Adaptive COVID-19 Mitigation Strategies by Erinn C. Sanstead, Zongbo Li, Shannon B. McKearnan, Szu-Yu Zoe Kao, Pamela J. Mink, Alisha Baines Simon, Karen M. Kuntz, Stefan Gildemeister and Eva A. Enns in MDM Policy & Practice
Footnotes
The authors declared the following potential conflicts of interest with respect to the research, authorship, and/or publication of this article: The following authors are employed by the sponsor: ECS, PJM, ABS, SG. EAE received personal consulting fees from Janssen Pharmaceuticals for work unrelated to this study. ZL, SBM, SYZK, KMK have no conflicts of interest to report. The authors disclosed receipt of the following financial support for the research, authorship, and/or publication of this article: Financial support for this study was provided entirely by a contract from the Minnesota Department of Health. The funding agreement ensured the authors’ independence in designing the study, interpreting the data, writing, and publishing the report.
References
Supplementary Material
Please find the following supplemental material available below.
For Open Access articles published under a Creative Commons License, all supplemental material carries the same license as the article it is associated with.
For non-Open Access articles published, all supplemental material carries a non-exclusive license, and permission requests for re-use of supplemental material or any part of supplemental material shall be sent directly to the copyright owner as specified in the copyright notice associated with the article.