
Abstract
Highlights
In conventional VOI analysis, it is assumed that the optimal decision will always be adopted even without a trial. This can potentially lead to an underestimation of the value of trials when adoption requires new clinical trial evidence. To capture the influence that a trial may have on decision makers’ willingness to adopt the optimal decision, we also consider value-of-implementation (VOM), a metric quantifying the benefit of new study information in promoting wider adoption of the optimal strategy. The overall value-of-a-trial (VOT) includes both VOI and VOM.
Our model-based analysis suggests that the information obtained from a trial of screening strategies for HIV-associated tuberculosis in South Africa would have no value, when measured using traditional methods of VOI assessment. A novel strategy, which includes the urine FujiLAM test, is optimal from a health economic standpoint but is underutilized. A trial would reduce uncertainties around downstream health outcomes but likely would not change the optimal decision. The high VOT (nearly $700 million over 5 y) lies solely in promoting uptake of FujiLAM, represented as VOM.
Our results highlight the importance of employing a more comprehensive approach for evaluating prospective trials, as conventional VOI methods can vastly underestimate their value. Trialists and funders can and should assess the VOT metric instead when considering trial designs and costs. If VOI is low, the VOM and cost of a trial can be compared with the benefits and costs of other outreach programs to determine the most cost-effective way to improve uptake.
Introduction
Clinical trials are considered the gold standard in testing health care interventions and informing clinical practice, including in tuberculosis (TB) and HIV care. However, the costs of designing, conducting, and analyzing trials can be prohibitive. 1 Value-of-information (VOI)—a decision analytic method of quantifying the benefit of collecting new data—can aid trialists and funders by informing their decision making around whether a study will provide valuable information. 2
Standard VOI analysis assumes that the optimal strategy based on pretrial evidence is fully implemented and, likewise, that the posttrial optimal strategy, taking into account the evidence from the trial, will also be fully implemented. In reality, one or both of these assumptions may be incorrect.3–7 An additional benefit of clinical trials is to prove the value of clinical strategies considered optimal based on pretrial evidence but for which uptake is limited by the lack of clear trial-based evidence of value. Value-of-implementation (VOM)—a metric that complements VOI—can quantify the benefit of the trial in encouraging wider adoption of the optimal care strategy.3,5–9
TB is the leading cause of death of people with HIV (PWH) globally. Although TB is curable, it is often difficult to detect. New TB diagnostic tests have been developed in recent years, and others are under development. 10 Many of these tests have improved performance characteristics, such as sensitivity or specificity, but higher costs compared with older tests. Health care decision makers may not be satisfied with evidence of improved test sensitivity or specificity; they may instead demand direct evidence that adopting a new TB diagnostic test will improve downstream health outcomes, such as mortality. 11
Urine lipoarabinomannan (LAM) tests are relatively new assays that can detect TB, particularly in PWH. 12 Whereas many patients cannot provide a sputum specimen for traditional TB testing, nearly all can provide a urine specimen. The World Health Organization has recommended an early-generation LAM assay, AlereLAM, due partly to trial evidence that its use as a TB screening tool in hospitalized PWH in sub-Saharan Africa may reduce mortality at 2 mo.13–15 Despite this recommendation, uptake of AlereLAM in TB- and HIV-endemic regions has been low. 16 A newer LAM test, the FujiLAM assay, has higher sensitivity than the AlereLAM assay, but at higher cost.17–19 To date, there are no published studies of the impact on mortality of using FujiLAM for TB screening in hospitalized PWH, although a trial is underway. 20
Our objective was to employ a comprehensive approach based on VOI and VOM methods to determine the overall value-of-a-trial (VOT) examining 2-mo mortality associated with various TB screening strategies among hospitalized PWH in South Africa. The VOT comprises both the benefit of a trial in reducing uncertainty in the degree to which improved sensitivity of FujiLAM translates to better outcomes for patients (traditional VOI) and the benefit from improving uptake of the optimal intervention that may occur with the results of a trial (VOM).
Methods
Analytic Overview and Outcomes
We first performed a model-based cost-effectiveness analysis to project the clinical and economic outcomes associated with different TB screening strategies. This included a probabilistic sensitivity analysis (PSA) to examine how uncertainty in input parameters translated to uncertainty in outcomes, without additional information from a trial. The strategy with the highest expected net monetary benefit (NMB), defined as (life-expectancy) × (willingness-to-pay per life-year) – expected lifetime costs, is the pretrial optimal strategy. Next, we determined conventional VOI, that is, the difference between posttrial and pretrial NMB based on the optimal strategy in each scenario. We considered both the expected value of partial perfect information (EVPPI) and expected value of sample information (EVSI), defined as the incremental NMB (INMB) of eliminating (EVPPI) and reducing (EVSI) uncertainty in some parameters before decision making, respectively. Details about the definitions are in the supplement. Then, because conventional VOI analysis assumes perfect uptake of the optimal strategy, both before and after the trial, we incorporated improved—but imperfect—uptake of the optimal posttrial strategy into our VOI and VOM estimates, where VOM is the INMB of encouraging wider adoption of the optimal pretrial strategy. Furthermore, we considered VOI and VOM together to constitute the VOT (where VOT = VOI + VOM). We compared VOI with VOM to assess the value driven by information versus implementation from the trial. Finally, we performed sensitivity analyses to understand how VOT might change under different assumptions around population size, level and pace of uptake of the new optimal strategy, and discount rate.
Simulation model and cost-effectiveness analysis
We used the Cost-Effectiveness of Preventing AIDS Complications (CEPAC)–International model, a validated and widely published microsimulation of HIV- and TB-related disease and treatment.19,21 Initially, the model draws randomly from user-defined characteristics, such as CD4 count and TB status. 22 The model tracks clinical outcomes and health care costs as each individual transitions through various “states” of HIV and TB disease and treatment (Supplementary Figure S1). Details about the CEPAC model, TB module, validation, and treatment parameters are in the supplement and in previously published work.19,21–25
The population of interest was adults with HIV hospitalized in medical units in South Africa. We considered 3 TB screening strategies, applied to all regardless of symptoms or CD4 count: 1) sputum Xpert MTB/RIF, a polymerase chain reaction test, alone (Xpert); 2) sputum Xpert plus a first-generation urine LAM test (Xpert+AlereLAM); and 3) sputum Xpert plus a newer-generation urine LAM test with higher sensitivity and cost (Xpert+FujiLAM). We assumed that the standard of care (Status Quo) comprised Xpert for 50% of individuals and Xpert+AlereLAM for 50% of individuals, in line with a reported estimate of AlereLAM policy adoption. 16
Simulated PWH enter the CEPAC model after TB screening and are tracked monthly until death. Those with a positive screening test (including “false-positives” who do not truly have TB) start treatment for TB. In the case of negative microbiological tests, empiric treatment can be initiated according to patterns in local practice and published trials. 14
We included 10,000 iterations (sets of input parameters) for each screening strategy. To attain stable per-person results, each iteration of the CEPAC model comprised a cohort of 2 million individuals.
Model and cost-effectiveness outcomes
Model outcomes, calculated across 10,000 iterations, included mean and 95% uncertainty interval for all-cause mortality at 2 mo, per-person life-years, and lifetime HIV- and TB-related costs from the health system perspective. The incremental cost-effectiveness ratio (ICER) between 2 screening strategies was calculated as the difference in mean lifetime health care costs divided by the difference in life expectancy.
We considered a willingness-to-pay (WTP) threshold of US$3,000 per year of life saved (YLS), which is approximately 50% of South Africa’s per-capita annual gross domestic product and similar to a reported South Africa–specific opportunity cost–based threshold. 26 In addition, we explored a range of WTP thresholds, from $500 to $6,000 per YLS, to provide context of the VOT in settings with different availabilities of resources. The pretrial optimal strategy is the one with the highest expected NMB at the chosen WTP.
We examined the impact of parameter uncertainty on the cost-effectiveness of the screening strategies, as suggested by Briggs et al. 27 For each iteration of the parameter set, the strategy with the highest NMB is the most cost-effective. To illustrate the probability of a strategy having the highest NMB across the iterations, we created a cost-effectiveness acceptability curve (CEAC) across the entire range of WTP thresholds of interest (Figure 1).

Cost-effectiveness acceptability curve.
VOI and VOM Analysis
Generalized additive model–based approach for estimating VOI
We applied PSA outcomes to a VOI framework, assuming that parameter uncertainty could be reduced through a trial. Supplementary Figure S2 details how trial results would update parameters in the CEPAC model. VOI outcomes of interest included EVPPI and EVSI. We employed a generalized additive model (GAM) to estimate EVPPI and EVSI based on the structure of CEPAC, the likelihood of the input parameters, and the distribution of the simulated study outcome.28,29 Previously, 3 VOI case studies were performed using the CEPAC model; VOI estimates based on the GAM approach closely matched those of the conventional nested approach based on simulating outcomes with the full model. 30 Details about the different approaches for estimating VOI outcomes are in the supplement.
The GAM regresses NMB outcomes obtained from CEPAC on the target parameters (the uncertain parameters for which information would be gained from a trial, for EVPPI) or study outcomes (for EVSI). 31 For EVPPI, the target parameter was 2-mo all-cause mortality, which was obtained from the results of the CEPAC model. For EVSI, we considered a simulated 2-arm clinical trial that compares 2-mo all-cause mortality associated with the 2 urine LAM-based strategies: Xpert+AlereLAM and Xpert+FujiLAM. We assumed a sample size of 2,600 individuals per strategy, similar to that in the Rapid Urine-based Screening for Tuberculosis to Reduce AIDS-related Mortality in Hospitalized Patients in Africa (STAMP) trial.14,32 The corresponding study outcome was the number of strategy-specific observed deaths in the clinical trial, which we simulated using a binomial distribution.
For each PSA iteration, we estimated each strategy’s expected NMB conditional on the value of target parameters (for EVPPI) or simulated study outcomes (for EVSI) using the GAM-based approach and thereby selected the optimal posttrial strategy for each realization of model parameters. The average of the NMBs of each posttrial decision (i.e., each iteration of target parameter or study outcome) was the posttrial expected NMB, which we then compared with the pretrial expected NMB to determine VOI.
Ten thousand iterations of the CEPAC model were sufficient for VOI estimates to converge (Supplementary Figures S3 and S4). All GAM-fitted NMBs were validated to ensure normality and the absence of structural patterns. Details are in the supplement (Supplementary Figures S5 and S6).
VOM
We considered the value of increasing uptake of the optimal strategy by employing a framework similar to those reported by Andronis and Barton 3 and Grimm et al. 5 The conventional VOI estimates were adjusted in 2 ways. First, we assessed the value of adopting the pretrial optimal strategy rather than the standard of care to determine VOM. Furthermore, because the VOI framework provides only estimates of the value of perfect uptake of the posttrial optimal strategy, we considered improved—rather than perfect—uptake of the posttrial optimal strategy that might occur after the results of a clinical trial are known. Accordingly, we discounted the VOI and VOM estimates to account for imperfect uptake of the posttrial optimal strategy.
Employing the methods proposed by Andronis and Barton, 3 we conceptualized 9 states, each representing a unique combination of available information and uptake (Table 1). We classified information as “current” (existing information available prior to any results from further studies), “sample” (information after trial results are available), or “partial perfect” (absolute certainty about 2-mo mortality associated with the use of different screening strategies). We expressed uptake as the proportion of eligible patients receiving the optimal screening strategy: “current” (Status Quo, in which 50% of eligible individuals are screened by Xpert alone and 50% by Xpert+AlereLAM, given that AlereLAM is guideline-recommended but suboptimally implemented 16 ), “improved” (in which uptake of the optimal strategy increases linearly from current levels to 80% in 5 y), and “perfect” (in which 100% of eligible patients immediately receive the optimal strategy).
Different Scenarios of Information and Implementation, Building on the Framework of Andronis and Barton 3


EVM, expected value of improved implementation; EVPM, expected value of perfect implementation; EVPPI, expected value of partial perfect information; EVPPI&M, expected value of partial perfect information and improved implementation; EVPPI&PM, expected value of partial perfect information and perfect implementation; EVSI, expected value of sample information; EVSI&M, expected value of sample information and improved implementation; EVSI&PM, expected value of sample information and perfect implementation; LAM, lipoarabinomannan; VOI, value-of-information; VOM, value-of-implementation; VOT, value-of-a-trial.
The current implementation scenario (Status Quo) reflects 50% of patients being screened by Xpert alone and 50% by Xpert+AlereLAM.
Improved implementation assumes a linear increase in adopting the optimal strategy from 0% to 80% over 5 y.
Conventional VOI outcomes represent the expected benefits of acquiring information on the premise of perfect implementation of any decision determined by cost-effectiveness; that is, EVPPI is the difference between the value of states I and G and EVSI between states H and G.
This measure differs from conventional EVSI (H-G) in 2 ways. First, when combined with conventional EVSI, it comprises the gains from implementing the optimal pretrial decision, that is, moving from state A to H. Furthermore, this measure discounts its benefits to reflect an improved but imperfect level of implementation resulting from new information.
This measure can be interpreted as applying the full benefits of gathering perfect information of the target parameter (i.e., 2-mo mortality of the screening strategies) to a fraction of the entire population affected by the information. This could be explained by barriers to scale up, existence of different perspectives or incentives, or asymmetries of information in the real world.
Population-level analysis
Information from the clinical trial would be of value every time a choice is made between the different screening strategies for an individual. We therefore scaled per-person VOI and VOM estimates to the population level, that is, individuals who would benefit from the information. We accounted for imperfect implementation by adjusting the annual target population based on the uptake of the optimal strategy.
VOI and VOM outcomes
We determined the value of each state in Table 1 based on the expected NMB of a decision made given the state’s level of information and uptake. For each realization of the information gained, we considered the strategy that had the highest expected GAM-fitted NMB. The value of each state is the average of the highest expected GAM-fitted NMB across all realizations of the information gained. Subsequently, we derived a series of measures of the overall VOT from combining the values of improving either information (VOI) or uptake (VOM) as illustrated in Table 1.
The expected value of perfect implementation (EVPM) shows the difference between providing the best screening strategy to the whole population (state G) and continuing current practice (state A), under current information (Table 1). This value represents the maximum expected gains from investing resources in the pursuit of better uptake of the strategy that is cost-effective under current evidence.
The expected value of sample information and improved implementation (EVSI&M) provides the overall value of conducting a trial, represented as the difference in value between a state in which sample information from a trial is available and has changed uptake (state E) and the “current state” of information and uptake (state A) (Table 1). EVSI&M is the sum of VOI (state E – state D) and VOM (state D – state A) (Table 1). Alternatively, this measure can be interpreted as applying the full benefits from adopting the optimal strategy (the expected value of sample information and perfect implementation, EVSI&PM) to a smaller population that will receive the optimal intervention each year.
Input Parameters
We based our modeled population on the South African participants in the STAMP trial, 14 since the simulated clinical trial considered the same target population (Table 2). We derived diagnostic yields for each screening strategy accounting for nonindependence of test results, as described previously. 19
Model Input Parameters

AIDS, acquired immunodeficiency syndrome; ART, antiretroviral therapy; DS, drug susceptible; EFV, efavirenz; HIV, human immunodeficiency virus; IQR, interquartile range; LAM, lipoarabinomannan; MDR, multidrug resistant; N/A, not applicable; PSA, probabilistic sensitivity analysis; s, standard deviation; SEM, standard error of the mean; TB, tuberculosis; TDF, tenofovir; USD, 2017 US dollars; VOI, value-of-information; VOM, value-of-implementation; 3TC, lamivudine.
For beta distributions, the upper and lower bounds are reported; for unbounded distributions, we report the 95% confidence interval.
To calculate the s for each iteration of the PSA, we scaled the base case s by the ratio of the iteration’s mean CD4 to the base case mean.
TB prevalence is the true prevalence among the simulated group of hospitalized patients with HIV.
Those who are diagnosed clinically with TB without microbiologic confirmation are empirically treated starting in the first month of model simulation.
All-cause mortality is not directly modeled, apart from mortality-related inputs such as deaths from untreated TB and deaths from non-TB causes. Mortality is influenced by model parameters such as TB prevalence, sputum provision probability, TB screening test sensitivity and specificity, probability of empiric treatment and treatment initiation, and probability of treatment completion and cure. All of these are varied in the PSA.
Costs shown here are for drugs only.
Costs were varied outside the model.
The indicated sensitivity of each assay is the sensitivity among those who provide a specimen and is independent of other test results. Italics reflect a diagnostic strategy rather than a single test. The diagnostic strategy yields applied in the model account for nonprovision of sputum specimens and for concordance between test results; for example, adding FujiLAM would increase diagnostic yield only if FujiLAM detected additional TB cases not detected by Xpert. In multitest strategies, we applied the lowest specificity of any individual test.
The base-case uptake scenario models a linear increase in implementation of the optimal strategy from 0% to 80% over 5 y.
The optimistic scenario models a linear increase from 0% to 100% over 3 y; the pessimistic uptake scenario models a linear increase in implementation of the optimal strategy from 0% to 60% over 7 y.
Inputs for probabilistic sensitivity analysis
To account for parameter uncertainty, we considered joint probability distributions for several key parameters and varied them simultaneously. These parameters were diagnostic yield, specificity, and cost of the 3 screening strategies; TB prevalence; sputum provision probability; empiric TB treatment probability (i.e., treatment in the absence of a positive test result); loss to follow-up from TB care posthospitalization; and probability of death for those with untreated TB. Diagnostic yields by strategy for patients in the low (those with a CD4 count <200/µL) and high (CD4 count ≥200/µL) cohorts, respectively, were 33%/33% for Xpert, 62%/35% for Xpert+AlereLAM, and 69%/47% for Xpert+FujiLAM. The cost per diagnostic test was $15 for Xpert, $3 for AlereLAM, and for FujiLAM was drawn from a log-normal distribution with mean $6 and standard deviation $1.20. Distributions for other parameters are in Table 2.
Population-level inputs
In the base case, we considered an annual target population of 500,000 PWH hospitalized in medical units in South Africa 19 and an effective time horizon of 5 y until newer diagnostics replace the existing ones. Implementation levels were “perfect” for partial perfect information and “improved” for sample information (uptake increases linearly from current levels to 80% in 5 y). We discounted outcomes 3%/y during the specified time horizon (Table 2).
Population-Level Sensitivity Analysis
We assessed 2 additional scenarios (pessimistic, optimistic) representing different rates of uptake of the optimal strategy that mirror the diffusion of trial information in real-world settings.5,49–52 The optimistic scenario assumes uptake increases linearly from 0% to 100% over 3 y, which could correspond to situations in which trial results suggest clear evidence that the cost-effective strategy offers a favorable clinical outcome. In contrast, the pessimistic scenario assumes uptake increases linearly from 0% to 60% at 7 y, reflecting scenarios in which the evidence gathered from the trial is not as favorable (e.g., the P value of the trial result is above or very close to the significance level) or implementation is subpar due to logistical reasons. In addition, we conducted additional analyses to explore the impact of differences in the annual number of PWH who are hospitalized and the time horizons over which information would be useful (Table 2).
Cost Scenario Analysis
We explored the impact of FujiLAM cost by conducting a separate analysis for a higher cost of $20/test. We reevaluated model outcomes, uncertainty of pretrial optimal decision, and VOI and VOM estimates.
Results
Cost-Effectiveness Analysis
Base-case results for alternative TB screening strategies using current (i.e., pretrial) evidence are reported in Table 3. Xpert would result in 9.1 life-years and lifetime discounted health care costs of $7,320. Relative to Xpert, adopting Xpert+FujiLAM would increase the life expectancy of the screened population by 0.5 life-years and increase per-person costs by $390. Adopting Xpert+AlereLAM for all would also provide health benefit relative to Xpert, with 0.3 life-years gained and a $270 cost increase per person. Taken as a whole, these findings suggest that Xpert+AlereLAM would be weakly dominated by Xpert+FujiLAM, which would have an ICER of $780/YLS compared with Xpert alone.
Simulation Model–Generated Clinical and Economic Outcomes for Tuberculosis Screening Strategies

ICER, incremental cost-effectiveness ratio; LAM, lipoarabinomannan; NMB, net monetary benefit; USD, 2017 United States dollars; YLS, year-of-life saved. The population is hospitalized people with HIV in South Africa. The discount rate is 3% per year.
ICERs are calculated using mean life-years and mean health care costs, so there are no uncertainty intervals.
Status Quo reflects 50% of patients being screened by Xpert alone and 50% by Xpert+AlereLAM.
Using only current evidence, PSA (Figure 1) suggests that the optimal strategy at a WTP threshold of $3,000/YLS would be Xpert+FujiLAM (i.e., it is the strategy with the highest expected NMB). Perfect uptake of this strategy would provide an NMB of $20,960 per person, compared with $19,860 with Xpert and $20,230 with Status Quo.
There is virtually no uncertainty regarding the pretrial optimal decision (Figure 1). Xpert+FujiLAM would almost certainly be the most cost-effective strategy, so long as the WTP exceeds $810/YLS; Xpert would almost certainly be the preferred strategy if the WTP threshold is below $780/YLS. Only in the very narrow band where the WTP matches our estimate of the ICER for Xpert+FujiLAM relative to Xpert ($780/YLS) is where there is doubt about the optimal decision.
VOI and VOM
Conventional VOI analysis
At a WTP of $3,000/YLS, conventional VOI analysis finds no value—neither EVSI nor EVPPI—to the information that might be obtained from a trial evaluating the 2-mo mortality associated with each screening strategy (Table 4). When the WTP threshold is set to the ICER for Xpert+FujiLAM relative to Xpert ($780/YLS), the EVSI and EVPPI are maximized at $900,000 and approximately $2.056 million, respectively, for a population of 500,000 people (Table 4).
Value-of-Information and Value-of-Implementation Outcomes
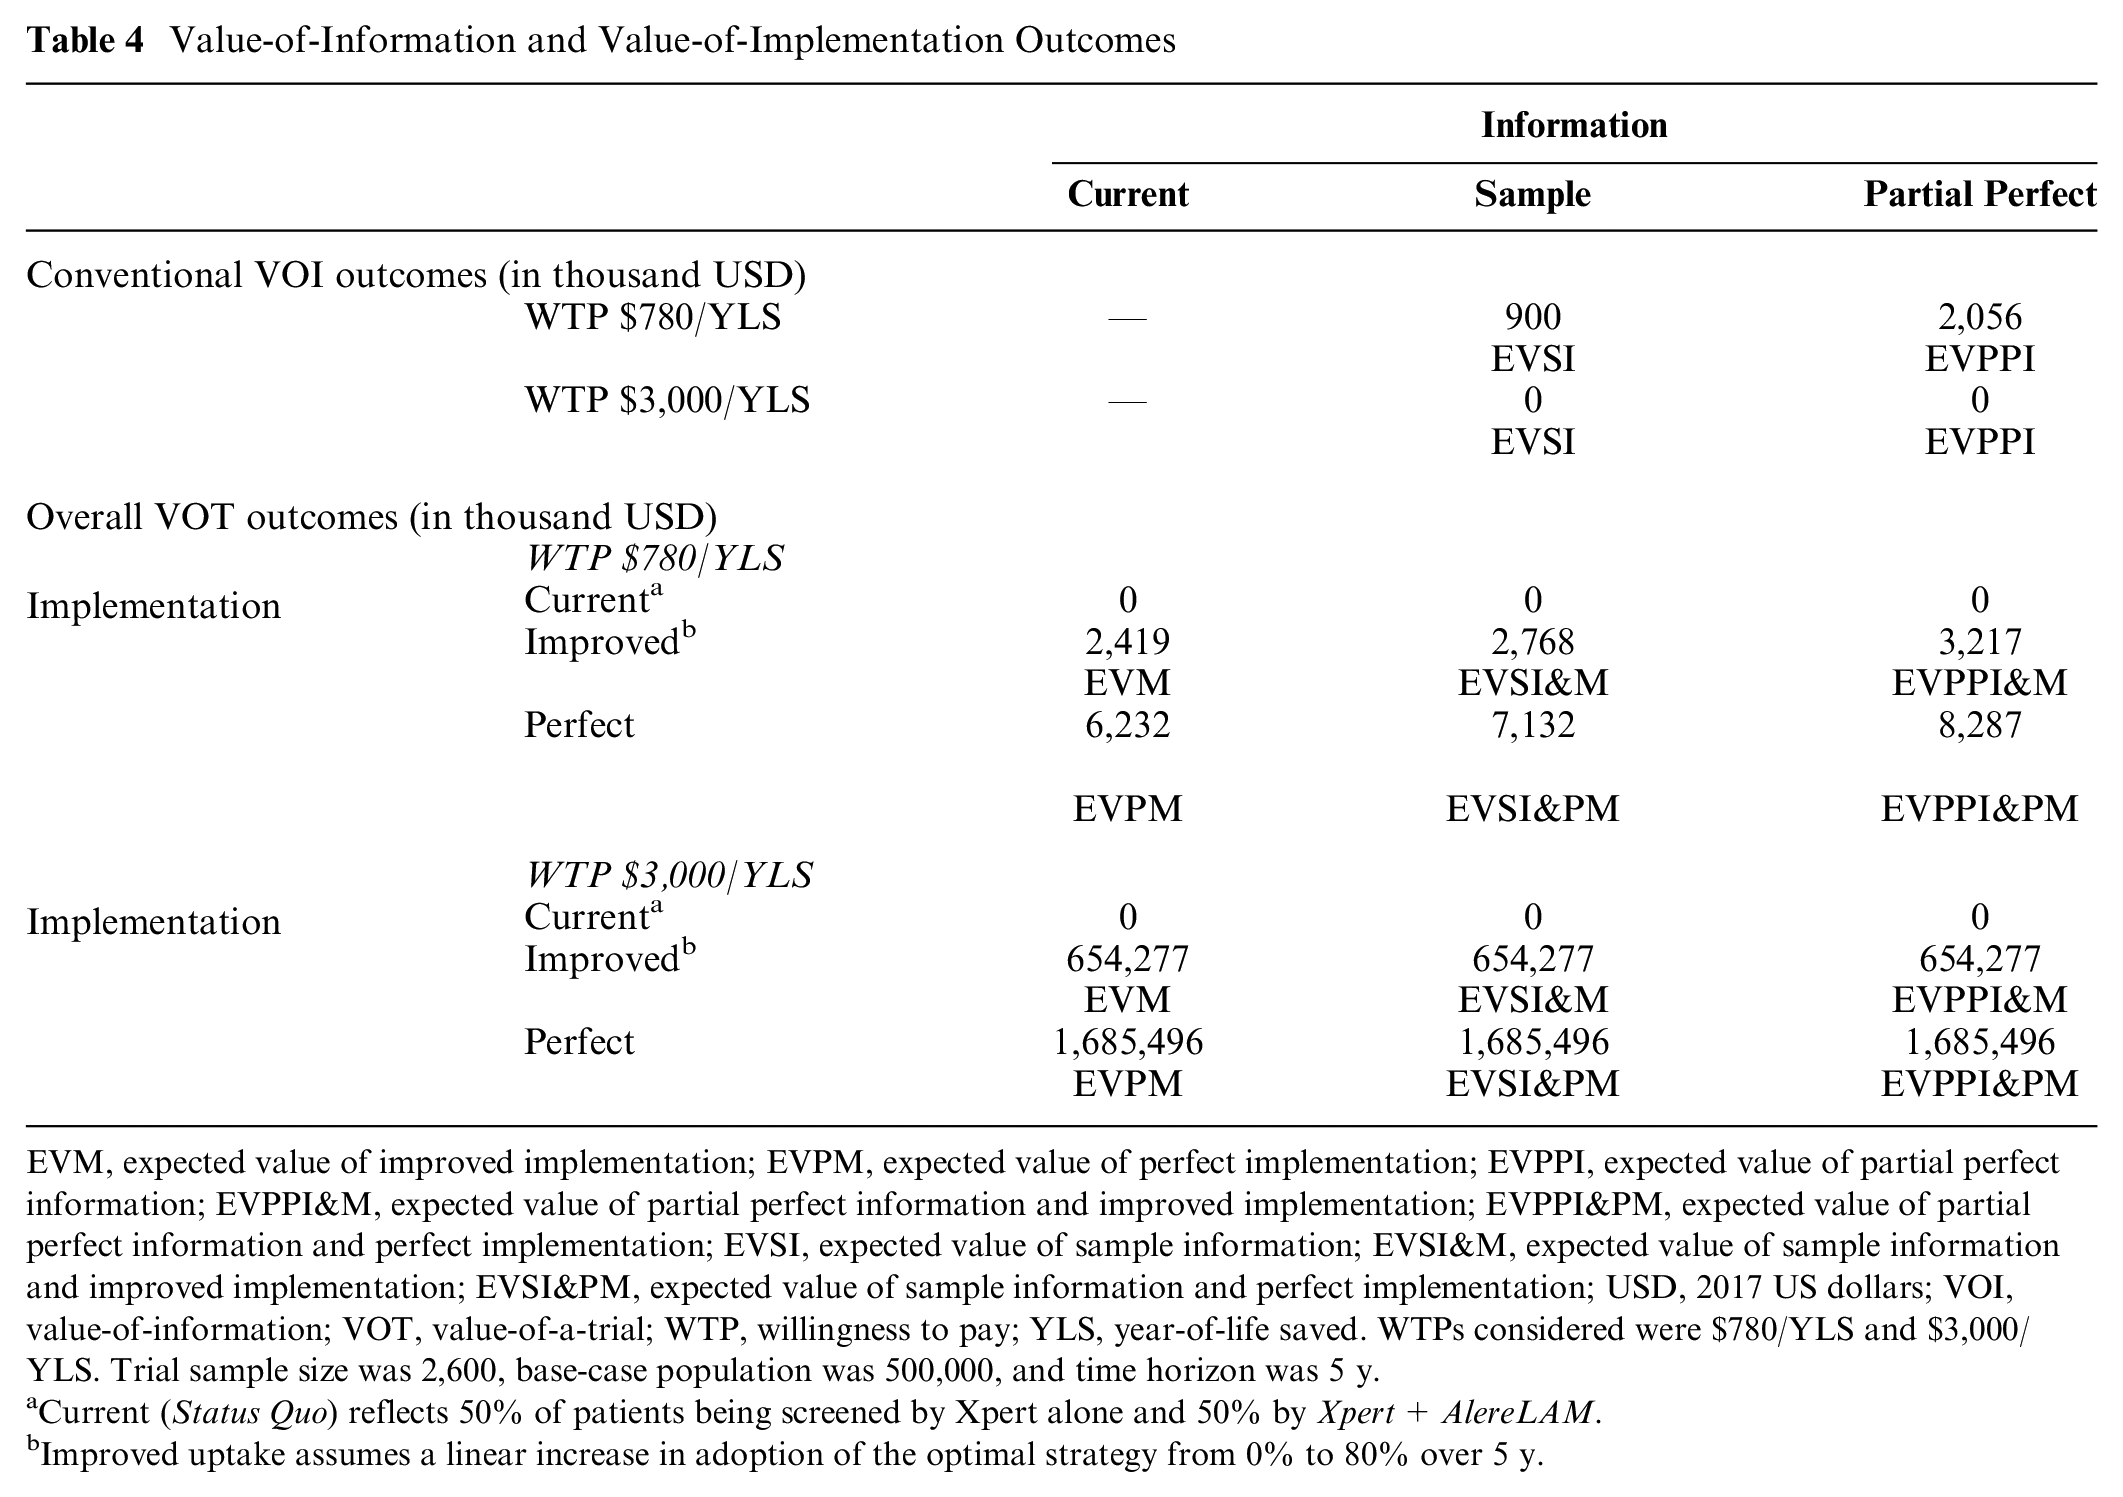
EVM, expected value of improved implementation; EVPM, expected value of perfect implementation; EVPPI, expected value of partial perfect information; EVPPI&M, expected value of partial perfect information and improved implementation; EVPPI&PM, expected value of partial perfect information and perfect implementation; EVSI, expected value of sample information; EVSI&M, expected value of sample information and improved implementation; EVSI&PM, expected value of sample information and perfect implementation; USD, 2017 US dollars; VOI, value-of-information; VOT, value-of-a-trial; WTP, willingness to pay; YLS, year-of-life saved. WTPs considered were $780/YLS and $3,000/YLS. Trial sample size was 2,600, base-case population was 500,000, and time horizon was 5 y.
Current (Status Quo) reflects 50% of patients being screened by Xpert alone and 50% by Xpert+AlereLAM.
Improved uptake assumes a linear increase in adoption of the optimal strategy from 0% to 80% over 5 y.
VOM analysis
Immediate, perfect uptake of Xpert+ FujiLAM would provide substantial health and economic benefits at the population level compared with current practices (Table 4). Assuming a WTP of $3,000/YLS, the EVPM would be approximately $1.685 billion; if adoption of Xpert+FujiLAM were to grow linearly from 0% to 80% over a 5-y time horizon, the EVM would be approximately $654 million (Table 4). Even at a lower WTP of $780/YLS, adopting Xpert+FujiLAM now would still yield benefits (Table 4).
Comparative values of information and implementation
At a WTP of $3,000/YLS, VOT—representing the overall value for gathering sample information (EVSI&M, VOI, and VOM both included)—is approximately $654 million (Table 4). In a hypothetical scenario in which information gathered from a trial is partial perfect and uptake of the optimal strategy is perfect, VOT (EVPPI&PM) is approximately $1.685 billion. Because VOI is $ 0 for this WTP of $3,000/YLS, all the value in these scenarios comes from the improved or complete uptake of the optimal strategy. On the other hand, at a WTP of $780/YLS, both information and implementation contribute to the overall value. At this WTP, EVSI&M would be approximately $2.768 million, $300,000 of which comes from VOI; EVPPI&PM would be approximately $8.287 million, $2.056 million of which comes from VOI.
For a range of WTPs between $500 and 6,000/YLS, we considered the ratio between VOI and VOM. Since the VOI for most WTPs is $ 0, this ratio is also zero, except for WTP thresholds very close to $780/YLS. At its maximum, the ratio between VOI and VOM is 0.33 and 0.14 for perfect and sample information, respectively (Figure 2).
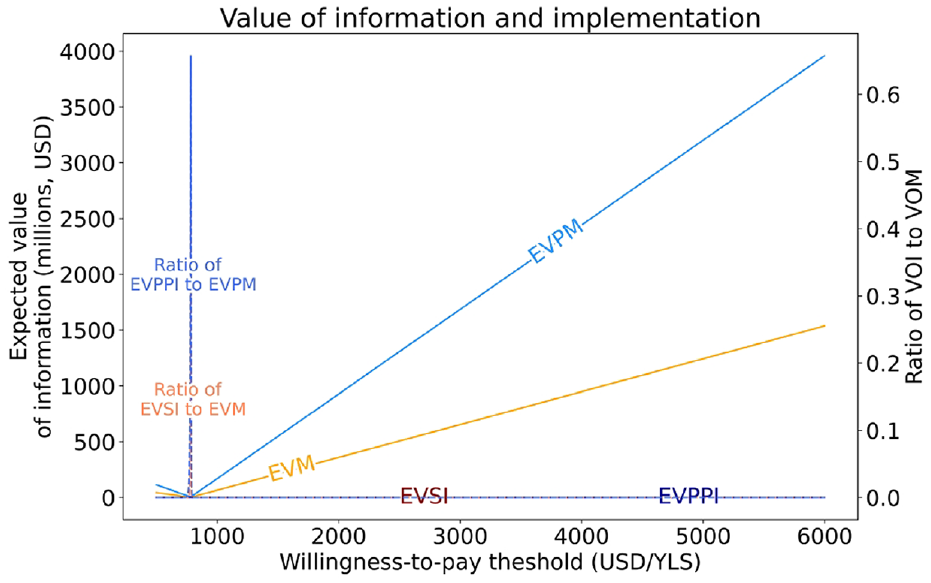
Population-level value of different levels of information and uptake and the ratio of value-of-information to value-of-implementation.
Population-Level Sensitivity Analysis
Results from varying population-level inputs are in Table 5. Using the base-case uptake scenario, the overall value of gathering sample information (EVSI&M) varies from $102 million when information is useful for 3 y and affects 250,000 people per year to $2.736 billion when information is useful for 10 y and affects 750,000 people per year. In an optimistic uptake scenario in which uptake increases linearly from 0% to 100% over 3 y, VOT ranges from $255 million to $3.926 billion; in a pessimistic uptake scenario in which uptake increases linearly from 0% to 60% at 7 y, VOT ranges from $51 million to $1.753 billion. In all of these scenarios, VOT comes entirely from improved uptake, since conventional EVSI is $ 0 at a WTP of $3,000/YLS.
Population-Level Sensitivity Analyses Showing Expected Value of Sample Information and Improved Implementation (EVSI&M), in Thousands (USD)

EVSI&M, expected value of sample information and improved implementation; USD, 2017 US dollars. The willingness-to-pay threshold is $3,000 per year-of-life saved.
The base-case uptake scenario is a linear increase in uptake of the optimal strategy from 0% to 80% over 5 y.
The optimistic uptake scenario is a linear increase in uptake of the optimal strategy from 0% to 100% over 3 y.
The pessimistic uptake scenario is a linear increase in uptake of the optimal strategy from 0% to 60% over 7 y.
Cost Scenario Analysis
Assuming a higher cost of $20 per test for FujiLAM, Xpert+AlereLAM is no longer weakly dominated and is the preferred strategy for a narrow range of WTP between $800/YLS and $810/YLS. This translates to a higher level of uncertainty in the pretrial optimal strategy (Xpert+AlereLAM is preferred in 56% of the simulation runs at WTP of $800/YLS). At WTP of $3,000/YLS, the pretrial optimal strategy remains Xpert+FujiLAM. VOI remains $ 0, while EVSI&M decreases slightly to about $642 million (Supplement).
Discussion
We used a GAM in conjunction with a microsimulation model to estimate the value of a prospective trial of new TB screening strategies in hospitalized people with HIV in South Africa. We used and modified the more comprehensive approach developed and reported previously by Andronis and Barton 3 and Grimm et al., which expresses the VOT in terms of both the information that the trial would provide about optimal decision making and its potential to improve the implementation of the optimal strategy.6,7 Traditional VOI estimates assess only the value that could be gained from decreased uncertainty about the optimal strategy, in a context of perfect implementation. We further estimated the value of increasing uptake of the optimal strategy either with or without new information from the trial.
Our model results demonstrate that such a trial is unlikely to provide information that would change the optimal decision from a health economic standpoint. Based on cost-effectiveness at a WTP of US$3,000 per life-year gained, the combination of Xpert plus FujiLAM is already the optimal strategy given current information and its uncertainties. A trial would reduce the uncertainties around factors such as the probability of sputum provision (which affects the diagnostic yield from Xpert), the probability of empiric treatment (which affects the benefit gained from a more sensitive test), and the underlying prevalence of TB. However, the optimal decision is highly likely to remain the same across most plausible scenarios and trial outcomes: that Xpert plus FujiLAM is optimal based on net monetary benefit.
However, the lack of uncertainty around the optimal decision in the pretrial scenario does not mean that the decision will be implemented in practice. A major assumption underlying conventional VOI analysis is that clinical practice follows decisions made based on cost-effectiveness. That is, all clinicians will implement the decision that provides the highest expected health economic benefit, even in the absence of a statistically significant result from a clinical trial. But uptake is always imperfect for a variety of reasons, including lack of clinical evidence or official guidance, logistic or financial barriers to scale up, existence of different perspectives or incentives, or asymmetries of information. Even in the presence of prior evidence pointing toward the benefits of a particular strategy, policy makers may seek additional evidence from trials. For example, despite acknowledging evidence of FujiLAM’s superior sensitivity over AlereLAM in its guidelines on LAM testing, the World Health Organization did not provide recommendations on use of FujiLAM, citing a need for additional evidence of diagnostic accuracy, feasibility, and acceptability. 15
To address this gap, we used an approach to assigning value to information that promotes the adoption—whether improved (but still imperfect) or perfect—of the optimal strategy.3–5 Evaluating VOM provides important insights. We find high value of increasing the uptake of FujiLAM, even in the pretrial scenario, in which there is no uncertainty around the optimal strategy. When real-world implementation requires a positive clinical trial, conventional VOI may vastly underestimate the trial’s potential value. Furthermore, if VOM is much greater than VOI, as we find in this analysis, and if wider uptake is not contingent on trial results, then investments in scale up could be prioritized over investments in conducting a trial. The VOM and cost of a trial can be compared to the benefits and costs of other outreach programs to determine the most cost-effective way to improve uptake. However, wider uptake might not occur without trial results, and thus the trial could still provide positive value by VOM even if VOI by itself is zero or low. We did not specifically account for costs of the trial. The value of improving uptake from trial information would have to exceed its associated costs to justify a trial. This is likely to be true according to our results, where improving uptake of FujiLAM would provide substantial value, nearly $700 million over 5 y, much greater than estimates of the cost of a trial in South Africa.53,54 This framework of estimating the VOT—comprising VOI and VOM—allows the separate, but linked, decisions regarding investment in research and investment in implementation activities to be made simultaneously. 2
We built on methods previously described by Andronis and Barton 3 and Grimm et al. 5 Our approach differed from theirs in 2 ways. First, we projected VOI and VOM separately. Andronis and Barton considered the composite VOT without specifically breaking down VOI and VOM. Explicitly distinguishing between VOI and VOM would allow decision makers to evaluate the separate contributions of added “information” and “implementation” that might be gained from a trial. In particular, when VOI is low, VOM could be compared with the value and cost of other outreach strategies. Second, in our population-level estimates, we accounted for incomplete penetration of the information that would be gained from a trial. We calculated population-level VOI and VOM as the product of the individual-level VOI and VOM estimates and a “discounted” target population size, reflecting the population estimated to adopt the intervention over a time horizon of interest. As such, the same level of “imperfect implementation” is applied across both VOI and VOM estimates. While the framework by Grimm et al. considered VOI and VOM separately, imperfect implementation was applied only to VOM; the benefit of reducing uncertainty (VOI) was assumed to apply to all eligible individuals. This could lead to an overestimation of the trial’s value in reducing uncertainty because VOI would be applied to some people who do not stand to benefit from the information.
There are no empirical studies comparing levels of implementation based on modeling alone compared with clinical trial evidence. Furthermore, the level of implementation of clinical trial evidence is often imperfect and unclear. More research is needed to understand this. Although data-informed implementation levels are limited,16,55 we accounted for different levels and paces of uptake and different target population sizes, showing how these factors could change the value. In particular, lower implementation levels were explored in a pessimistic scenario to account for a situation in which implementation is subpar despite clear clinical evidence.
A prior study showed the budget impact of implementing the Xpert and AlereLAM screening intervention nationally and scaled to all hospitalized patients with HIV over 5 y in South Africa. 21 Health care expenditures among screened individuals over 5 y would increase by approximately $260 million (2.8%), and much of this increase would be due to HIV care costs given longer survival. 21 Although FujiLAM is expected to cost more than AlereLAM, most of the increase in health care expenditures would still likely be related to longer survival.
The results of our analysis, like any model-based analysis, are influenced by model structure and assumptions. Parameter uncertainty in the model comes from the distributions that we set, although we based these distributions on evidence where available and otherwise applied broad distributions to explore a range of potential outcomes. Nonetheless, there are theoretical thresholds for parameters and their distributions at which the trial might provide greater VOI, for example, if there was even more uncertainty around the sensitivity of FujiLAM and the number of additional patients with TB that it would detect. We did not consider disability adjustments in our projections of clinical benefits, although prior TB studies demonstrated that mortality was the major driver of disability-adjusted life-years.56–59
Given increasing resource constraints for health care worldwide, including funding for trials, estimating VOI and extending that to project VOM should be undertaken more frequently. These extended methods can capture the VOT more comprehensively, which can guide future trials, not only in HIV and TB care but also in other clinical areas. They can also help prioritize funding for trials whose results will provide the most value by improving clinical decisions, either because the trials reduce the uncertainty about the outcomes of alternative clinical strategies or because trial results are critical to the actual adoption of effective and cost-effective interventions that are suboptimally utilized, or both.
Supplemental Material
sj-docx-1-mpp-10.1177_23814683231198873 – Supplemental material for The Value-of-Information and Value-of-Implementation from Clinical Trials of Diagnostic Tests for HIV-Associated Tuberculosis: A Modeling Analysis
Supplemental material, sj-docx-1-mpp-10.1177_23814683231198873 for The Value-of-Information and Value-of-Implementation from Clinical Trials of Diagnostic Tests for HIV-Associated Tuberculosis: A Modeling Analysis by Pamela P. Pei, Kieran P. Fitzmaurice, Mylinh H. Le, Christopher Panella, Michelle L. Jones, Ankur Pandya, C. Robert Horsburgh, Kenneth A. Freedberg, Milton C. Weinstein, A. David Paltiel and Krishna P. Reddy in MDM Policy & Practice
Footnotes
Acknowledgements
Dustin Rabideau, PhD, provided statistical support. We thank Dr. Rochelle Walensky for her leadership, mentorship, and inspiration for this project and her enthusiasm for value of information analysis.
A preliminary abstract for this work was presented at the October 2022 SMDM North American Meeting. The authors declared no potential conflicts of interest with respect to the research, authorship, and/or publication of this article. The authors disclosed receipt of the following financial support for the research, authorship, and/or publication of this article: Financial support for this study was provided entirely by a grant from the National Institute of Allergy and Infectious Diseases of the National Institutes of Health (R01 AI093269). The funding agreement ensured the authors’ independence in designing the study, interpreting the data, writing, and publishing the report. The content is solely the responsibility of the authors and does not necessarily represent the official views of the funding sources.
Data Avaliability
Analytic code will be made available on a Web site after publication. In the meantime, code is available upon request to Pamela Pei.
References
Supplementary Material
Please find the following supplemental material available below.
For Open Access articles published under a Creative Commons License, all supplemental material carries the same license as the article it is associated with.
For non-Open Access articles published, all supplemental material carries a non-exclusive license, and permission requests for re-use of supplemental material or any part of supplemental material shall be sent directly to the copyright owner as specified in the copyright notice associated with the article.