The expected value of sample information (EVSI) calculates the value of collecting additional information through a research study with a given design. However, standard EVSI analyses do not account for the slow and often incomplete implementation of the treatment recommendations that follow research. Thus, standard EVSI analyses do not correctly capture the value of the study. Previous research has developed measures to calculate the research value while adjusting for implementation challenges, but estimating these measures is a challenge.
Methods
Based on a method that assumes the implementation level is related to the strength of evidence in favor of the treatment, 2 implementation-adjusted EVSI calculation methods are developed. These novel methods circumvent the need for analytical calculations, which were restricted to settings in which normality could be assumed. The first method developed in this article uses computationally demanding nested simulations, based on the definition of the implementation-adjusted EVSI. The second method is based on adapting the moment matching method, a recently developed efficient EVSI computation method, to adjust for imperfect implementation. The implementation-adjusted EVSI is then calculated with the 2 methods across 3 examples.
Results
The maximum difference between the 2 methods is at most 6% in all examples. The efficient computation method is between 6 and 60 times faster than the nested simulation method in this case study and could be used in practice.
Conclusions
This article permits the calculation of an implementation-adjusted EVSI using realistic assumptions. The efficient estimation method is accurate and can estimate the implementation-adjusted EVSI in practice. By adapting standard EVSI estimation methods, adjustments for imperfect implementation can be made with the same computational cost as a standard EVSI analysis.
Highlights
Standard expected value of sample information (EVSI) analyses do not account for the fact that treatment implementation following research is often slow and incomplete, meaning they incorrectly capture the value of the study.
Two methods, based on nested Monte Carlo sampling and the moment matching EVSI calculation method, are developed to adjust EVSI calculations for imperfect implementation when the speed and level of the implementation of a new treatment depends on the strength of evidence in favor of the treatment.
The 2 methods we develop provide similar estimates for the implementation-adjusted EVSI.
Our methods extend current EVSI calculation algorithms and thus require limited additional computational complexity.
The expected value of sample information (EVSI) can be a tool for research prioritization and trial design as it calculates the value of collecting additional information through a proposed study with a specific design.1,2 When coupled with a health economic decision model,3 EVSI calculates the value of reducing the statistical uncertainty in the parameters underlying this model before making a decision. The information collected in a study has value if it indicates that the current optimal treatment is, in fact, nonoptimal. This is because the information has prevented decision makers from implementing the incorrect treatment and thereby incurring an opportunity loss.4
EVSI can prioritize studies with the highest expected net economic benefit by computing EVSI for a range of proposed studies and subtracting the study costs.5 This prioritization process requires an estimate of the population-level EVSI from which the study costs are subtracted to compute the expected net benefit of sampling (ENBS).6 Population-level EVSI is usually estimated by multiplying the individual-level EVSI, the output of standard calculations, by the number of people who would be affected by the decision in a given year and the decision horizon.6 This decision horizon is defined as the length of time before the decision will be reassessed (i.e., due to the development of a new treatment option).7
This estimation of the population-level EVSI assumes that any treatment recommended following the study is implemented for all future patients.8,9 In practice, this assumption is unrealistic, as treatment recommendations are often slow to diffuse into clinical practice.10 Thus, standard estimates of the population-level EVSI will result in biased ENBS estimates, although the direction of this bias is dependant on the underlying decision model and the definition of the counterfactual.9,11 Thus, ENBS can be estimated accurately only if the population-level EVSI is adjusted for realistic expectations about the implementation of the recommended treatment, following study completion.12
Several frameworks consider the interplay between the value of information and imperfect implementation,8–10,12 although Fenwick et al.12 considered only the value of perfect, rather than study-specific, information. Andronis and Barton9 extended the Fenwick et al. framework to define an implementation-adjusted EVSI but facilitated their calculations by making the unrealistic assumption that the speed of adoption and the saturation level of the most cost-effective treatment is not related to the future data. In contrast, Willan and Eckermann8 suggested that the implementation dynamics depend on the probability that a given treatment is cost effective; that is, treatments with a higher probability of cost-effectiveness achieve a higher saturation level.8 Finally, Grimm et al.10 split the value of a research study into 2 components that compute the research’s impact on implementation and information separately.
Willan and Eckermann8 computed the implementation-adjusted EVSI by assuming that both the value of each treatment and the data collected in the study follow a normal distribution, allowing for analytical results. Elsewhere, Grimm et al.10 did not present an algorithm to estimate the value of the research’s impact on implementation. Thus, the value of a research study, adjusting for imperfect implementation, can currently be achieved only in a small number of models that meet these normality assumptions. To overcome the practical challenge of adjusted analyses, we develop 2 algorithms to estimate the implementation-adjusted EVSI, irrespective of the underlying model structure and study design.
First, we define EVSI and how it can be adjusted for imperfect implementation.8 A general purpose nested simulation algorithm is then adjusted to estimate the implementation-adjusted EVSI.4 This algorithm can be applied irrespective of the model complexity and the data-generation process. However, as is the case with nonadjusted EVSI estimation,13 this method is computationally intensive, acting as a significant barrier for the proposed analyses.
Recent computation methods have been developed to efficiently compute individual-level unadjusted EVSI irrespective of the structural form of the underlying health economic decision model and study design.14–19 However, these methods cannot directly estimate the implementation-adjusted EVSI, as the probability that a given intervention is cost-effective cannot be estimated. Thus, one of these methods, known as the moment matching method,18,19 is adapted so this probability can be estimated. From this, the implementation-adjusted EVSI can then be computed. This novel method allows efficient estimation of the implementation-adjusted EVSI, based on realistic model structures and trial designs.
Following the development of these 2 methods, the implementation-adjusted EVSI is estimated for 3 proposed studies based on a previously published example. The computationally intensive nested simulation method and the adapted efficient computation method give similar estimates of the implementation-adjusted EVSI. As expected, the efficient computation method is significantly faster than the nested simulation method. Importantly, as these 2 methods are adjusted from currently available computation methods, estimating the implementation-adjusted EVSI does not increase the computational complexity of the EVSI analysis. Thus, the implementation-adjusted EVSI can be easily estimated, and the implementation-adjusted net value of research can be used to determine the optimal study design for future data collection, irrespective of model structure.
EVSI
Health economic decision models estimate the costs and benefits of different treatment options to help decision makers select the optimal treatment from potential alternatives. These models are based on a set of model parameters that represent real-world quantities (e.g., prevalence, quality of life weights, relative effects, and treatment costs). The statistical uncertainty in the estimates of these parameters is usually characterized through a joint probability distribution in a process known as probabilistic analysis (or probabilistic sensitivity analysis). The costs and benefits estimated from a probabilistic health economic decision model can be combined to measure the net benefit of a given treatment (measured in monetary or health units), denoted , .20 Given the current evidence about the parameters, defined in , the best treatment is the one that maximizes the expected net benefit, .21 The net benefit measures the average benefit across the whole population, implying that , , would be known if all parameter uncertainty could be resolved.22
EVSI calculates the value of collecting additional information about the model parameters to improve decision making. Assume that this information is collected through a proposed research study that aims to collect data .23 If the data were collected and realized to a specific data set , then it would be combined with the current evidence to update the distribution of , . This updated distribution for would change the distribution for the net benefits , . The (potentially new) optimal treatment would again be found by taking the expectation of the net benefit . From this, the value of observing is
However, as the data have not been collected, the EVSI is calculated by taking an expectation over all possible studies23:
The distribution of all potential data sets is defined through the joint distribution
where is the sampling distribution of the data conditional on the parameters and is the current distribution of the model parameters, defined for the probabilistic analysis.
Adjusting for Imperfect Implementation
Willan and Eckermann8 defined the implementation-adjusted EVSI () as the difference between the expected opportunity loss under the current decision and the expected opportunity loss of the decision made with additional information. The supplementary material demonstrates that this definition can be expressed as the difference between the “value of the current decision” and the “expected value of the decision made with additional information” to more closely mimic the standard EVSI definition. The value of the current decision is equal to
where is the current market share of the th intervention. The phrase market share indicates the proportion of eligible patients who receive intervention , even in settings where there is not a traditional market (e.g., for a public health intervention that is rolled out over time).
The value of the decision made after a specific additional data set has been collected is
where is the market share of the th intervention, conditional on the observed data . The value is then the difference between and . However, the data have not been observed, and so is defined by taking the expectation of over all possible data sets
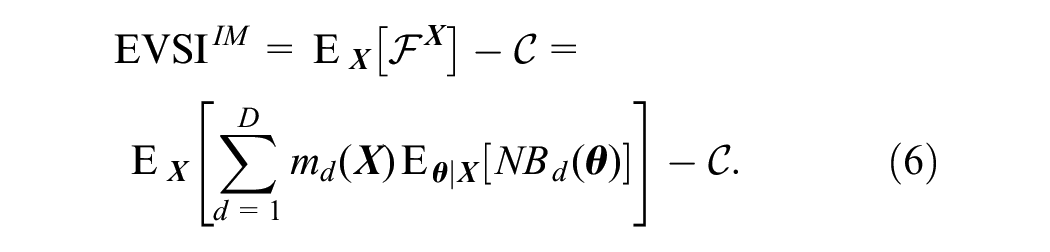
The value of the current decision, , is unlikely to be equal to the value of the optimal treatment, because adjustments must be made for current issues in implementation.11 Note that is estimated at the individual level, with the population-level calculated by multiplying by the number of people affected yearly by the decision and the decision horizon, as in standard EVSI analyses.6
, defined in Eq. 6, is equal to the expected value of a specific implementation measure, defined by Grimm et al.10 in Appendix Equation A.3. Grimm et al. used this wording as calculates the expected value the decision maker would gain by changing the implementation of the treatments based on the sample information. Thus, it is unclear whether should be considered a value of information measure or a value of implementation measure. In settings in which the collected data do not affect the implementation levels, that is, where for all , then computes the value of improving implementation. However, provided the future market share is related to the collected data, computes the value of collecting information to improve implementation. In this case, information has positive value when it increases the market share of the most cost-effective treatment, based on the available evidence.
Defining the Sample Specific Market Share
All EVSI calculation methods estimate , across the distribution of plausible data sets .24 Thus, is calculated by estimating the sample-specific market share . Willan and Eckermann defined , , as a function of the probability that a given intervention is the most cost-effective, ,8
with the functional form of dependent on the decision problem. For example, if clinical practice is reticent to move away from current practice (), then a higher probability of cost-effectiveness would be required to implement the novel treatment (). Thus, to calculate , must be estimated.
Estimating the Implementation-Adjusted EVSI
Nested Monte Carlo Simulation
Unless restrictive assumptions are made, EVSI is estimated using simulation-based methods.24 The first general purpose simulation method for estimating EVSI is based on a nested simulation procedure4; first, plausible data sets , are simulated from . Simulations from the marginal distribution of can be obtained by simulating a parameter set and then simulating a data set from for, .23 Following this, simulations from are required for each , denoted . The net benefit for each treatment must be computed for each simulated parameter set , , , requiring evaluations of each net benefit function. The expected net benefit for treatment , conditional on the sample is estimated by calculating the sample average net benefit
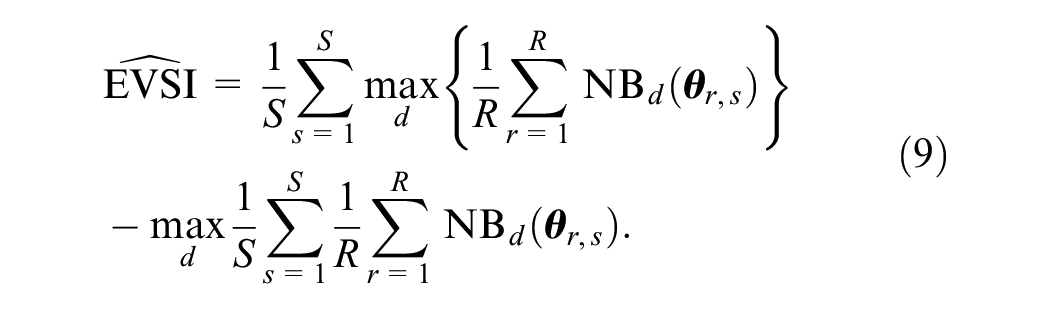
The EVSI is then approximated by
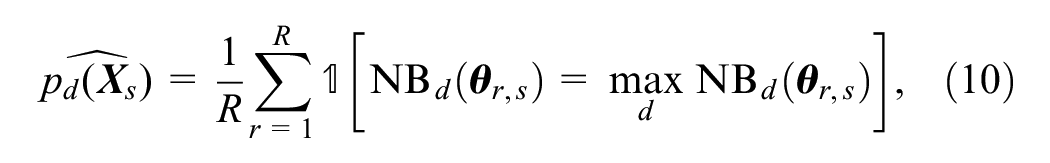
This algorithm can be adapted to estimate by estimating the sample-specific probability of cost-effectiveness for treatment as the proportion of simulations in which treatment is optimal;
where equals 1 if the condition is true and 0 otherwise. From this, the market share for each treatment can be estimated , and ,
However, this algorithm is computationally intensive, as it requires evaluations of the net benefit functions. Thus, in practical health economic decision models in which the net benefit function is nontrivial to compute, this method cannot compute within a feasible time frame.
The Moment Matching Method
The moment matching method is an efficient nested simulation method for EVSI that reduces the number of data sets required to compute EVSI from , usually at least 1000, to , which is usually between 30 and 50.25 The standard moment matching method approximates by reducing the variance of simulated values that derive from a function of the net benefit.25 The required function of is defined by noting that the sampling distribution of is typically dependent on a subset of the model parameters . The moment matching method then rescales the conditional expectation of the net benefit, conditional on , . In general, can be estimated by fitting a nonparametric regression between the simulated values of and the simulated net benefit values that were calculated with the specific value of and extracting the fitted values from this regression.26 If the sampling distribution of the data is defined using all the model parameters, then , and EVSI can then be approximated by rescaling directly.
To determine the variance reduction factor, data sets are simulated from the distribution of plausible data sets, , .23 For each of these data sets, values are simulated from , and compute the net benefit for each treatment option, . For each simulated data set, the sample variance of the net benefits is calculated, before computing the average variance across these estimates. Finally, the simulated values for are rescaled so their variance is equal to the difference between the variance of the initial net benefit simulations and the average variance from the nested simulations.25 This rescaling provides simulations , , that approximate for each decision option . To accurately estimate the EVSI, the data sets should be generated so they cover the complete range of possible data sets. This can be achieved by extracting the quantiles from the simulated values of from the probailistic analysis. A separate data set is then generated for each quantile.25 Functions in R are provided in the supplementary material to estimate and specify the appropriate values of to generate the required data sets.
Adjusting the Moment Matching Method for Imperfect Implementation
As the standard moment matching procedure estimates only the distribution of the mean net benefit, conditional on the future data, it cannot estimate the probability of cost-effectiveness , which depends on the full distribution of the net benefit. Thus, currently the moment matching method can estimate only for the data sets used in the nested simulation procedure and is now extended to compute for all plausible data sets.
The standard moment matching method produces simulations of , . In general, is related to the value of , as the larger the expected net benefit, the more likely the treatment is to be cost-effective. Therefore, this extension for the moment matching method aims to estimate the probability of cost-effectiveness, , as a function of . To achieve this, is estimated for each of the data sets, , from the nested simulations using Eq. 10, with estimated from Eq. 8. From these estimates, nonlinear regression is used to approximate the function ;
where is the error due to estimating by simulation.
The functional form for is selected by noting that 1) is a probability and thus constrained between 0 and 1; 2) as increases, also increases as the treatment is becoming more valuable; and 3) increases smoothly as increases, that is, if the expected net benefits are similar than the probability of cost-effectiveness will also be similar. The generalized logistic function is a flexible function that exhibits these 3 features,27 so
where , , and are from the data and for . , , and can be estimated using either Bayesian or frequentist methods. However, maximum likelihood methods can struggle to converge in some settings, while all 3 model parameters can be estimated in a Bayesian framework using weakly informative priors to improve convergence. These priors are discussed, along with model code, in the supplementary material.
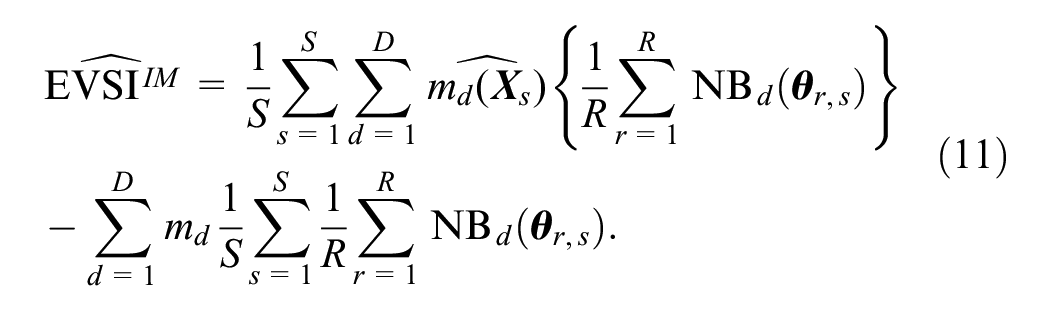
Once estimates have been obtained for , , and , the regression model can calculate the fitted values of for each of the simulations for , , denoted . The market share of each treatment can then be computed using ). From this, can be estimated using the moment matching method as
Estimating Implementation-Adjusted EVSI across Sample Size
The moment matching method can be extended to estimate EVSI across a range of sample sizes of the proposed study (.19 This is achieved by creating a sequence of sample sizes, , , between and . Each simulated data set is then generated with a different sample size, that is, the data set contains data from simulated individuals. The variance reduction factor for a given sample size is then found using nonlinear regression.19 Specifically, a nonlinear regression is fit between the posterior variance of the net benefit conditional on the sample and the sample size . The variance reduction factor for the sample size is then estimated by calculating the fitted value from this regression for . The Moment matching estimation method for is now extended so it can be used across sample size.
To achieve this, the method proceeds, similar to before, by first calculating and for each of the nested simulations. As each of these pairs has a different sample size, the regression equation is adapted so is also a function of the sample size ,
where . In this setting, can still be represented by a generalized logistic function but is adjusted to account for the fact that the larger the sample size, the faster the probability of cost-effectiveness will increase from 0 and 1,
where is an additional parameter defining the rate at which the probability of cost-effectiveness increases due to the sample size. The 4 parameters in this model, , , , and , can be estimated in a Bayesian or frequentist framework, with the best performance seen using Bayesian methods with weakly informative priors.
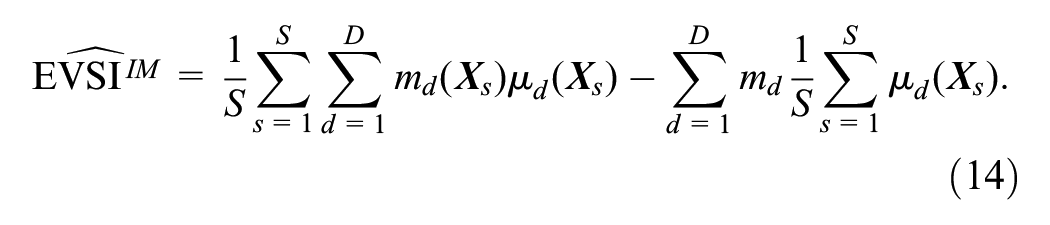
Once these parameters have been estimated, for a specific sample size can be estimated. To achieve this, the values for for the sample size are estimated using the moment matching method. The probability of cost-effectiveness is then estimated by computing . From this, the market share is estimated, and is calculated from Eq. 14.
Calculating EVSI Adjusted for Imperfect Implementation
This section estimates for a previously developed health economic model4 to compare the 2 estimation methods and demonstrate their accuracy. The computational efficiency of the augmented moment matching method is also investigated.
A Health Economic Decision Model for Reduced Risk of a Critical Event
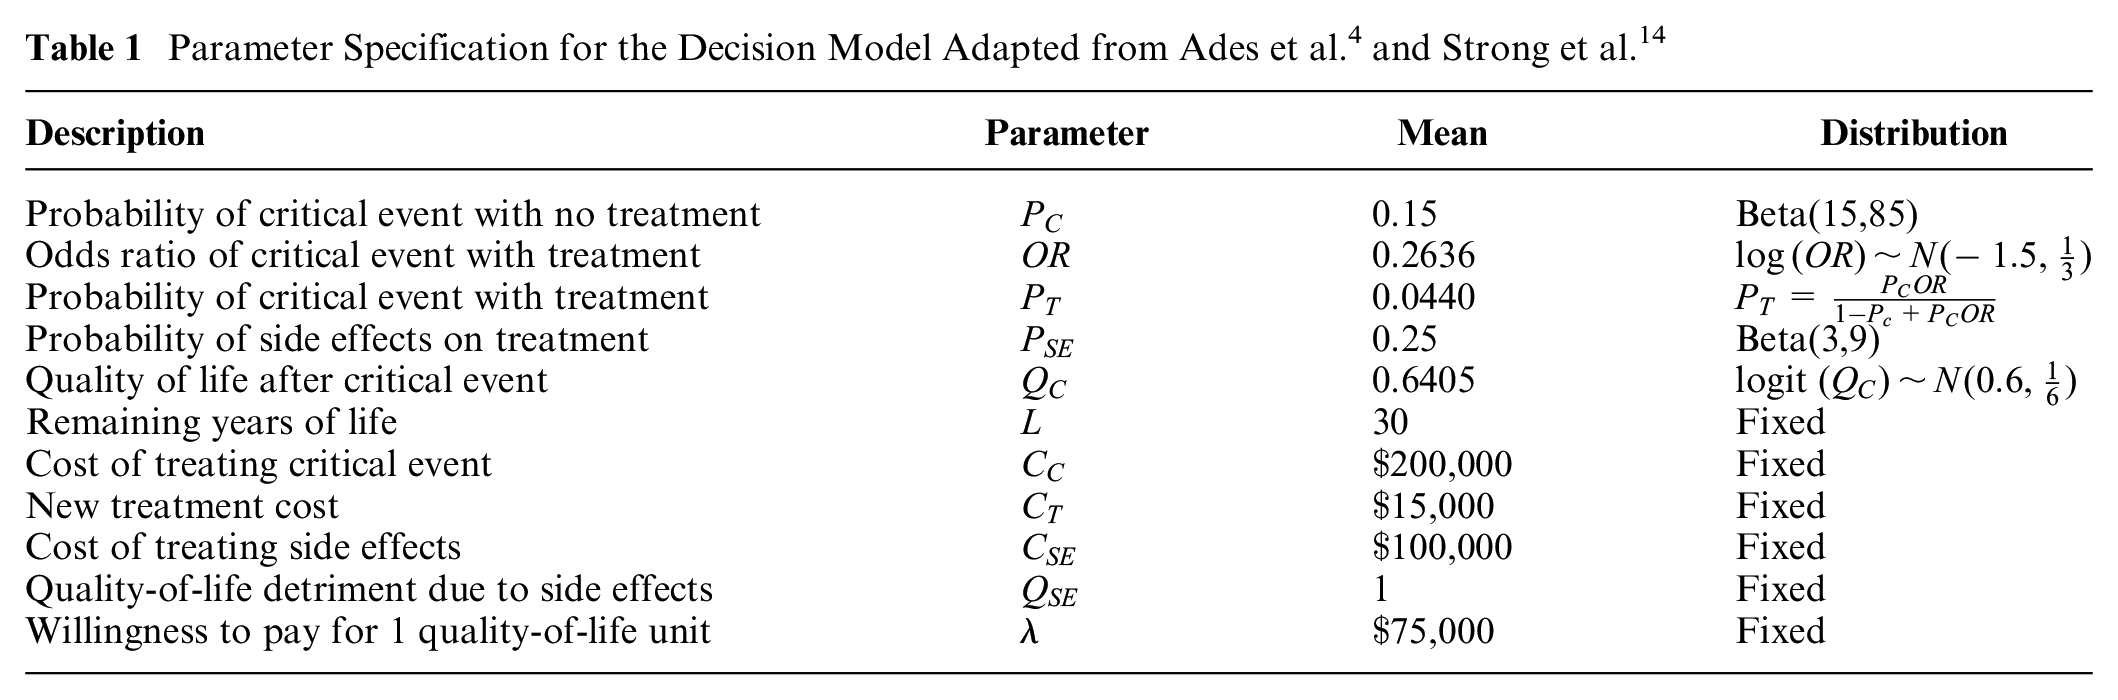
The case study is based on a previously developed decision tree model.4 This decision model has 2 interventions, (standard care) and (novel treatment). Individuals are at risk of a critical event that would lead to a reduced quality of life () for the remaining years of their life and incur a yearly treatment cost (). The novel treatment has a fixed cost () and reduces the probability of experiencing this critical event but with a risk of side effects. These side effects give a short-term reduction in quality of life ( and incur a one-off cost (). The model has 4 uncertain parameters, the baseline probability of critical event (), the odds ratio of the critical event under the novel treatment (), the probability of side effects on treatment (, and the quality-of-life detriment due to the critical event. These 4 parameters are modeled using independent probability distributions with the distributions, and the values of the fixed parameters, given in Table 1.
Parameter Specification for the Decision Model Adapted from Ades et al.4 and Strong et al.14
Description
Parameter
Mean
Distribution
Probability of critical event with no treatment
0.15
Beta(15,85)
Odds ratio of critical event with treatment
0.2636
Probability of critical event with treatment
0.0440
Probability of side effects on treatment
0.25
Beta(3,9)
Quality of life after critical event
0.6405
logit
Remaining years of life
30
Fixed
Cost of treating critical event
Fixed
New treatment cost
Fixed
Cost of treating side effects
Fixed
Quality-of-life detriment due to side effects
1
Fixed
Willingness to pay for 1 quality-of-life unit
Fixed
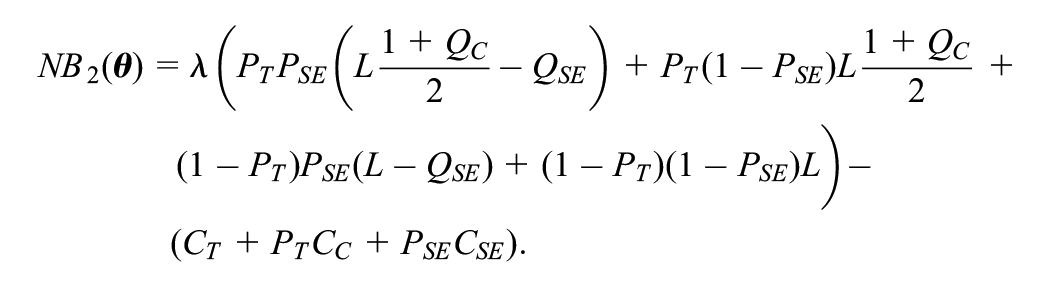
The decision tree structure of the model implies that the net benefit is calculated as follows for and , respectively:
Proposed Future Studies
Three alternative proposed studies are considered.4 The first study aims to reduce uncertainty in the probability of side effects with the new treatment by offering 60 individuals the treatment and observing the number who experience side effects. The data are modeled using a binomial distribution, . The second study aims to reduce uncertainty in the quality of life after the critical event by recording the quality of life for 100 individuals who have experienced the critical event. The individual-level variation in the logit of quality of life is modeled using a normal distribution with variance 2, . Finally, study 3 aims to reduce uncertainty in the odds ratio of effectiveness of the new treatment compared with the standard of care. This study undertakes a randomized controlled trial with 200 patients on each arm with the data simulated from 2 binomial distribution, one for each treatment arm, and .
Dynamics of Implementation
Based on the current information, standard care has an average net benefit of , and the novel treatment has an average net benefit of . Thus, the current optimal treatment is the novel treatment. However, there is substantial uncertainty about this result, with only a 57% chance that the novel treatment is the most cost-effective. To adjust for imperfect implementation, the risk of side effects for the novel treatment is currently assumed to make clinicians reluctant to implement it. Thus, the novel treatment is not currently used, and the value of the current decision is
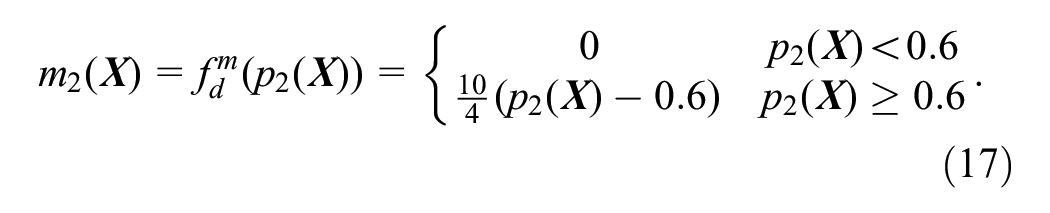
It is then assumed that clinicians will begin to adopt the novel treatment when the probability of cost-effectiveness is greater than 60%. However, some clinicians will have higher levels of risk aversion and will therefore avoid the novel treatment until the evidence of cost-effectiveness is clearer. The uptake of the novel treatment is assumed to relate linearly to the probability of cost-effectiveness. Furthermore, the uptake is assumed to be instantaneous and static, with full treatment switching achieved if the probability of cost-effectiveness is 1. This gives a functional form of
As the example has 2 potential decision options, is defined as to estimate across the range of plausible data sets .
Assessing the Performance of the Moment Matching Method
To assess the estimation methods for , the implementation-adjusted EVSI will be calculated for the 3 studies. To determine the expected value of the standard of care and the novel treatment under current information, was set to 10,000. To ensure a feasible computation time for the nested Monte Carlo method, and , and for the moment matching method, and .
The 2 methods will be compared in terms of the estimates of across the 3 examples. The estimates of the relationship between the probability that the novel treatment is cost-effective and the sample-specific incremental net benefit (i.e., the difference between the net benefit for no treatment and the novel treatment) will also be compared graphically to determine whether the functional form chosen for the regression is sufficiently flexible to capture the varied relationships. Finally, the computational time required to generate the estimate will be computed.
Results
Implementation-Adjusted EVSI
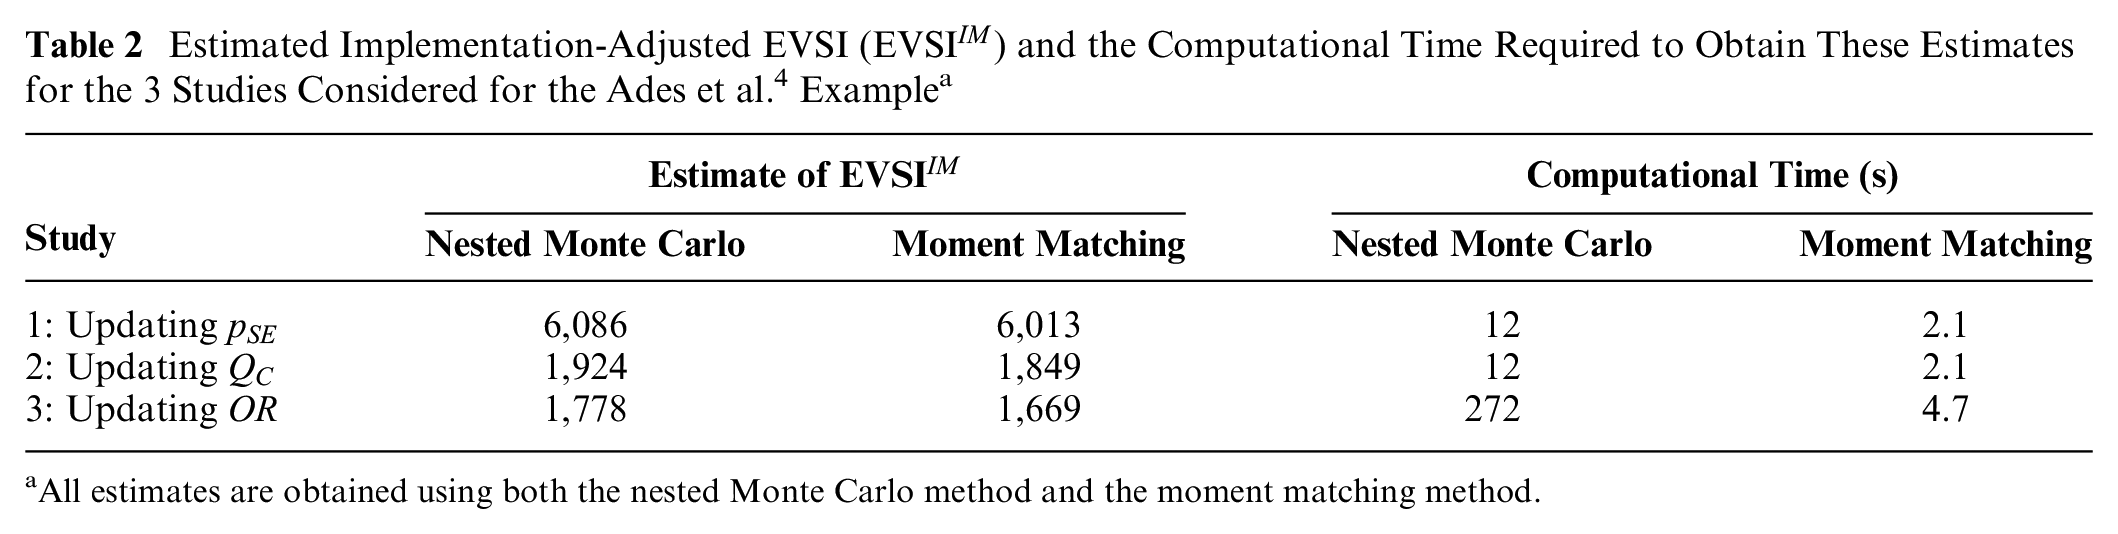
Table 2 contains the estimates from the nested Monte Carlo method and the augmented moment matching method. The 2 methods are very similar, with the largest discrepancy observed for study 3, which collects additional information to estimate the odds ratio of the critical event with treatment. However, the discrepancy is only about 6% of the estimate. Note that as both of these estimates are obtained using simulation methods, some differences between the 2 estimates are expected. Thus, it seems likely that both methods were able to accurately estimate in this example without making restrictive assumptions about the distribution of the net benefit or the data-generating mechanism.
Estimated Implementation-Adjusted EVSI () and the Computational Time Required to Obtain These Estimates for the 3 Studies Considered for the Ades et al.4 Examplea
Study
Estimate of
Computational Time (s)
Nested Monte Carlo
Moment Matching
Nested Monte Carlo
Moment Matching
1: Updating
6,086
6,013
12
2.1
2: Updating
1,924
1,849
12
2.1
3: Updating
1,778
1,669
272
4.7
All estimates are obtained using both the nested Monte Carlo method and the moment matching method.
Estimating the Relationship between the Probability of Cost-Effectiveness and the Expected Net Benefit
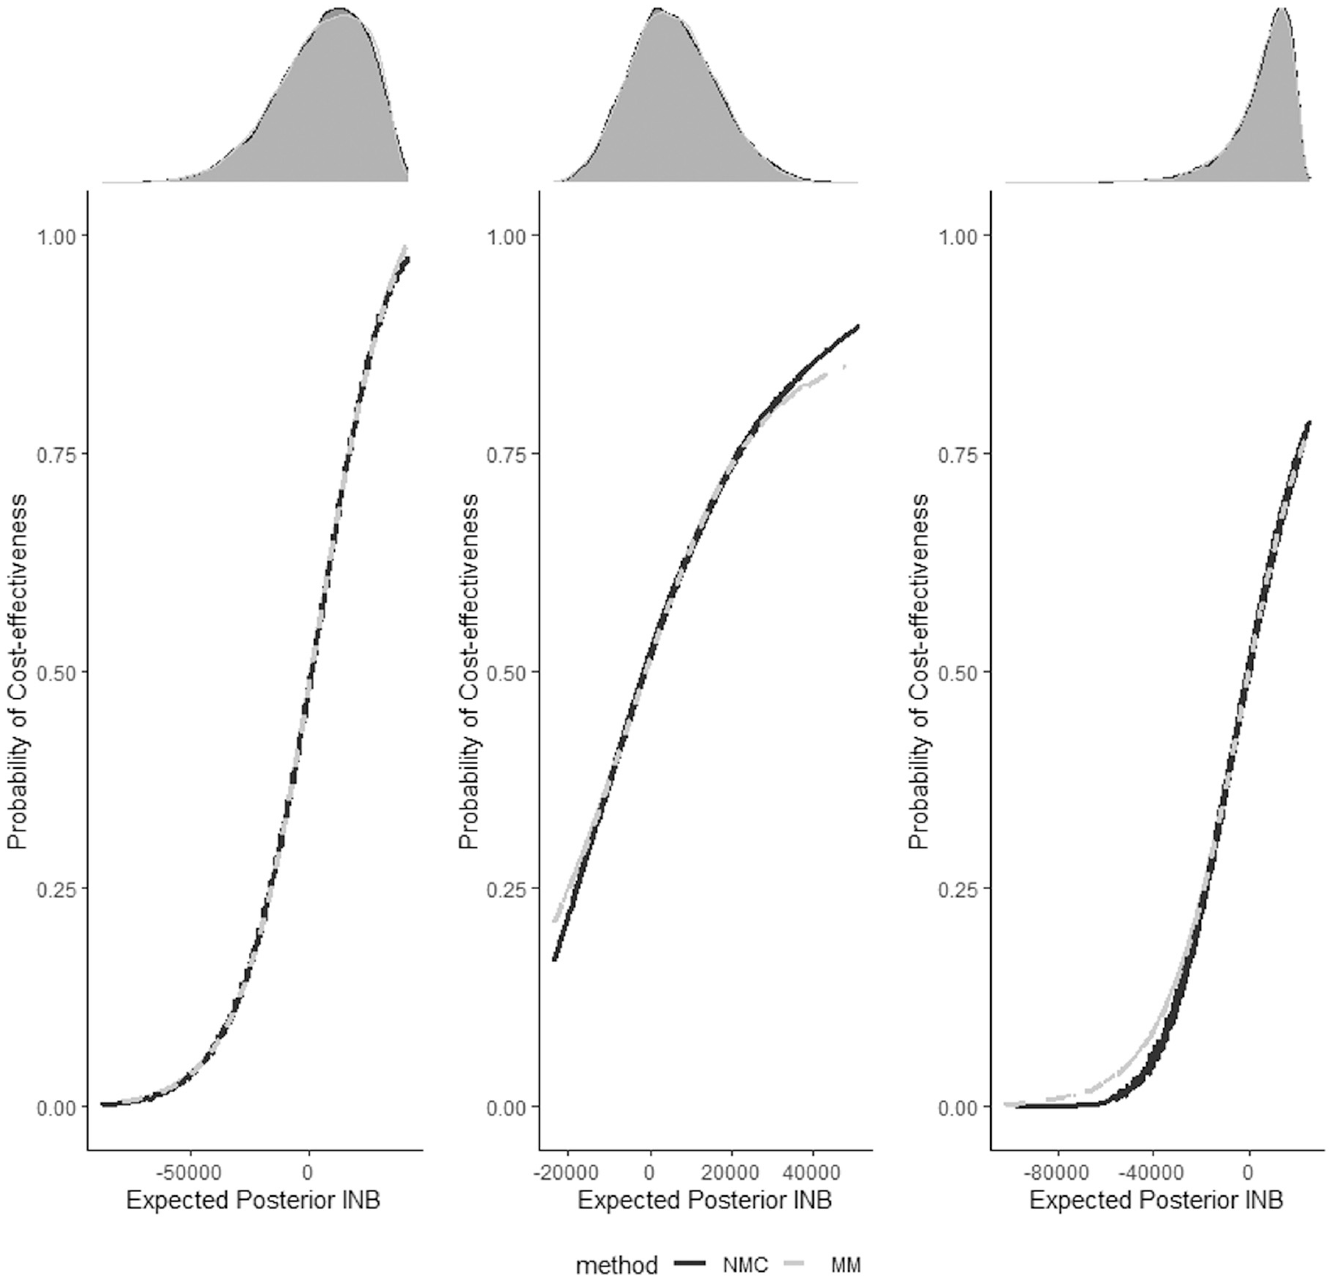
Figure 1 plots the relationship between , the probability that the novel treatment is cost-effective, and , the expected posterior incremental net benefit. In this case, positive values of the incremental net benefit indicate that the novel treatment is optimal, so would be expected to be about 0.5 when is equal to 0. The gray dashed line represents the relationship estimated with the moment matching method, and the solid black line represents the relationship estimated with the nested Monte Carlo method. For all 3 studies, the relationship between and is similar across the 2 methods. The shape of the relationship changes across the 3 studies but is well captured by the generalized logistic function proposed for the regression. Discrepancies between the 2 curves always occur in areas of low density for the expected incremental net benefit, shown by the density plots at the top in Figure 1. As is the product of and a function of , these sections where the curve is poorly estimated have very limited impact on the overall results. These functions are displayed for a given sample size. However, the moment matching method can estimate for different alternative sample sizes. In this case, the comparison values estimated using nested Monte Carlo would have to be recomputed and so these results are not shown.
Estimated functional relationship between the probability of cost-effectiveness and the sample-specific expected incremental net benefit between the 2 treatment options for the 3 examples. The left-hand panel is for study 1, which updates ; the middle panel is for study 2, which updates ; and the right-hand panel is for study 3, which updates . The black line represents the estimates generated by the nested Monte Carlo (NMC) method, and the gray dashed line represents the estimates generated by the moment matching (MM) method. The density of the sample-specific expected incremental net benefit is represented above each plot, with a gray density plot (estimated by the MM method) plotted over a black density plot from the NMC method.
Computational Time
Table 2 displays the time taken (in seconds) to compute the for all 3 examples for the 2 methods. The moment matching method is between 6 and 60 times faster than the nested Monte Carlo method. For this example, the moment matching method requires 100 times fewer model runs than the nested Monte Carlo method to achieve the same accuracy. Fitting the regression model requires a fixed computational cost of about 2 s. Thus, in decision models in which each model run has a nonnegligible computational cost, the moment matching method will be about 100 times faster than the nested Monte Carlo method, if , , and are set to the same values used in this article. Finally, note that the moment matching method estimates across sample size, so the reported computational times also allow us to recompute for alternative sample sizes.
Discussion
It has been suggested that value-of-information analyses should consider realistic assumptions about the implementation of new health care technologies.8–10,12 measures the expected value of changing the implementation levels of the treatments through a research study by assuming that treatment implementation is likely to be more complete and faster if stronger evidence exists in favor of that treatment.8,10 However, the only method that discussed the computation of relied on restrictive assumptions to obtain analytic formulas.8 Thus, it was unclear how to compute in complex models that did not respect these assumptions.28
This article addresses this gap by developing 2 methods to estimate the probability that a given treatment is cost-effective across the range of plausible data sets. A computationally expensive nested simulation method to estimate is developed, based on the standard nested EVSI calculation method.4 The moment matching method for EVSI calculation is then extended to efficiently estimate by using nonlinear regression to estimate the probability of cost-effectiveness from the expected posterior net benefit. These 2 methods provide similar estimates of , although the adjusted moment matching method is substantially faster. An extended moment matching method is also introduced to compute across different sample sizes for the proposed future study. Thus, can now be computed for a range of models to support research prioritization and design, either alone8 or combined with the standard EVSI to compute the expected value of research.10
A limitation of this work is that to calculate using these methods, the function that calculates the market share based on the probability of cost-effectiveness must be specified. The example in this article assumed that market share increased linearly to 100%, when the probability of cost-effectiveness for the novel treatment is greater than 0.6. However, is likely to be more complex in practice and may be challenging to determine. Grimm et al.10 used diffusion models to make realistic assumptions about the implementation changes over time, but these would need to be reestimated to determine how the strength of evidence affects diffusion.
If the functional form of is unknown, it would be possible to undertake a sensitivity analysis to its functional form. Using these methods, this sensitivity analysis would be relatively inexpensive, as the probability of cost-effectiveness would not need to be recomputed. However, it may be challenging to determine the appropriate range of functional forms that should be considered in this sensitivity analyses, especially if the possibility of implementation levels changing over time was also included.
Another limitation is the assumption that implementation is related to the outcome of a cost-effectiveness analysis (i.e., the probability of cost-effectiveness). Implementation could be more closely related to results based on the primary clinical outcome alone, rather than the cost-effectiveness, or based on safety concerns. These methods could be adapted to estimate the probability that a given treatment is effective (i.e., the primary clinical outcome is largest for a specific treatment) or safe (i.e., adverse events are lower). The market share could then be estimated based on this probability of effectiveness or safety. This analysis would jointly consider potential complementary aspects of clinical decision making (i.e., cost-effectiveness and clinical efficacy or safety) in study design.
Supplemental Material
sj-pdf-1-mdm-10.1177_0272989X211073098 – Supplemental material for Calculating Expected Value of Sample Information Adjusting for Imperfect Implementation
Supplemental material, sj-pdf-1-mdm-10.1177_0272989X211073098 for Calculating Expected Value of Sample Information Adjusting for Imperfect Implementation by Anna Heath in Medical Decision Making
Supplemental Material
sj-r-1-mdm-10.1177_0272989X211073098 – Supplemental material for Calculating Expected Value of Sample Information Adjusting for Imperfect Implementation
Supplemental material, sj-r-1-mdm-10.1177_0272989X211073098 for Calculating Expected Value of Sample Information Adjusting for Imperfect Implementation by Anna Heath in Medical Decision Making
Supplemental Material
sj-r-2-mdm-10.1177_0272989X211073098 – Supplemental material for Calculating Expected Value of Sample Information Adjusting for Imperfect Implementation
Supplemental material, sj-r-2-mdm-10.1177_0272989X211073098 for Calculating Expected Value of Sample Information Adjusting for Imperfect Implementation by Anna Heath in Medical Decision Making
Supplemental Material
sj-r-3-mdm-10.1177_0272989X211073098 – Supplemental material for Calculating Expected Value of Sample Information Adjusting for Imperfect Implementation
Supplemental material, sj-r-3-mdm-10.1177_0272989X211073098 for Calculating Expected Value of Sample Information Adjusting for Imperfect Implementation by Anna Heath in Medical Decision Making
Supplemental Material
sj-r-4-mdm-10.1177_0272989X211073098 – Supplemental material for Calculating Expected Value of Sample Information Adjusting for Imperfect Implementation
Supplemental material, sj-r-4-mdm-10.1177_0272989X211073098 for Calculating Expected Value of Sample Information Adjusting for Imperfect Implementation by Anna Heath in Medical Decision Making
Footnotes
Acknowledgements
I would like to thank Sabine Grimm and Alan Brennan for their very helpful discussions on implementation-adjusted EVSI. I would also like to thank Petros Pechlivanoglou for his comments on an early draft of this article and 2 anonymous reviews for their comments.
This work was presented at the Society of Medical Decision Making, North America Meeting 2021.
The author declared no potential conflicts of interest with respect to the research, authorship, and/or publication of this article.
The author disclosed receipt of the following financial support for the research, authorship, and/or publication of this article: Anna Heath was funded by the Canadian Institutes of Health Research through the PERC SPOR iPCT grant (funding No. MYG-151207; 2017–2020), a Canada Research Chair in Statistical Trial Design and the Natural Sciences and Engineering Research Council of Canada (award No. RGPIN-2021-03366). The funding agreement ensured the authors’ independence in designing the study, interpreting the data, writing, and publishing the report.
ORCID iD
Anna Heath
Supplemental Material
Supplementary material for this article is available on the Medical Decision Making website at .
References
1.
SchlaiferR. Probability and Statistics for Business Decisions. New York: McGraw-Hill; 1959.
2.
RaiffaHSchlaiferH. Applied Statistical Decision Theory. Boston: Harvard University Press; 1961.
3.
BriggsASculpherMClaxtonK. Decision Modelling for Health Economic Evaluation. Oxford (UK): Oxford University Press; 2006.
4.
AdesALuGClaxtonK. Expected value of sample information calculations in medical decision modeling. Med Decis Making. 2004;24:207–27.
5.
ContiSClaxtonK. Dimensions of design space: a decision-theoretic approach to optimal research design. Med Decis Making. 2009;29(6):643–60.
6.
RotheryCStrongMKoffijbergH, et al. Value of information analytical methods: report 2 of the ispor value of information analysis emerging good practices task force. Value Health. 2020;23(3):277–86.
7.
PhilipsZClaxtonKPalmerS. The half-life of truth: what are appropriate time horizons for research decisions?Med Decis Making. 2008;28(3):287–99.
8.
WillanAEckermannS. Optimal clinical trial design using value of information methods with imperfect implementation. Health Econ. 2010;19(5):549–61.
9.
AndronisLBartonP. Adjusting estimates of the expected value of information for implementation: theoretical framework and practical application. Med Decis Making. 2016;36(3):296–307.
10.
GrimmSDixonSStevensJ. Assessing the expected value of research studies in reducing uncertainty and improving implementation dynamics. Med Decis Making. 2017;37(5):523–33.
11.
EckermannSWillanA. Expected value of sample information with imperfect implementation: Improving practice and reducing uncertainty with appropriate counterfactual consideration. Med Decis Making. 2016;36(3):282–3.
12.
FenwickEClaxtonKSculpherM. The value of implementation and the value of information: Combined and uneven development. Med Decis Making. 2008;28(1):21–32.
13.
HeathAKunstNJacksonC, et al. Calculating the expected value of sample information in practice: considerations from 3 case studies. Med Decis Making. 2020;40(3):314–26.
14.
StrongMOakleyJBrennanABreezeP. Estimating the expected value of sample information using the probabilistic sensitivity analysis sample: a fast nonparametric regression-based method. Med Decis Making. 2015;35(5):570–83.
15.
MenziesN. An efficient estimator for the expected value of sample information. Med Decis Making. 2016;36(3):308–20.
16.
JalalHGoldhaber-FiebertJKuntzK. Computing expected value of partial sample information from probabilistic sensitivity analysis using linear regression metamodeling. Med Decis Making. 2015;35(5):584–95.
17.
JalalHAlarid-EscuderoF. A Gaussian approximation approach for value of information analysis. Med Decis Making. 2017;38(3):174–88.
18.
HeathAManolopoulouIBaioG. Efficient Monte Carlo estimation of the expected value of sample information using moment matching. Med Decis Making. 2018;38(2):163–73.
19.
HeathAManolopoulouIBaioG. Estimating the expected value of sample information across different sample sizes using moment matching and nonlinear regression. Med Decis Making. 2019;39(4):347–59.
20.
StinnettAMullahyJ. Net health benefits a new framework for the analysis of uncertainty in cost-effectiveness analysis. Med Decis Making. 1998;18(2):S68–80.
21.
ClaxtonK. The irrelevance of inference: a decision-making approach to stochastic evaluation of health care technologies. J Health Econ. 1999;18:342–64.
22.
BriggsAWeinsteinMFenwickEKarnonJSculpherMPaltielA; ISPOR-SMDM Modeling Good Research Practices Task Force, et al. Model parameter estimation and uncertainty: a report of the ISPOR-SMDM Modeling Good Research Practices Task Force-6. Value Health. 2012;15(6):835–42.
23.
HeathAStrongMGlynnDKunstNWeltonNGoldhaber-FiebertJ. Simulating study data to support expected value of sample information calculations: a tutorial. Med Decis Making. August13, 2021. https://doi.org/10.1177/0272989X211026292
24.
KunstNWilsonEGlynnD, et al. Computing the expected value of sample information efficiently: practical guidance and recommendations for four model-based methods. Value Health. 2020;23(6):734–42.
25.
HeathABaioG. Calculating the expected value of sample information using efficient nested monte carlo: a tutorial. Value Health. 2018;21(11):1299–304.
26.
StrongMOakleyJBrennanA. Estimating multiparameter partial expected value of perfect information from a probabilistic sensitivity analysis sample: a nonparametric regression approach. Med Decis Making. 2014;34(3):311–26.
27.
RichardsFJ. A flexible growth function for empirical use. J Exp Botany. 1959;10(2):290–301.
28.
EckermannS. Health Economics from Theory to Practice. New York: Springer; 2017.
Supplementary Material
Please find the following supplemental material available below.
For Open Access articles published under a Creative Commons License, all supplemental material carries the same license as the article it is associated with.
For non-Open Access articles published, all supplemental material carries a non-exclusive license, and permission requests for re-use of supplemental material or any part of supplemental material shall be sent directly to the copyright owner as specified in the copyright notice associated with the article.