
Abstract
Highlights
A stratified SEIR model was developed that captures the role of social contacts in K-12 schools to estimate COVID-19 transmission under different nonpharmaceutical interventions.
While masks, random screening, contact reduction, school closures, and test-to-stay are all beneficial interventions, masks and contact reduction resulted in the greatest reduction in new infections among students from the tested scenarios.
Layered interventions provide more benefits than implementing interventions independently.
The novel coronavirus SARS-CoV-2, with its many highly contagious variants, has spread across the world causing waves of COVID-19 since early 2020. In the United States, young children were not eligible to receive vaccines until November 2, 2021. 1 Childhood vaccination rates remain low across the United States. As of September 2022, according to the North Carolina State Profile Report, 26.3% of people aged 5 to 11 y were fully vaccinated, and 51.5% of people aged 12 to 17 y were fully vaccinated. 2 While vaccination rates remain low, most schools in the United States have returned to in-person instruction and lifted mask requirements. Moreover, variants can continue to emerge over time, and K-12 students may be at higher risk of infection while in school or attending extracurricular activities if there are insufficient prevention strategies in place.
The return of K-12 students to school usually occurs after holidays or vacations; thus, they are often returning from activities such as summer camps or family trips, in which they come in contact with individuals outside of their usual community. As such, the start of school bringing new mixing patterns among students often coincides with surges also associated with increased travel or social interactions. This occurred with the Delta variant in July 2021 (start of fall 2021 semester) and the Omicron variant in January 2022 (start of spring 2022 semester), and it could occur in future academic years. As students return to school, nonpharmaceutical interventions (NPIs) can play an important role in reducing transmission during the school year. Many interventions have been implemented across schools since the beginning of the pandemic, including mask requirements, in-school testing, school closures, and recent test-to-stay practices. 3 While most evidence suggests that school-based interventions can reduce transmission, it is difficult to quantify since randomized control trials were not widely adopted. Thus, we propose a mathematical model that can be used when empirical data may be incomplete.
In this article, we model the spread of COVID-19 in K-12 school settings using a compartmental SEIR model that captures cohorts within schools. Compartmental SIR/SEIR models are a widely used mathematical tool in epidemiology that can be used to examine infectious disease spread and the impact of interventions. Several studies have implemented in-school testing and masks within a single-grouped SIR model to capture the disease transmission of COVID-19 within schools.4–6 Towers and Feng 7 built an age-stratified SIR model to examine the control of influenza among the elderly and concluded that direct contact with infected children caused more than half of the infections among older adults. del Valle et al. 8 also used an age-stratified SIR model to analyze and compare the effect of different mixing patterns on smallpox-like disease prevalence. Several empirical studies of the COVID-19 pandemic stated that implementing sufficient physical distancing, mask usage, and other mitigation policies can help ensure schools reopen safely.9,10 Nonetheless, to the best of our knowledge, we are the first to design a multigrouped SEIR model to specifically simulate social dynamics and quantify COVID-19 transmission within K-12 schools.
Our objective is to estimate the impact of different and potentially layered NPIs, including masks, random screening, contact reduction, school closures, and test-to-stay on COVID-19 transmission within K-12 schools using a mathematical SEIR model. This research was conducted while the Omicron variant was dominant and thus results were based on parameters associated with this variant. However, the methods can be generalized for other variants, and modeling these interventions is important, as it allows us to plan for future outbreaks.
Methods
To implement the interventions, we built a “classroom-stratified” SEIR model to project infections over the length of 1 semester (about 107 d). We extended the homogeneous SIR model built by Yu et al. 4 to a multigrouped SEIR model to take school social dynamics into consideration. Moreover, 2 additional compartments: “exposed” and “presymptomatic infection” were added to capture the distinct characteristic of COVID-19–infected individuals being contagious before developing symptoms.
Disease States
The SEIR model we developed has 13 compartments for each cohort group. As shown in Figure 1, each rectangle represents a mutually exclusive compartment of individuals in different disease states. We discuss each state below; state names are shown in quotations. “Susceptible” are the individuals who are at risk for developing infections from COVID-19. “Exposed” are the people who made contact with an infectious individual and will become infectious later. After being exposed, they move to either the “presymptomatic infection” state and develop symptoms later or to the “asymptomatic infection” state, which represents individuals who have no signs of illness but can still transmit to others. People who show symptoms later stay in the “presymptomatic infection” state for a mean of 2 d before moving to the “symptomatic infection” state. We include a “presymptomatic infection” state as research shows that people infected with COVID-19 can spread the disease 2 d before they show any symptoms. 11 The incubation period, from virus exposure to showing symptoms, is about 5 d for the Alpha variant, 4 d for the Delta variant, and 3 d for the Omicron variant.12,13 Thus, we assumed a latent period of 1 day after patients were exposed to the virus and a presymptomatic period of 2 d in which patients are contagious with the Omicron variant. Moreover, we considered “symptomatic infection” and “asymptomatic infection” separately, as evidence shows that the transmission rates differ between them: the asymptomatic transmission rate is about 45% lower than the symptomatic rate. 14 Among all infections, about 40% show no symptoms through their entire infectious period. 15

Diagram of the multigrouped SEIR model. The staged progression of a total number of m groups is shown in this figure. Each arrow represents a movement between the 2 adjacent states. Susceptible individuals become infected at rate β. If they are randomly selected for in-school weekly screening, they will progress to 1 of the 6 postscreening states; if not selected, they are categorized as RU (“recovered unknown”) when they progress to recovery.
Random screening in schools is embedded into the model. Each of the infectious states is followed by 3 posttesting states: “tested and isolation,”“tested and no isolation,” and “tested and false negative.” Teachers and students who tested positive will isolate themselves with an isolation compliance rate of 90% if they are symptomatic and 70% if they are asymptomatic. Polymerase chain reaction (PCR) tests and rapid tests are not 100% accurate. We assumed a false-negative rate of 15% and 30% for the PCR test and rapid test, respectively. 16
Two noncontagious recovery states were considered in our model. Students and teachers who test positive, whether or not isolated, will stay in the “recovered known” state for approximately 8 d. While the latest guidance from the Centers for Disease Control and Prevention (CDC) ranges from 5 to 20 d, depending on the level of illness or the patient’s preexisting health conditions, we implemented an isolation period of 10 d, which is the recommendation for people who have moderate COVID-19 illness. 17 We presumed the recovery/isolation period of 8 d in the model to account for weekends, as our model treats every day as a school day. Those who were not picked to receive the random screening tests or received false-negative testing results are moved to the “recovered unknown” state, as their infections are unknown outside of the model. Students and teachers will go back to school when the isolation period ends.
Accounting for Classrooms and Subgroups
Single-class SEIR models assume uniform mixing among individuals in the population. We split the population into smaller cohorts to capture the potential impacts of realistic contact patterns. Specifically, we took the K-12 school structure into consideration. North Carolina general statutes about elementary and secondary education state that the student-to-teacher ratio shall not exceed 18, 16, 17, and 17 for kindergarten, first grade, second grade, and third grade, respectively. 18 Thus, for elementary schools (K-5), we modeled 19 groups, representing grades from kindergarten to grade 5 with 3 classes per grade and an additional group representing teachers (6 × 3 + 1 = 19). We assumed that the size of an elementary school is about 500, resulting in 26 students per class and a total of 32 teachers (primary teachers, teacher’s aides, counselors, coaches, etc.). For middle school and high school, we split the population into smaller class groups as well. In addition, mixing patterns are described below and differ by educational stage (K-5, middle, and high school)—capturing realistic nuances. For example, high school students are rarely kept in class cohorts throughout the day/week but instead mix more fully across different classes throughout the day/across days.
We parameterized 3 distinct types of contact matrices to simulate the interactions in school. Each row of the contact matrices sums to 1. Figure 2 shows how the contacts are distributed across different groups in the K-5 structure. “Well-mixed” means every individual is equally likely to make contact with another individual, regardless of his or her group. “Cohort” creates a large number of contacts within classes, fewer contacts within grades, with teachers coming into contact with all 18 classes evenly. “Isolated” is an extreme case in which individuals make contact only with individuals from their own group. We assumed elementary students and teachers make contacts following the “cohort” pattern, whereas high school students and teachers are well-mixed as they take courses with different groups of students and teachers every day. Social behaviors of middle school students are somewhere between elementary school and high school, as they take courses with different people and have home rooms at the same time.
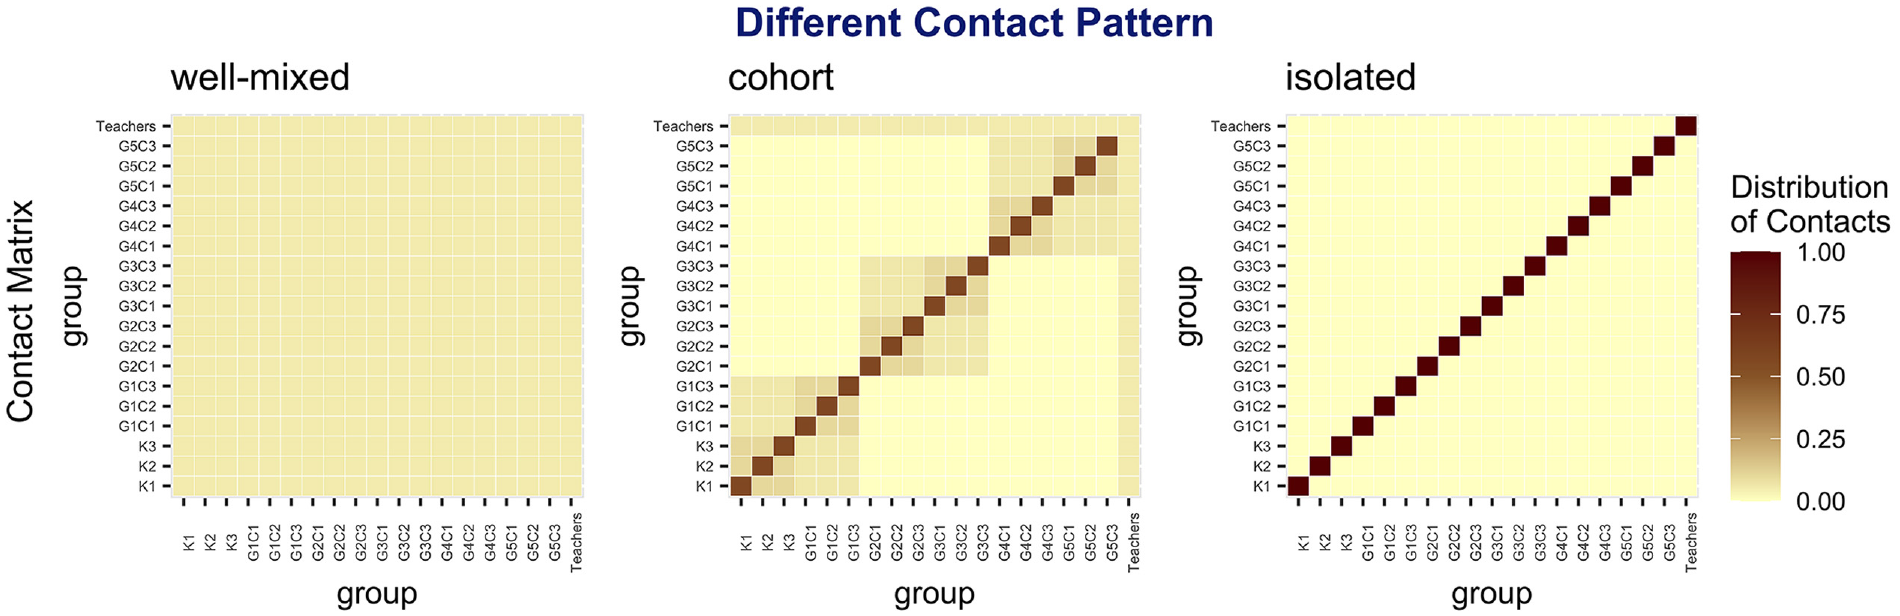
Distribution of contacts under different contact pattern assumptions (K-5 structure).
Because vaccines are not 100% effective and because of potential immunity loss or immune escape from the Omicron variant, 19 we make conservative assumptions about the level of incoming protection (immunity) against COVID-19. Note that this incoming immunity accounts for protection from either vaccination or previous infection. Based on vaccination rates in North Carolina and COVID-19 cases as of December 3, 2021, the level of incoming protection was roughly assumed to be 30% for K-5 students, 50% for high school students, and 60% for teachers by early December 2021.2,20,21 For the Omicron variant, which became dominant in the United States by late December 2021, the level of incoming protection reduces to accommodate observed breakthrough infection. Table 1 demonstrates the levels of incoming protection we examined for the Omicron variant.
Assumed Incoming Protection Level of Students and Teachers for the Omicron Variant a

Each of the rows presents a specific group of people in school. The columns present the scenarios defined by Centers for Disease Prevention’s scenario hub (round 11). 22 For example, for K-5 students, the incoming protection level is 15% under scenario I and 6% under scenario II.
Model Equations and Basic Reproduction Number

We partitioned Eqs. (2) to (11) and calculated the partial derivatives to obtain 2 matrices named
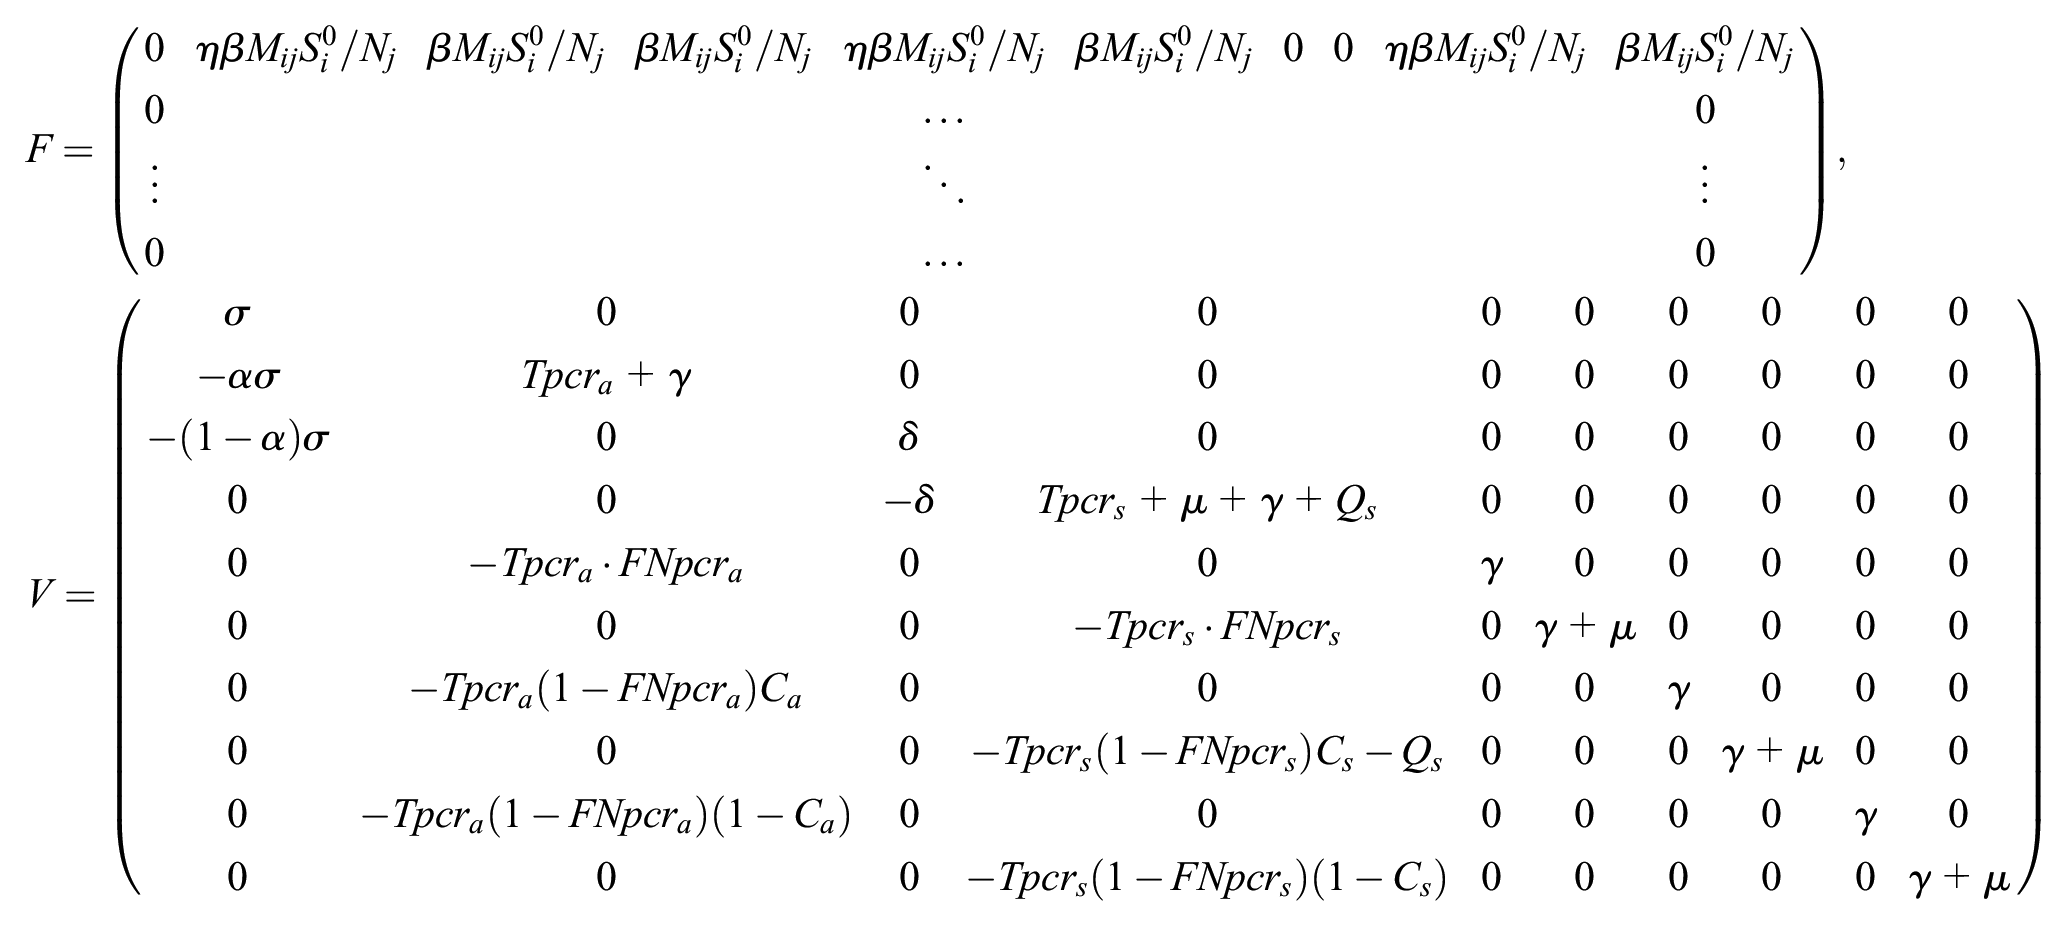
Then, we obtained the closed-form solution of R0 as

The detailed derivation is provided in the supplementary material.
Our model returns a basic reproduction number (
Simulation of Interventions
We assumed that there are no infections within the school at the beginning of the semester. This is a conservative estimate. All students and teachers are either susceptible to COVID-19 or recovered from it, due to previous infections or vaccinations. The disease-free equilibrium (DFE) is

Viruses eventually make their way into the school environment due to infections happening in the community and through out-of-school activities. We expanded the “exposed” population by 1 each week to capture the community impact on schools (i.e., that some children become infected through community connections—in the home, friend groups, community mixing). To account for the variability by which this infection enters the school, we simulated multiple runs by randomly assigning the infection to one of the cohorts. Thus, all results reported are based on average outcomes across replications. We defined masks and random screening as the baseline interventions and defined contact reduction, school closures, and test-to-stay as layered strategies. Below we explain how each baseline intervention and layered strategy is implemented within the model.
Masks
Masks have been shown to be effective in reducing the spread of COVID-19, 25 and many school systems required the use of face coverings as infections increased within the community. 26 When masks were in place within schools, we assumed it was required for all individuals to wear a face covering. While estimates of the effectiveness of masks in reducing infection range from 15% to 75%,25,27–29 in the model, we assumed mask usage reduces infectivity by 50%. This accounts for the fact that the types of face coverings worn could vary widely (e.g., from bandanas to N95), face coverings may not always be worn properly (i.e., covering both nose and mouth), and students are allowed to remove face coverings during lunch and certain activities. During Omicron, many schools tightened masking policies, for example distributing and promoting more effective masks and making it easier for students to eat outside. 30
Random screening
The National Education Association states that screening by testing a random sample of at least 10% of students each week is a critical way to limit the spread of COVID-19 and keep schools operating safely. 31 When random screening was in place in the model, we assumed that all the individuals in school, whatever their disease status, were equally likely to be picked to get tested using PCR tests. The individuals who were symptomatically or asymptomatically infected advanced to 1 of the 3 posttesting states according to the testing results and their behaviors regarding isolation.
Contact reduction
When daily cases surged during the pandemic, schools put many safety measures into effect such as practicing social distancing, splitting up lunch periods/eating locations, changing locker assignments, creating 1-way traffic in hallways, and reducing the number of students in classrooms and in school buses. 32 These measures were all aimed at reducing contacts in school. We incorporated this strategy in the model by multiplying the baseline contact matrix by a factor less than 1. Thus, the new contact matrix was scaled while maintaining the same distribution as before. In other words, if a student on average made 20 contacts with others in school every day before the contact reduction, reducing contacts by 30% means he or she makes 14 contacts with others instead.
School closures
School closures have been used as a mitigation strategy against COVID-19 when cases in schools were high.33,34 In our simulation model, the threshold of shutting down the school was determined by monitoring the number of symptomatic individuals each day. School closure was triggered whenever the number of daily symptomatic infections reached a certain level. We assumed that a school closure had a duration of 10 d (2 wk of school) each time it was triggered. Here, school closure refers to in-person school. Some schools may have stopped instruction, while others transitioned to virtual learning.
Test-to-stay
“Test-to-stay” is a practice recommended by the CDC; it is considered as a layered prevention strategy in addition to promoting child vaccination and social distancing. 35 Under this strategy, the disease was closely monitored daily. If 1 student showed symptoms, rapid tests were performed for all students in that class. Students who received a positive test result would stay home for isolation until fully recovered. We assumed rapid tests are used when test-to-stay is implemented because despite having a high false-negative rate, rapid tests have a low false-positive rate. 36 We also restricted rapid tests such that they cannot be given to the same class on 2 consecutive days.
Lastly, most schools have guidance in place regarding self-quarantine based on symptoms, but this may not be fully enforced. When students or teachers start to show symptoms, such as coughing or sneezing, some will decide to stay home to rest until recovery and some will not (this may be due to the belief that symptoms are due to another illness or because parents cannot afford to take time off work 37 ). Thus, we considered an additional parameter called “self-quarantine rate.” This represents the proportion of people with symptomatic infections who choose to quarantine at home after they start to show symptoms. Four levels of self-quarantine rate are considered in the study.
The model we built generalizes across K-12. In this article, we focused on the K-5 model results for all interventions under scenario I (defined in Table 1) in the “Results” section. We also provide results for high school (9–12) for the contact reduction strategy. Analyses of K-5 under scenario II, as well as a complete list of parameters, are presented in supplementary material.
Results
We used a package called “deSolve” 38 to solve the multigrouped differential equations in R to examine the impact of COVID-19 in schools under various interventions and strategies. Results for scenario I for K-5 schools are discussed in detail in this section, where the Omicron variant is assumed to have higher transmissibility and lower immune escape. We also discuss results for high school under the contact reduction strategy.
Contact Reduction
First, we considered the impact of contact reduction. The proportion of susceptible individuals infected with COVID-19 under different levels of contact reduction and different levels of self-quarantine is shown in Figure 3. We projected the baseline interventions of masks and random screening in each of the subgraphs. The columns represent the different levels of reduction in contacts, and the rows represent different levels of self-quarantine. Without weekly random screening, masks, or any reduction in social contacts, more than 90% of the susceptible population in the school becomes infected within 3 mo. Under the lowest level of self-quarantine, with a 50% reduction in contact, we can achieve a 31 percentage point reduction in the proportion of susceptible individuals infected without masks and an 83 percentage point reduction with masks. The contact reduction levels examined have a bigger impact on infection reduction than the levels of self-quarantine examined. For instance, without any baseline interventions, 30% reduction in contacts results in a reduction of 9.8 percentage points in proportion of susceptible individuals infected with COVID-19, whereas increasing self-quarantine level from 25% to 80% reduces the proportion of susceptible individuals infected by 5.3 percentage points.
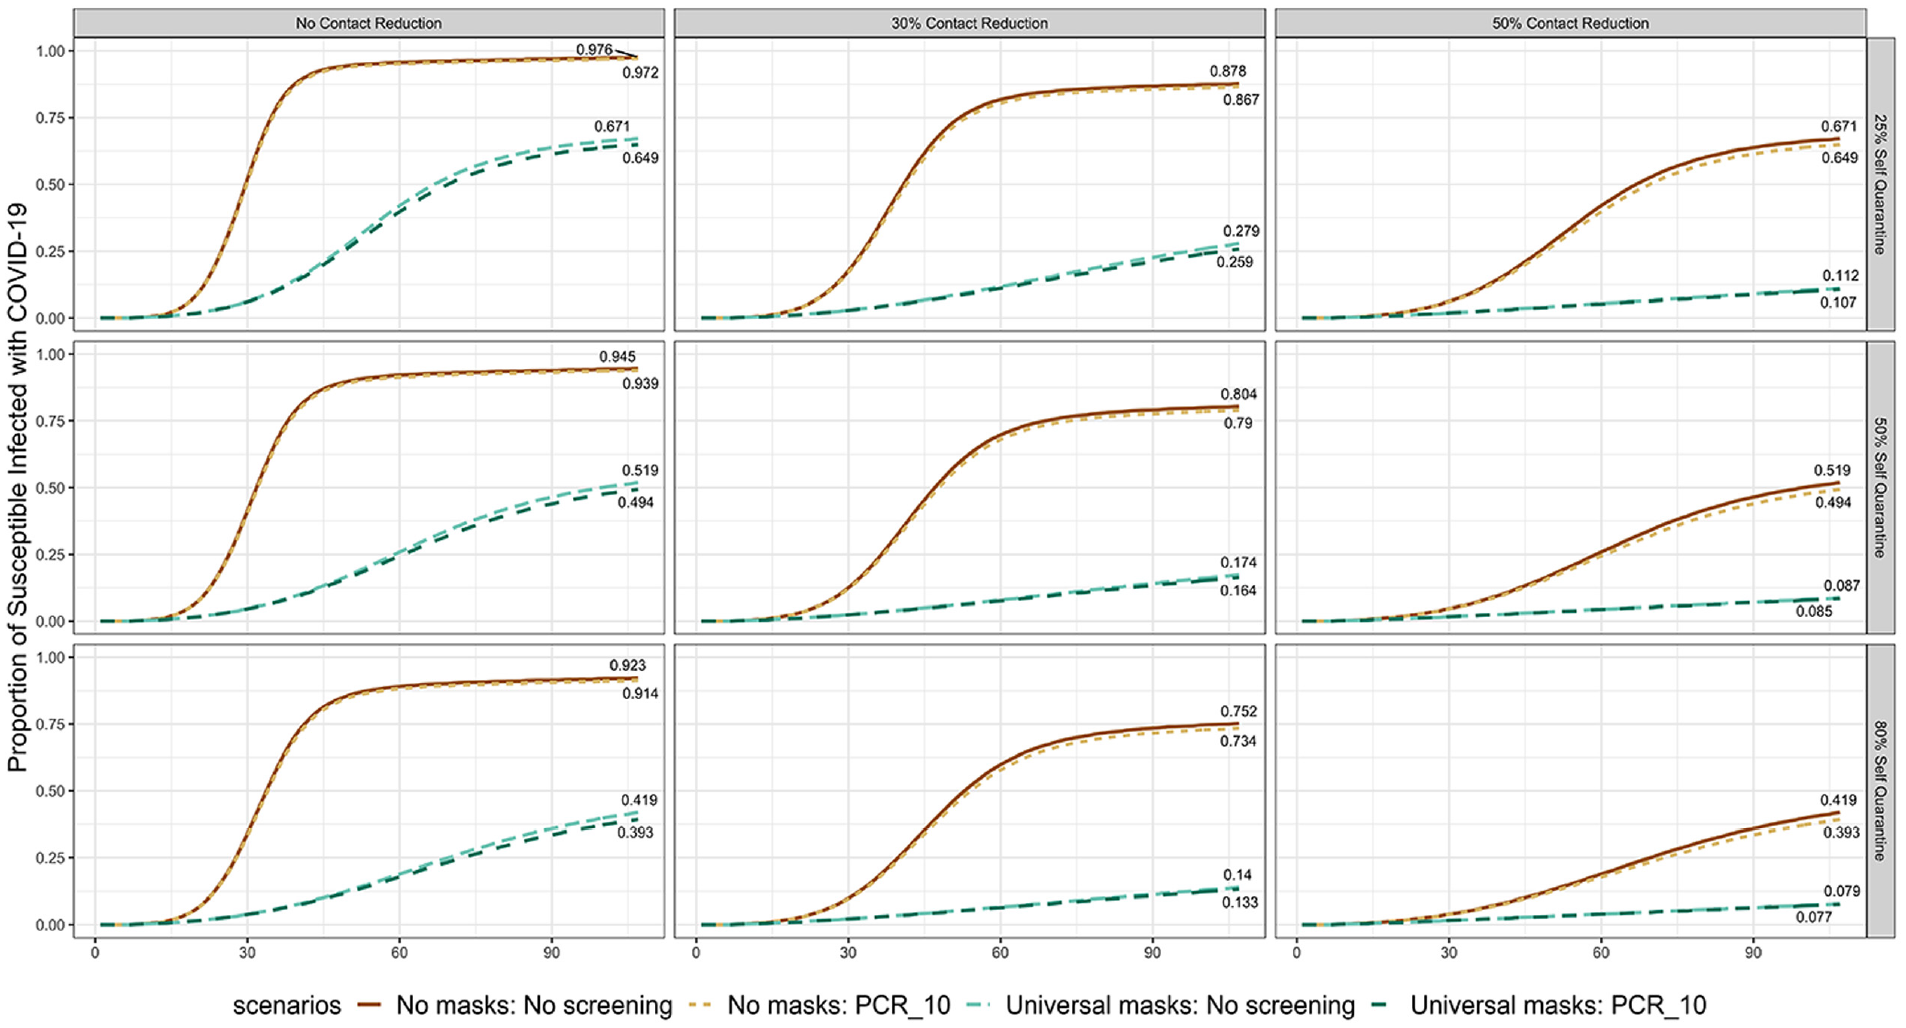
Proportion of susceptible individuals infected with COVID-19 under different levels of contact reduction and self-quarantine. The results are calculated by taking the average of 10 replications.
Also, under 30% contact reduction, “Universal masks: No screening” reduces the end-of-semester infection by 68% compared with “No masks: No screening” with a self-quarantine level of 25% and by 78% with a self-quarantine level of 50%. These results are consistent with the analysis of Boutzoukas et al., 29 who found that schools that implemented a universal masking policy (some of these schools also changed the lunch policy to reduce social contacts during lunch time) reduced secondary transmission by 72% compared with those implementing an optional masking policy.
Next, we fixed the assumption of 10% random screening and took a closer look at the end-of-semester infections and days of school missed for the entire school population under the varied levels of contact reduction and self-quarantine. Days of school missed represents the number of days students are not physically in school due to quarantine or isolation. We also compared the impact of social mixing patterns by assuming the K-5 students and teachers make contacts under the 3 different mixing patterns considered: well-mixed, cohort, and isolated. More segregated contact patterns result in fewer infections and fewer days of school-missed (shown in Figure 4). Under a well-mixed contact pattern, when the self-quarantine level rises from 25% to 50%, days of school missed declines from 853.4 to 753.2 d under a 50% contact reduction assumption, and end-of-semester infections reduce from 274.9 to 211.7 infections. If the level of self-quarantine rises to 80%, both days of school missed and end-of-semester infections decrease even more. However, under 0% contact reduction, when the self-quarantine level increases, we see end-of-semester infections decrease while days of school missed increase. This reveals a tradeoff associated with layered strategies; when the disease transmits very quickly, it is possible that self-quarantining can help reduce infection at the cost of higher overall absenteeism.
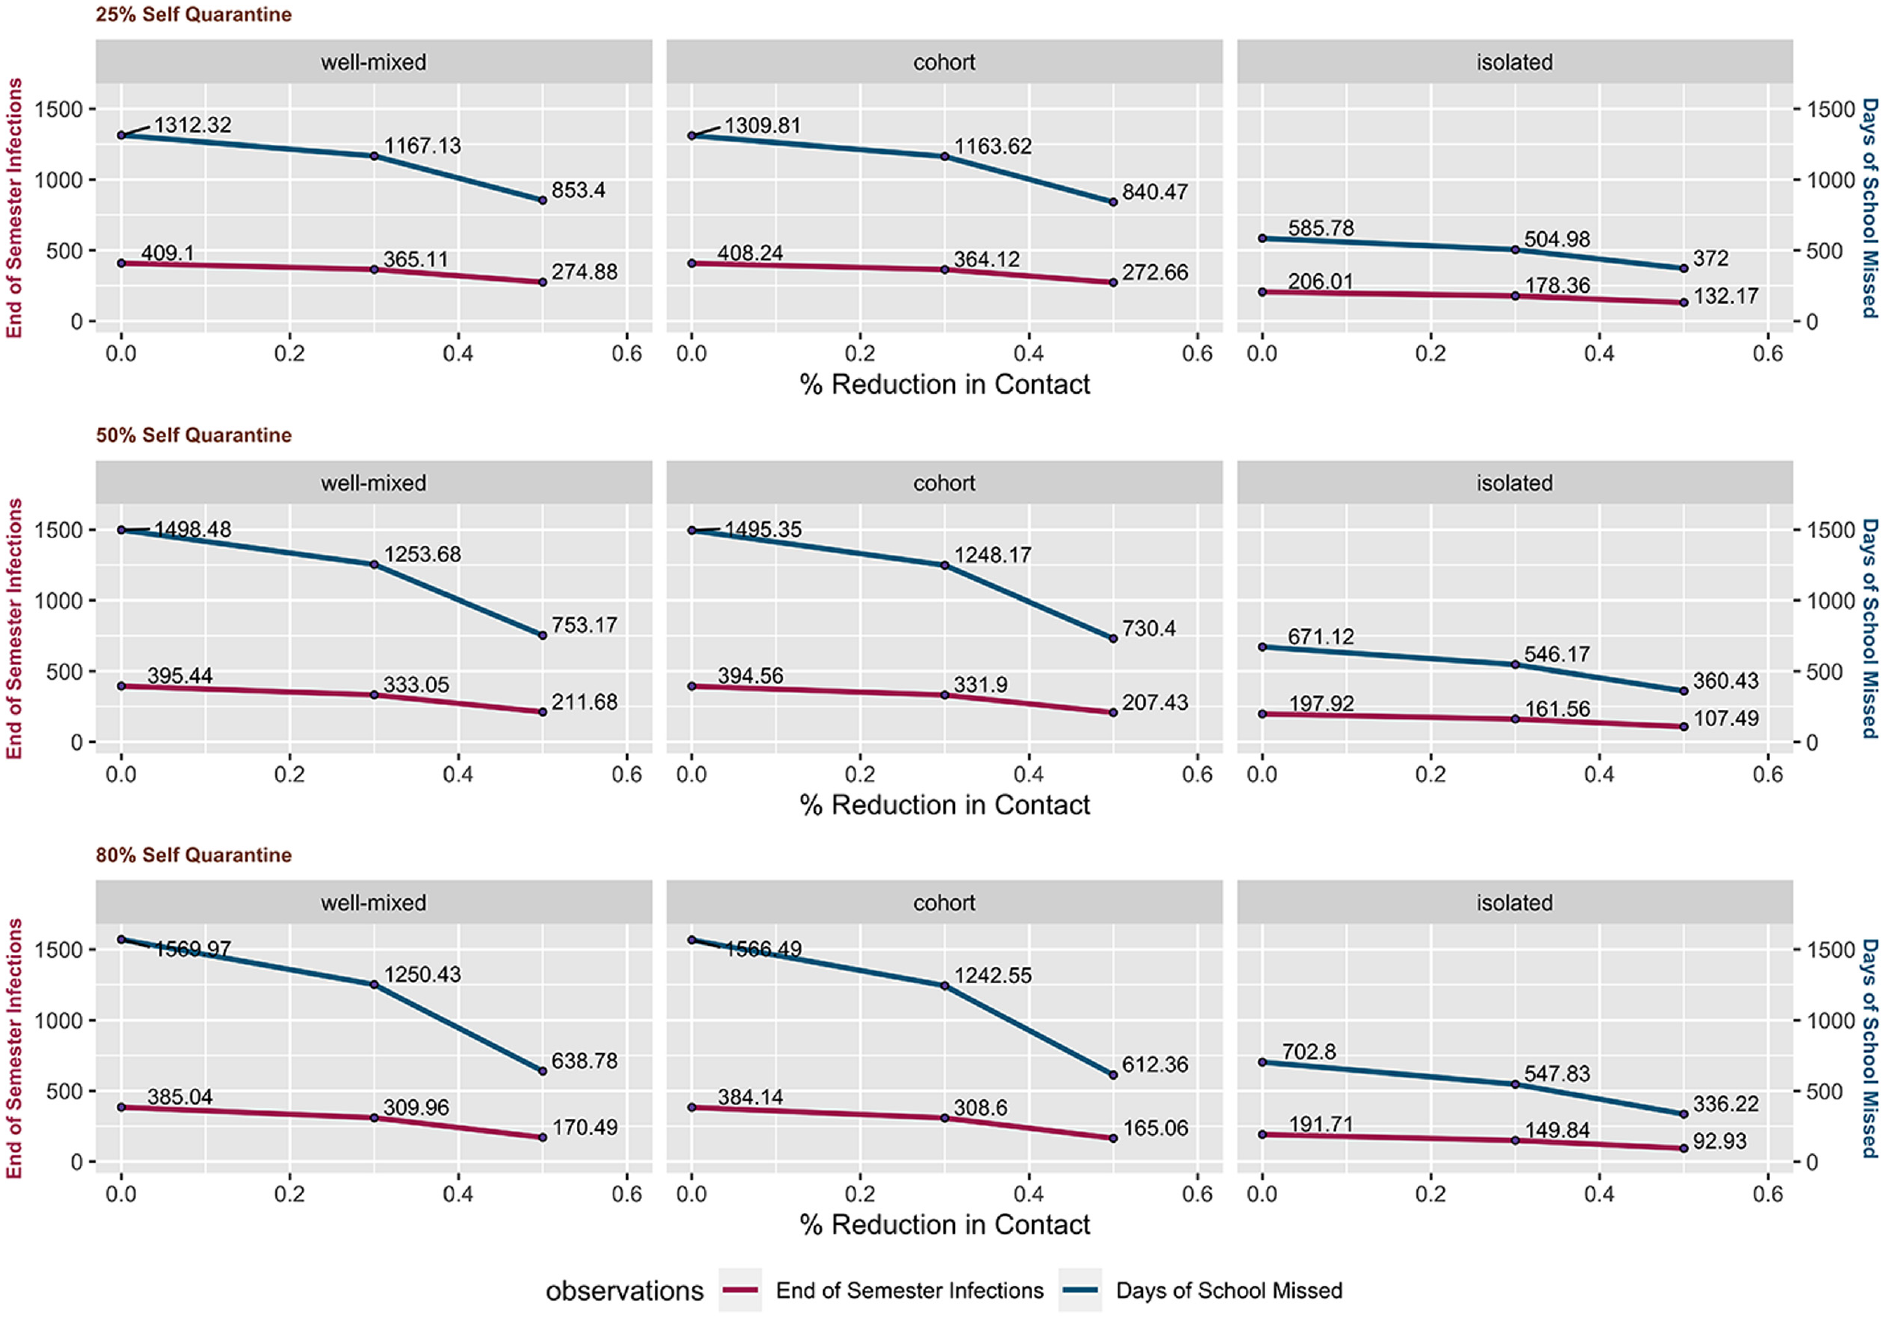
Three-dimensional comparison of self-quarantine, level of contact reduction, and different mixing patterns in school on the outcomes of end-of-semester infections and days of school missed under the assumption of no masks and 10% polymerase chain reaction tests. The results are generated by taking the average of 10 replications.
Reducing social mixing in school is an effective measure to reduce absence from school and reduce total infections throughout the semester. The reduction is small when comparing cohort mixing with well-mixed, as all the teachers are fully mixed in one group and they make contact with all student groups. When
School Closures
We investigated the number of infections using a school closure strategy. Our results assumed that whenever the number of daily symptomatic infections reaches 15, the school is shut down. We chose 15 infections as it represents 3% of the population being infected in 1 d, which we believe is reasonable to signal an outbreak in the school that could trigger a shutdown. We compared the number of days school closed, with or without other mitigation measures. The results are shown in Figure 5.

Proportion of susceptible individuals infected with COVID-19 and daily symptomatic infections in school under the school closures strategy. The number of days school closed is calculated by taking the average of 100 repeated experiments, while graphs of the proportion of susceptible infected with COVID-19 and daily symptomatic infection represent 1 simulation result.
The total number of days school closed declines as the level of self-quarantine increases. Overall, with baseline intervention of masks in place, the school is more likely to operate safely. There is no outbreak in school triggering a shutdown when masks are in place and the self-quarantine level is at least 80%. On the other hand, without baseline interventions of masks or random screening, outbreaks will trigger shutdowns, which result in the school being closed for more than one-third of the semester.
Test-to-Stay
Results of simulating the test-to-stay strategy are shown in Figure 6. Without random screening or masks, the test-to-stay strategy reduced the proportion infected individuals by approximately 19 percentage points; yet more than 5000 rapid tests were given during the semester under all 3 self-quarantine levels. Masks layered with test-to-stay not only significantly reduces the cumulative infections but also reduces the number of rapid tests needed in school. We found that by implementing the baseline intervention of masks with the test-to-stay strategy, the number of rapid tests needed was reduced by more than 4000.
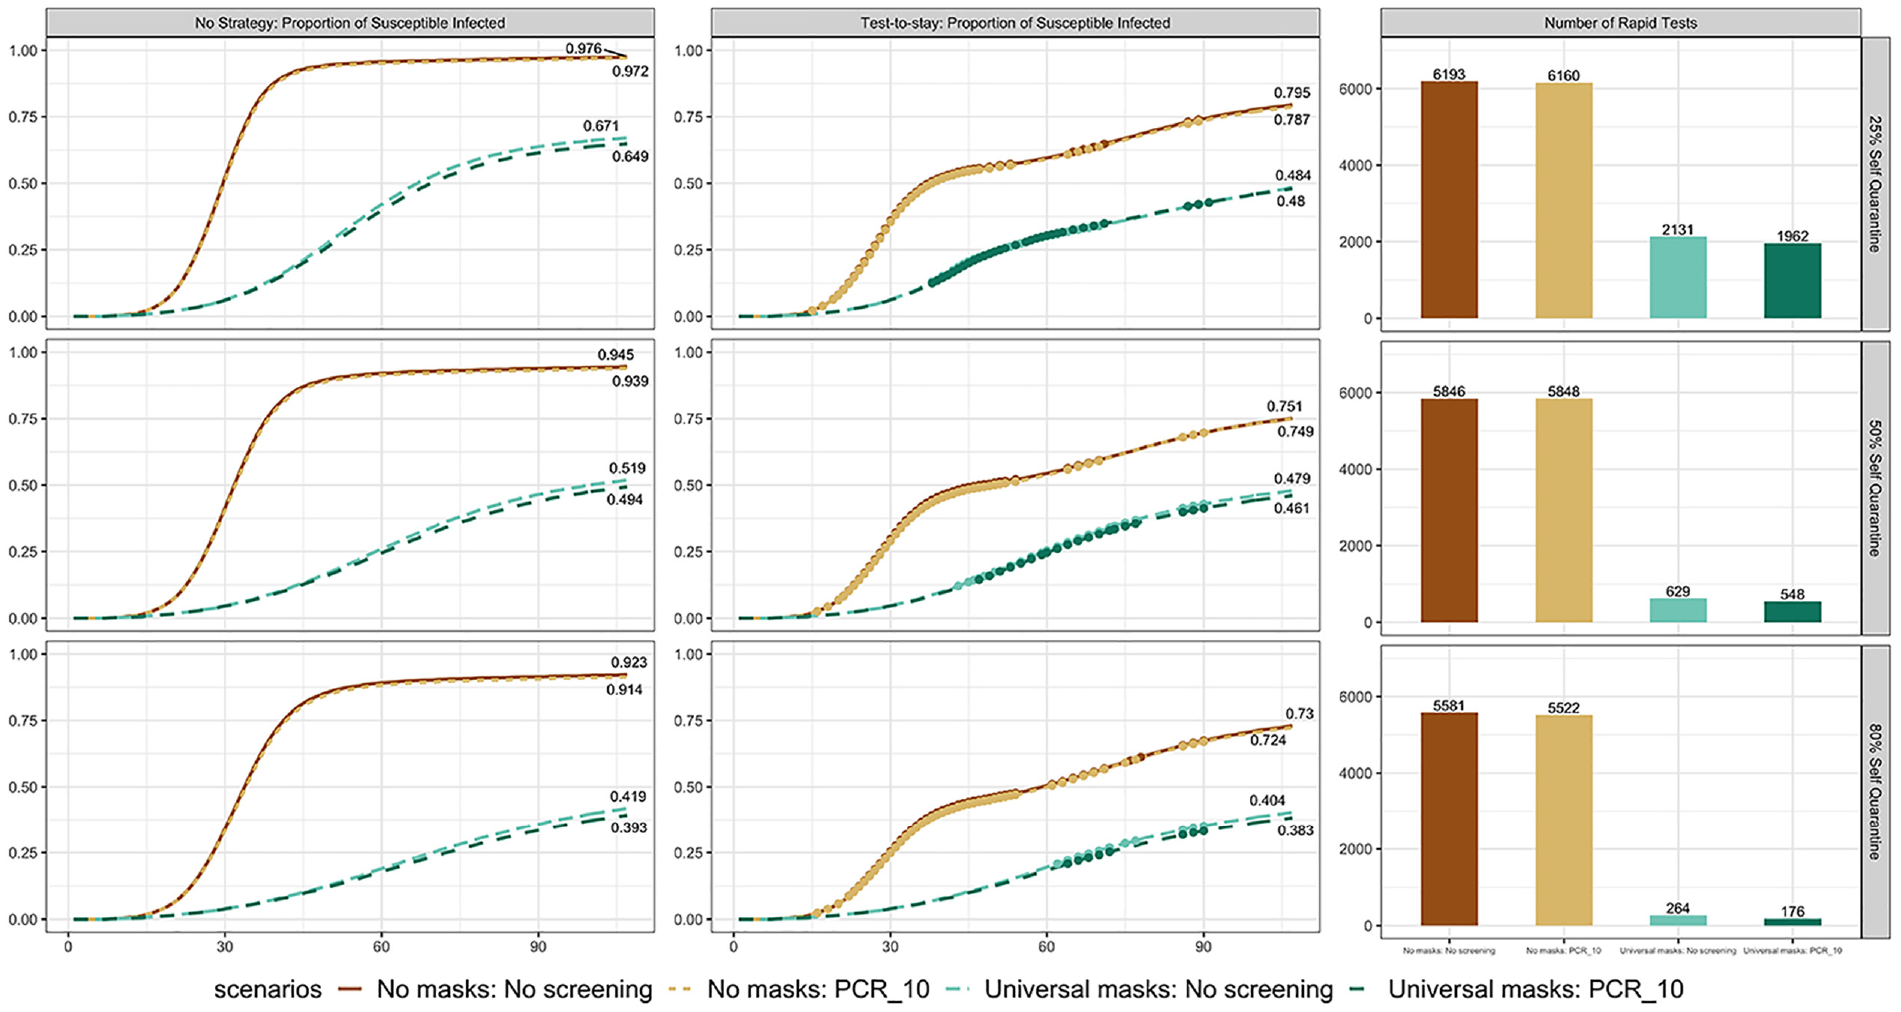
Proportion of susceptible infected under no strategy and test-to-stay strategy. Each dot represents a day when at least 1 group of students or teachers receive rapid tests. Subgraphs of baseline cumulative infection and contact tracing cumulative infection are generated from a single simulation. The number of rapid tests is calculated by averaging more than 100 replications.
When comparing across different strategies, we see from Figure 6 that without random screening or masks, it took about 6100 rapid tests for the end-of-semester proportion of susceptible infected to decrease by 18 percentage points. The same level of reduction in infection can be achieved without rapid tests by reducing contacts by between 30% and 50%.
Contact Reduction in High Schools
We also tested the impact of the contact reduction strategy in a high school environment, where we split students and teachers into smaller groups but assumed their contact patterns were well-mixed. In this case, the number of student groups was doubled, as we assumed a high school population of 1000. In addition, the incoming protection of high school students is higher (25% compared with 15% for K-5 under scenario I). Figure 7 shows the proportion of susceptible infected individuals over time under different levels of self-quarantine and contact reduction. Under the same levels of contact reduction and self-quarantine as K-5 (Figure 3), by the end of the semester, there was a lower proportion of susceptible infected individuals in high school than in K-5. For example, under no contact reduction, 25% self-quarantine, and the baseline intervention of masks, K-5 has 67.1% of susceptible individuals infected by the end of the semester, whereas high school had 51.9%. This difference is increased at higher contact reduction and self-quarantine levels, and as more baseline interventions are layered on. These results suggest that even with a more mixed contact pattern, the number of infections within a school can be lowered if the incoming protection level is higher. This highlights the importance of increasing vaccine uptake. We also note that the benefit of contact reduction is greater in the high school well-mixed environment than in the K-5 setting. For example, the proportion of susceptible infected individuals by the end of the semester in high school without baseline interventions and 25% self-quarantine decreases from 94.3% to 52.0% as contact reduction goes from 0% to 50%, while in K-5 (Figure 3), the decrease is from 97.6% to 67.1%.
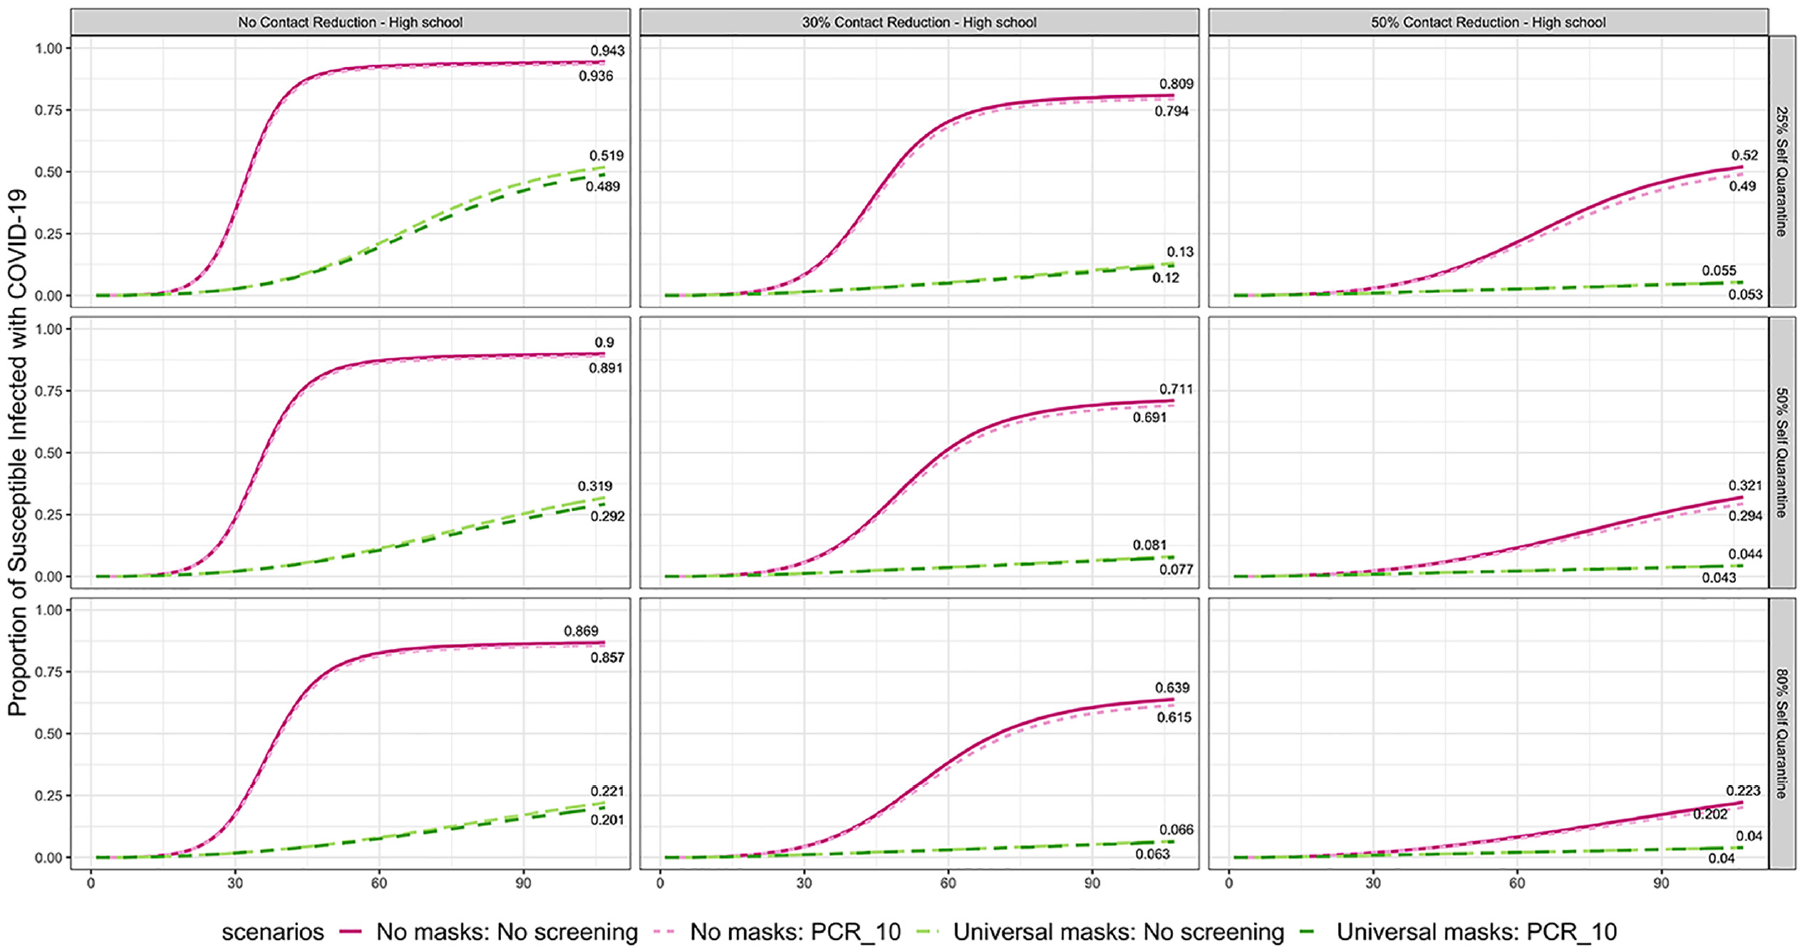
Proportion of susceptible individuals infected with COVID-19 under different levels of contact reduction and self-quarantine for high school.
Sensitivity Analysis: Uncertainty of Mask Efficacy and Susceptibility
We assumed the efficacy of masks in reducing infections was 50% throughout the simulations of different interventions. Note that we define efficacy as a combination of adherence and the ability of masks to effectively reduce virus transmission. Due to the uncertainty of mask efficacy, we conducted a sensitivity analysis by considering only the intervention of masks and changing the efficacy levels under the assumptions of scenario I and a 25% level of self-quarantine. The possible efficacy levels we considered range from 0% to 75%.
In addition, the true level of susceptibility of students in school can be difficult to estimate due to waning immunity after prior infection or vaccination. Thus, in addition to the 15% (30% incoming protection with 50% immune escape under scenario I) incoming protection level we implemented in the primary analysis, we also replicated the sensitivity analysis by considering additional incoming protection levels of 20% and 25% for K-5 students.
Figure 8 shows the results of varying mask efficacy levels (lines within the graphs) under different levels of incoming protection (shown in the different panels). By comparing the simulated results under different levels of mask efficacy and incoming protection, we see that higher levels of mask efficacy and incoming protection result in a lower proportion of susceptible individuals infected by the end of the semester. Furthermore, higher levels of mask efficacy are even more effective at reducing the infections with higher levels of incoming protection.

Proportion of susceptible individuals infected with COVID-19 under 6 different levels of mask efficacy and 3 K-5 incoming protection levels (15%, 20% and 25%).
Discussion
Many studies have used compartmental models to project COVID-19 transmission. However, few focused on K-12 schools and demonstrated the impact of implementing mitigation measures. To our knowledge, this is the first study to model and quantitatively assess the impact of layered interventions that were adopted across K-12 schools in the United States.
Our model is built to simulate COVID-19 transmission within K-12 schools at the beginning of the Omicron variant wave (or for a similar future scenario). Without any interventions in school, we project that most K-12 students will be infected by the end of the semester. We analyzed many of the widely used interventions and strategies: masks, random screening, contact reduction, school closures, and test-to-stay. We found that all are effective at reducing infections in school but at different levels. Combinations of the baseline interventions and strategies are even more effective. For example, if we were to implement masks, random screening, 50% contact reduction, and 80% self-quarantine together, only 7.7% of susceptible individuals would be infected by the end of the semester. Furthermore, increased levels of incoming protection, which can be achieved through increased vaccine uptake, further increase the benefit of NPIs with respect to relative reduction in infections. The choice of NPI or a combination of NPIs chosen can be based on priorities, feasibility, and cost.
Outbreaks in school not only raise concerns about increasing school absences but also exacerbate infections in communities as students are in contact with their parents and grandparents when schools are not in session. Results show that, while waiting for the childhood vaccination rate to increase, layered NPIs can reduce as many as 92% of school infections, which can also be beneficial to the students’ households and communities. 39
There is heated discussion over school closures among the public. 40 Our results show that school closures do have a positive impact on reducing the total number of infections in school, yet they can have other effects. For example, we observe in our model that in-school infections surge immediately every time schools reopen. School closures can be problematic as they can potentially increase the disease burden in the community if social mixing among students still occurs in a less monitored environment when schools are shut down. 41 Equity is another big concern when schools are not able to operate safely. Here we do not distinguish between closures that result in paused instruction versus a transition to virtual learning. Learning loss may occur without online learning or for families who are not able to accommodate online learning. Thus, our analysis of school closures can help inform guidance for keeping schools operating safely.
COVID-19 transmission is highly dependent on social mixing among the population. One of the strengths of the study is that the model can capture the impact of different contact patterns. Our model splits the target population into smaller cohort groups and considers the effects of the interactions among different subgroups and the different disease behaviors within each subgroup. Second, testing results and people’s behavior are not assumed to be perfect. The model makes concessions for receiving false-negative testing results as well as accounting for some refusal to isolate or quarantine when an individual is positively infected.
The model can be generalized in several ways. For example, future variants of SARS-CoV-2 could develop additional abilities to escape previous immunity, in which case the model and results could apply quite directly. Second, the model could apply to other respiratory diseases, especially those for which screening or testing can affect transmission. Also, by setting the testing rate to zero, the model is simplified to a concise model that still demonstrates the general flow of disease progression.
We recognize some limitations in our model. Even though we split the population into smaller groups, it is still assumed to be well-mixed within each group; this is a general limitation for all SIR models. Nonetheless, the simulation results are sufficient to evaluate the policies implemented in schools. Second, we do not consider false positives or the potential absences associated with them. Third, while we account for some of the countereffects of layered strategies, future work can be done around comparing and analyzing the cost-effectiveness of each of these strategies as well as simulation optimization to find the best combination of NPIs.
Conclusion
The model assesses different nonpharmaceutical interventions applied to K-12 schools during the pandemic and estimates their impact on COVID-19 under varying assumptions. The results are presented using parameter estimates associated with the Omicron variant, but the model is general and can be applied to different parameters. In addition, although we specify our targeted population group as K-12 schools, the conceptual model can be easily extended to implement other population groups (e.g., nursing homes or prisons) if we have a good quantitative understanding of their social contact patterns.
Supplemental Material
sj-docx-1-mpp-10.1177_23814683221140866 – Supplemental material for Modeling the Impact of Nonpharmaceutical Interventions on COVID-19 Transmission in K-12 Schools
Supplemental material, sj-docx-1-mpp-10.1177_23814683221140866 for Modeling the Impact of Nonpharmaceutical Interventions on COVID-19 Transmission in K-12 Schools by Yiwei Zhang, Maria E Mayorga, Julie Ivy, Kristen Hassmiller Lich and Julie L. Swann in MDM Policy & Practice
Footnotes
Acknowledgements
The model we developed is based on the idea of single-grouped posttesting states embedded SIR model built by Zhuoting Yu, Akane B. Fujimoto; we thank them for sharing this with us.
The authors declared no potential conflicts of interest with respect to the research, authorship, and/or publication of this article.
The authors disclosed receipt of the following financial support for the research, authorship, and/or publication of this article: This research was supported by grant UL1TR002489 from the National Center for Advancing Translational Sciences/National Institutes of Health and Cooperative Agreement NU38OT000297 from the Council of State and Territorial Epidemiologists and the Centers for Disease Control and Prevention. The research also received partial support from North Carolina State University.
References
Supplementary Material
Please find the following supplemental material available below.
For Open Access articles published under a Creative Commons License, all supplemental material carries the same license as the article it is associated with.
For non-Open Access articles published, all supplemental material carries a non-exclusive license, and permission requests for re-use of supplemental material or any part of supplemental material shall be sent directly to the copyright owner as specified in the copyright notice associated with the article.