
Abstract
Highlights
Spillover effects from problem drinking in the family vary by relationship type.
One’s perception of their spouse or child as having a drinking problem is associated with a utility decrement of equal magnitude to having alcohol use disorder oneself.
Medical decision makers should consider the outsize effects of family spillovers in treatment decisions in the context of alcohol consumption, particularly among spouses and children of problem drinkers.
Economic evaluation should consider how to incorporate family spillover effects from problem drinking in alcohol-related models.
Keywords
Excessive alcohol consumption causes a range of health problems for the individual drinker and imposes adverse health and economic effects on family, friends, and the general community.1–6 A growing body of literature has explored alcohol’s harms to others, documenting substantial impacts across a range of dimensions 7 and, similarly, how treatment confers benefits that accrue to others. 8 Only a handful of studies, however, have explored the impact of others’ alcohol use on health utility. 9
Health utility is a key patient-reported outcome for regulatory decision making 10 and is used to estimate quality-adjusted life-years, which are integral to economic evaluation (such as cost utility and cost effectiveness analysis (CEA). 11 These methods are used to estimate the value of, and to choose between, similarly oriented policies and interventions. Health utility can be measured for an individual with a particular health condition and also for those individuals surrounding the patient, usually family members and/or caregivers. Such surrounding individuals’ health utility is generally termed spillover utility, or disutility when it represents a loss in utility by virtue of being in proximity to a patient. In the absence of measures of family spillover disutility, economic evaluation of alcohol-related interventions could be imprecise and may result in suboptimal decision making. For this reason, the inclusion of family outcomes in economic evaluation has been recommended by the Second US Panel on Cost-Effectiveness in Health and Medicine. 12 Our objective in this study was to estimate the national mean disutility associated with family drinking and to explore whether and how family member relationships modify these estimates.
Methods
Design
We conducted a secondary analysis of a US nationally representative cross-sectional data set; the analysis plan was not previously registered. Reporting followed STROBE guidance for cross-sectional studies. 13 Ethics approval for the study was obtained from the University of North Carolina Greensboro (UNCG) Institutional Review Board; the data were subject to a limited-access data agreement between UNCG and the National Institute on Alcohol Abuse and Alcoholism.
Data
We used data from the National Epidemiologic Survey of Alcohol and Related Conditions Wave 3, a face-to-face interview survey of noninstitutionalized US residents aged 18 y and older. 14 US National Epidemiologic Survey of Alcohol and Related Conditions Wave 3 (NESARC-III) data were collected from April 2012 to June 2013 through a multistage probability sample with oversampling of ethnic subgroups and were adjusted for nonresponse and weighted such that aggregates match the size and demographic proportions of 2010 US Census blocks. Included among survey measures were an interviewer-administered health status instrument, an assessment of drinking behavior, a diagnostic assessment for alcohol use disorder (AUD), and questions about respondents’ perception of family history of problem drinking. The total unweighted sample size was 29,159; the response rate was 60.1%. 14
Measures
NESARC-III measured respondents’ health status via the Short-Form 12 version 2 (SF-12v2), 15 from which we derived the SF-6D—a measure of health utility—using a published algorithm. 16 The SF-6D quantifies community-perspective health on a utility scale of 0 to 1, where 0 is defined as the utility of being dead and 1 as living in ideal health. We used a UK valuation set in our SF-6D weights, based on standard gamble elicitations, as US weights are not yet widely available. 16
To adjust for the potential confounding effects of respondent drinking, we measured both respondent drinking behavior using World Health Organization (WHO)–defined alcohol consumption risk levels 17 and respondent-diagnosed problem drinking as AUD. Respondents were classified into 1 of 4 WHO risk levels using grams of ethanol consumed per day, which, following WHO methodology, were calculated from responses to NESARC-III questions designed to assess the respondent’s typical and maximum drinking frequency and quantity over a 12-mo reference period. The WHO categories of daily drinking are composed of no risk (≤1 g), low (>1, ≤20 g female, >1, ≤40 g male), medium-risk (>20 g, ≤40 g female and >40 g, ≤60 g male), high-risk (>40 g, ≤60 g female and >60g, ≤100 g male), and very-high-risk consumption (>60 g female, >100 g male).
We used AUD measures provided by NESARC-III, which were determined via the Alcohol Use Disorder and Associated Disabilities Interview Schedule-5 (AUDADIS-5). 18 An individual can be in 1 of 3 AUD categories: have AUD currently, have had AUD in the past, or have never had AUD. For our analysis, we classified respondents into 2 mutually exclusive groups: those who have had or currently have AUD (“lifetime AUD”) and those who have never had AUD. This grouping was data motivated, as we found little difference in effect size between the grouped “lifetime AUD” and the separate “current AUD” or “former AUD” (results not shown), as has been demonstrated elsewhere. 19 AUD is a chronic, recurring illness, and as such, the delineation between “current” and “former” can be nebulous and person specific and may explain this null effect.
To capture our variables of interest—family member problem drinking—we used responses to NESARC-III interview items that asked about “alcoholism or a drinking problem” among a spouse/partner, parent, aunt/uncle, grandparent, sibling, or son/daughter, respectively, at any time in the family member’s life, present or past. We categorized family members into 4 groups based on sample size and logical relevance: “parent(s),” composed of blood or adoptive, single or multiple parents; “child(ren),” comprised of biological sons or daughters (NESARC-III did not ask about adopted children); “spouse(s)/partner(s),” composed of current or former spouses or partners; and “other family,” composed of sibling(s), aunt(s), uncle(s), or grandparent(s).
Respondents may have reported multiple family members both across and within these groups, resulting in inclusion in more than 1 family member category. For example, a respondent who reported perceiving both their spouse and their child as having a drinking problem would be counted in the “spouse(s)/partner(s)” group, the “child(ren)” group, and the “spouse(s)/partner(s) & child(ren)” group; a respondent for whom both parents were perceived to be problem drinkers would be counted in the “parent(s)” group. Additional description of all drinking-related measures can be found in Table 1. A breakdown of the constituent parts of each group is provided in the online supplementary material (Appendix a).
Description of Drinking Measures

AUD, alcohol use disorder; AUDADIS-5, Alcohol Use Disorder and Associated Disabilities Interview Schedule-5; NESARC-III, US National Epidemiologic Survey of Alcohol and Related Conditions Wave 3; WHO, World Health Organization.
To account for sociodemographic characteristics that might confound the association of interest, we created variables of employment (“employed” = presently working full-time at 40+ hours a week or part-time at 20+ hours a week), marital/partnership status (“married/partnered” = currently married or living with as if married), and education, grouped as “high school or less,”“some college,” and “post–high school degree,” defined as completed associate, technical, bachelor’s, or higher degree. We also used NESARC-III categories to describe race and ethnicity: Black non-Hispanic, White non-Hispanic, American Indian/Alaska Native non-Hispanic, Asian/Native Hawaiian/Other Pacific Islander non-Hispanic, and Hispanic any race to adjust for race-based experiential differences such as systemic racism, for which data suggest affects health utilities, 20 and might influence perceptions of “problem drinking” or responses to the SF-12. We grouped respondent age into bins of 18–20, 21–45, 46–65, and 66+ y as the consequences from drinking differ for those under 21 y (illicit) and those older than 65 y relative to the remaining adult population, 21 which was divided evenly into 2 bins. Age is also a known predictor of utility, with utility decreasing as age increases. 21 Despite the somewhat arbitrary nature of binning allocations for adjustment variables, we elected not to use indicated age directly to preserve interpretability. It should be noted that models with age as indicated were estimated and produced results indistinct from models with age in bins (results not shown). All sociodemographic variables were included as covariates to better isolate the association between family relationships and utility after adjustment for other known associations, to the extent that such were available in the analytic data set.
Analysis
We described the sample in 3 groups: the total sample, those who reported the presence of problem drinker(s) in the family, and those who did not report any problematic drinking in the family. We excluded any respondent who did not have valid data for at least 1 of the family drinker questions. Two summary statistics were used to describe the sample: the unweighted frequency, which characterizes the NESARC-III data, as well as the population-weighted proportion, which facilitates the use of our estimates in CEA. Within each group, we described the respondents’ lifetime AUD status, WHO alcohol consumption risk level, and sociodemographic characteristics. We also split out and described the key subcategories of those who perceived at least 1 family member to have a drinking problem, namely, problem drinking reported in a spouse/partner, a parent, a child, or some other relative. Summary statistics were also reported across groups, that is, those who reported at least 1 of each: spouse/partner and child, spouse/partner and parent, spouse/partner and other relative, and all other 2- and 3-way combinations with the most specific being those respondents who reported at least 1 problem drinker in each group: spouse/partner, parent, child, and other relative.
We used weighted least squares to estimate the association between the perception of a family member having a drinking problem and SF-6D score, adjusted for whether the respondent ever had AUD (measured by lifetime AUD), respondent current drinking behavior (measured by WHO alcohol consumption risk level), and sociodemographic characteristics known to be associated with health utility scores. We included the individual family relationship categories in our models as well as all possible across-group combinations (2-, 3-, and 4-way). Weighted least squares is a generalization of ordinary least squares, which is regarded as the best method for estimating health utility, as health utility is continuous and bounded by 0 and 1. 22 Our measure of health utility—the SF-6D—ranges from 0.291 to 1 and is known to be more sensitive to mild conditions than some other utility measures, which was beneficial in this context.23–26 We used Stata 16.1 for all analyses (StataCorp, LLC, College Station, TX); weighting was executed via Stata’s “svy” suite of commands.
Results
After removing all respondents who did not answer at least 1 family drinking question (4131), the analytic sample totaled 29,159. Table 2 presents unweighted sample sizes and population-weighted proportions for the total sample, the subset of individuals reporting at least 1 problem drinker in the family, and the subset reporting no problem drinkers in the family. About three-quarters of the sample (21,801) reported perceiving a family member or members of having a drinking problem at any point in their life. Most respondents were considered no- or low-risk drinkers by the WHO guidelines, and those with current or prior AUD represented just more than one-quarter of the sample (8406).
Characteristics of the Sample: Unweighted Frequencies and Population-Weighted Proportions

Proportions are rounded to the nearest integer.
Respondent reported perception of any family member with alcoholism or “problem drinking” at any point in the family member’s lifetime.
Lifetime abstainers and former drinkers.
High- and very-high-risk levels were combined due to the small sample size.
Completed associate, technical, bachelor, or higher degree.
Married or living as if married.
Presently works full- or part-time, 40+/20+ hours a week, respectively.
Among the population of individuals who perceive at least 1 problem drinker in their family, 44% of individuals perceived a parent or parents as having alcoholism or problematic drinking at some point in their lives (Table 3). Half as many (22%) perceived a spouse or partner with alcoholism/problematic drinking, and 11% perceived their child or children as having a drinking problem. Ninety-three percent of this population perceived a sibling, aunt/uncle, or grandparent (or multiples of these) of having a drinking problem (“other family”). Multiple family members were commonly perceived as having problematic drinking, with 40% of this population reporting both a parent and at least 1 member belonging to the “other family” group. It should be noted that counts are not mutually exclusive. For example, an individual reporting 1 parent and 2 family members in the “other” category will be counted a total of 3 times, once in each “within” group (“parent(s),”“other family”) and once in the relevant “across” group (“parent(s) & other family”).
Relationship of Perceived Problem Drinker(s) to Respondent, Among Those Who Reported Problem Drinker(s) in Family: Frequencies and Population-Weighted Proportions
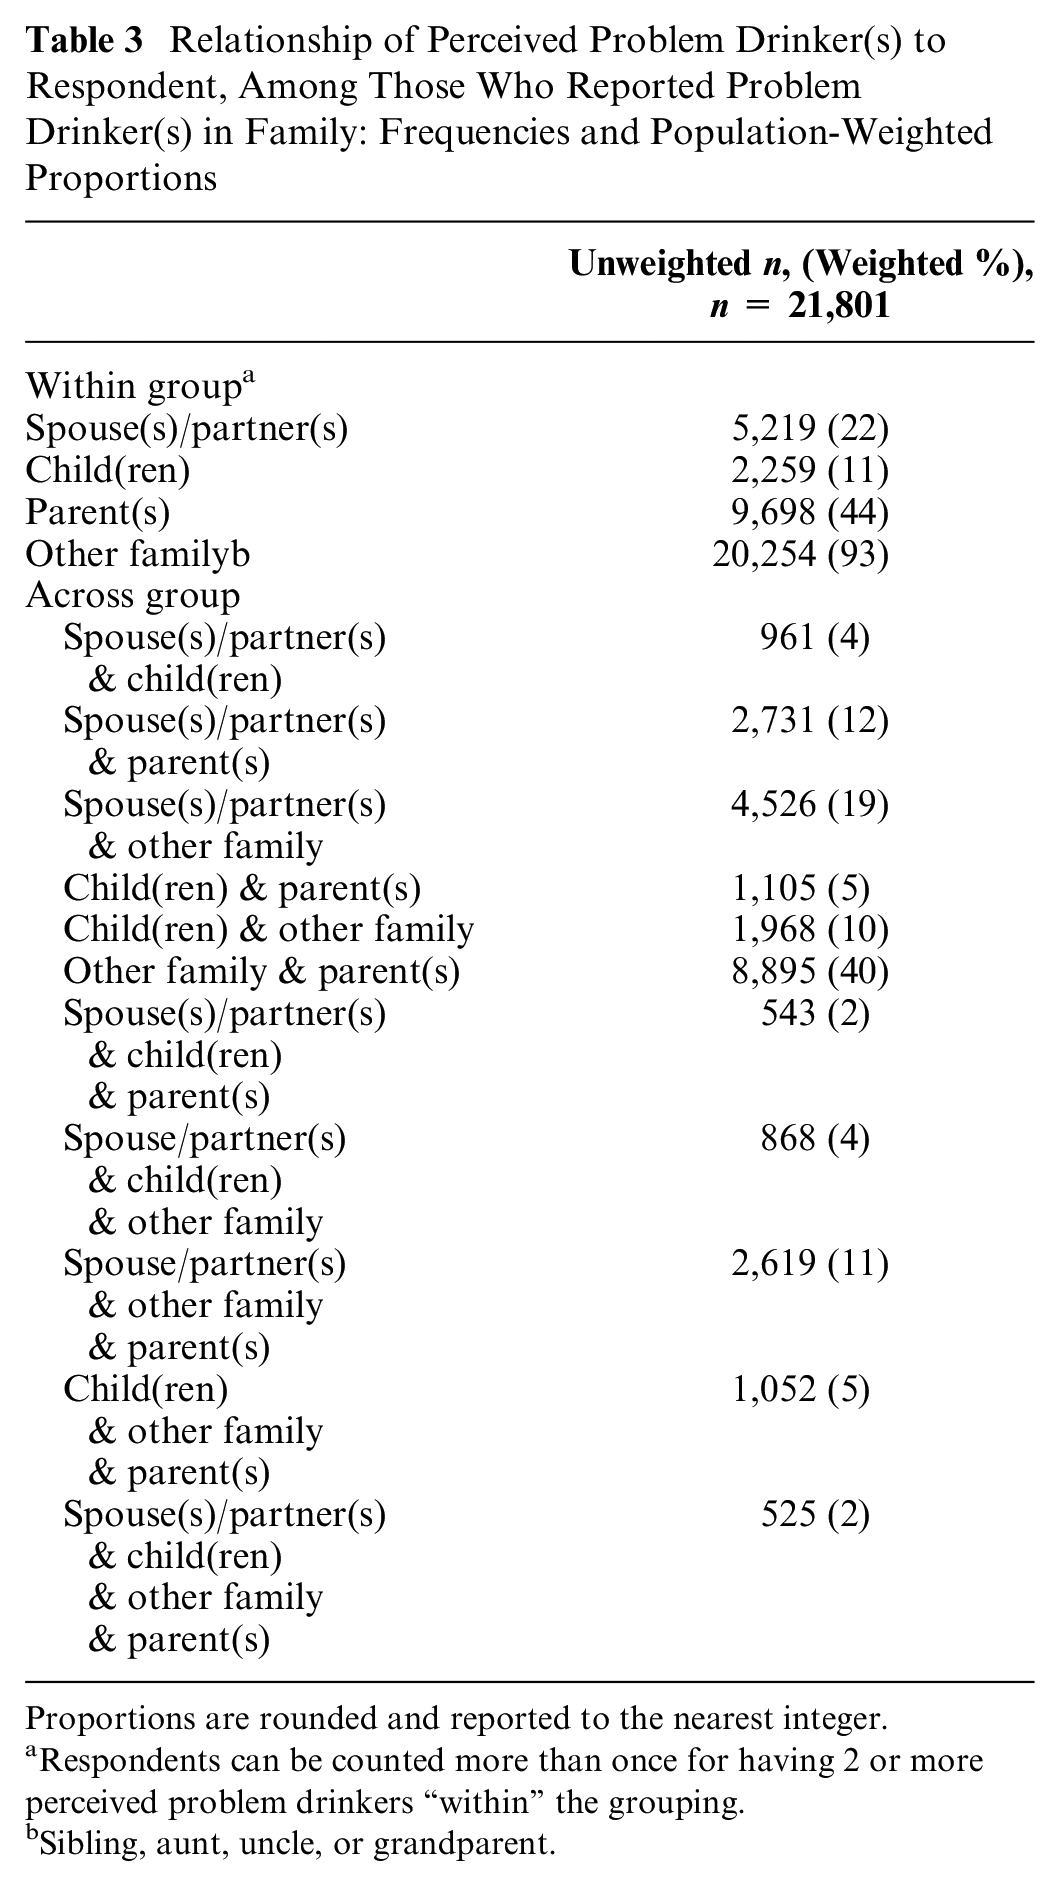
Proportions are rounded and reported to the nearest integer.
Respondents can be counted more than once for having 2 or more perceived problem drinkers “within” the grouping.
Sibling, aunt, uncle, or grandparent.
Table 4 presents the regression results. Adjusting for respondent alcohol consumption risk level, lifetime AUD status, and sociodemographic characteristics, the perception of at least 1 spouse or partner of ever having a drinking problem was associated with a mean SF-6D decrement of 0.033 (SE = 0.008; P < 0.001). The perception of one’s child or children as having a drinking problem at some point in time was associated with a mean SF-6D decrement of 0.30 (SE = 0.012; P < 0.013), a parent or parents of 0.025 (SE = 0.006; P < 0.001), and having at least 1 sibling, aunt/uncle, or grandparent perceived as such was associated with a mean SF-6D decrement of 0.023 (SE = 0.002; P < 0.001). All across-group combinations of relatives perceived as having alcoholism or drinking problems added small and nonsignificant associations to these mean decrements (the full model is included in the online supplementary materials; Appendix b). One’s own history of current or past AUD was associated with a mean SF-6D decrement of 0.039 (SE = 0.003; P < 0.001). Note that the counterintuitive result that moderate-risk consumption is preferable to never or no drinking is consistent with the literature. 19
Linear Regression Model of SF-6D Score as a Function of Problem Drinkers’ Relationship to Respondent, Respondent’s AUD, WHO Alcohol Consumption Risk Level, and Sociodemographic Characteristics

AUD, alcohol use disorder; CI, confidence interval; WHO, World Health Organization. Across-group family drinking and sociodemographic characteristics are not presented; the full model is included in the supplementary online material.
High- and very-high consumption risk levels were combined due to the small sample size.
Discussion
In a US population sample, we found that individuals who perceive their family members as currently having or having had a history of problem drinking report lower mean health utility compared with individuals who do not perceive such issues among their immediate and extended family, regardless of their own drinking. In addition, problematic drinking within one’s family is quite common in the United States, perceived as occurring in the present or past in nearly 3 of 4 families. Moreover, perceiving a spouse, child, or parent of being a problem drinker may be as detrimental to health utility as having a drinking problem oneself (Figure 1).

Regression-adjusted decrements and their 95% confidence intervals.
While most literature measuring the spillover effects of illness focuses on the health utility of family caregivers, 27 few studies have examined the family as a whole and specifically the heterogeneity of effects among different relatives. 28 This narrow literature suggests that family member type modifies spillover effects, which our results corroborate. 29 However, to our knowledge, spousal ill health is uncommonly associated with the most severe disutility relative to other family members; rather, child ill health is more often found to be the most damaging.29,30 Our findings to the contrary could indicate that the spillover effects from problem drinking manifest differently than other conditions or that lifelong exposure to family member problem drinking accumulates differently than does current-time exposure; we explored the former, while most literature explores the latter. That said, the difference between perceived child and spousal problem drinking was not statistically distinct in our results (confidence intervals overlap; see Figure 1), so our results may not represent a clear departure from the literature.
Our estimated utility decrements are in the 0.02 to 0.03 range, close to the minimally important difference of 0.03 commonly recognized in the literature.31,32 Comparisons of utilities and differences across utility measures present challenges, as values differ by myriad factors, including elicitation method and metric, population, and mode of administration. 33 In the context of family spillover effects, the utility loss associated with being a relative of someone with a health condition is widely variable and infrequently measured with the SF-6D, our metric, but more often in the 0.1 range.27,34 Notably, our definition of exposure to family drinking is quite broad, encapsulating both current and past exposure, which likely has a diminishing effect over time; considering only current exposure may be associated with higher SF-6D decrements.
Our results imply a distinct place for problem drinking in the spillover effects landscape, being both common within families and producing substantial effects on members. Prior research demonstrates 2 distinct family effects, “caring for” and “caring about,” which may in part explain why problem drinking differs from other conditions in this context. 35 It could be that those adversely affected by a family member’s drinking tend to care about that person’s well-being more than they directly attend to their condition, compared with other conditions wherein caregiving per se plays a more prominent role. Caring about a family member’s drinking problem may have a differential effect on utility or perhaps is captured differently by health utility measures, or both, relative to providing direct care for that person. Our results could be explained in part by the respondent’s knowledge and view of distant or even deceased relatives’ drinking behavior, prompting worry about one’s own propensity to experience a drinking problem. The constraints of the data prevent us from such disentangling; more research is necessary to determine whether family spillover from substance-based conditions, or heritable conditions in general, can be qualified in this way.
Our findings are both strengthened and constrained by the NESARC-III data set, which, although unmatched in sample size and scope, has limitations in the variables and measures available for our analysis. While NESARC-III is unique in providing a family-centric view of alcohol’s effects on others through questions about immediate and extended family members’ perceived drinking, the included questions are somewhat nonspecific. Most importantly, the timing and duration of family members’ drinking is unspecified, so the metric includes current or past drinking or both, and the drinking may be short or long term, episodic or chronic. The imprecision in timing means that any potential impact of family member drinking may be of varying salience at the time when NESARC-III data were collected. Compounding this timing issue, the SF-12v2 captures the experience over the past 4 wk, as do many health-related quality-of-life (HRQOL) measures, so the time span for drinking and HRQOL measurement may not align. 33 In addition, vague timing and the descriptive nature of this study render the direction of effects indeterminant; problem drinking in the family may reduce health utility or the converse may be true, in which low health utility leads to problem drinking. As such, we emphasize that our results are strictly associational. Lastly, the SF-12v2 has the advantage of being able to be used to derive a health utility measure, the SF-6D, but as with all “generic” utility measures, it focuses on specific dimensions of HRQOL and excludes other aspects of well-being that may be important in the family dynamic, potentially leading to misestimation of utility decrements. 33 That said, the SF-6D has been noted as useful for estimating health utility for milder conditions such as alcohol misuse and, potentially, spillover disutility.16,24,25
We also note that family members’ alcoholism and problem drinking are self-reported in the NESARC-III, which captures the respondent’s experience of others’ drinking issues but not a confirmed behavior or diagnosis. However, the perception of another’s drinking could arguably be the important metric in the context of spillover effects, as the respondent’s experience of their family member’s condition is most relevant to how it may affect them. In addition, using self-report to assess family drinking is a well-anchored strategy in the alcohol literature.9,36–38 Despite adjusting for multiple problem drinkers in the family, the constraints of the data prevented comprehensively adjusting for the number and quality of the sample-person’s relationships. Consequently, our results may be in part attributable to family size and closeness, although it should be noted that this is an emerging area of research in the field of family effects 39 and, consequently, is outside the scope of this study. We also note our objective was not to determine causality; we focused on providing regression-adjusted population mean disutility for use in CEA. As such, we accounted for factors that are known to be associated with utility and were available in our data set, including age, race, gender, marital status, and education plus employment as a proxy for income/socioeconomic status.
In conclusion, our results suggest that holistic, family-oriented approaches to alcohol interventions may provide value beyond the individual drinker because of the “web” of impact that emanates from one family member’s drinking. Such family-level alcohol treatment effects have been seen elsewhere and may motivate an emerging focus on family-centered care.8,34 Practitioners should be aware of patient-reported outcomes’ sensitivity to problem drinking in the family. Economic evaluation should consider the significance of family drinking behavior and the unique characteristics of alcohol-related spillover effects in determining the effectiveness and cost-effectiveness of policy and intervention.
Supplemental Material
sj-docx-1-mpp-10.1177_23814683221128507 – Supplemental material for Health Utility of Drinkers’ Family Members: A Secondary Analysis of a US Population Data Set
Supplemental material, sj-docx-1-mpp-10.1177_23814683221128507 for Health Utility of Drinkers’ Family Members: A Secondary Analysis of a US Population Data Set by Benjamin Thornburg, Jeremy W. Bray and Eve Wittenberg in MDM Policy & Practice
Footnotes
Acknowledgements
Funding for this analysis was provided by the National Institute on Alcohol Abuse and Alcoholism (NIAAA), grant No. 1R15AA027655-01. The views and opinions expressed in this article do not necessarily reflect those of the NIAAA or University of North Carolina at Greensboro. We thank Emma Hudson and Riley Hein for their research assistance. Analytic methods are available upon request to Benjamin Thornburg.
The authors declared no potential conflicts of interest with respect to the research, authorship, and/or publication of this article.
The authors disclosed receipt of the following financial support for the research, authorship, and/or publication of this article: Financial support for this study was provided entirely by a grant from NIAAA. The funding agreement ensured the authors’ independence in designing the study, interpreting the data, writing, and publishing the report.
Work Statement
Work was conducted within the department of economics at the University of North Carolina at Greensboro Bryan School of Business and Economics. Meetings were conducted via Zoom between partners at the University of North Carolina at Greensboro Bryan School of Business and Economics, Harvard TH Chan School of Public Health, and the Research Triangle Institute. This work was presented at the 43rd Annual North American Meeting of the Society for Medical Decision Making, as well as the 91st Conference of the Southern Economic Association.
References
Supplementary Material
Please find the following supplemental material available below.
For Open Access articles published under a Creative Commons License, all supplemental material carries the same license as the article it is associated with.
For non-Open Access articles published, all supplemental material carries a non-exclusive license, and permission requests for re-use of supplemental material or any part of supplemental material shall be sent directly to the copyright owner as specified in the copyright notice associated with the article.