
Abstract
Keywords
Introduction
Over the past two decades, major advancements have been achieved in the prevention, diagnosis, and treatment of human immunodeficiency virus (HIV) in the United States. Specifically, the introduction of highly effective antiretroviral therapy (ART) and the subsequent expansion of testing and treatment has led to significant increases in life expectancy for persons with HIV (PWH) and declines in HIV incidence.1–3 Nonetheless, HIV continues to present a significant public health burden. Over one million persons in the United States are living with HIV, and there are disparities in access and adherence to treatment. 3 Additionally, it is estimated that one in six men who have sex with men will be diagnosed with HIV in their lifetime. 4 Given the ongoing public health impact of HIV, and costly treatment and prevention modalities, economic analyses are needed to inform optimal use of prevention resources.
Quality-adjusted life years (QALYs) are the recommended metric for health outcome valuation in cost-effectiveness analyses (CEA).5,6 To calculate a QALY, utility weights based on preferences for health states (ranging from 1 for perfect health to 0 for death, with negative values for states worse than death) are applied to adjust life-years lived for quality-of-life. As such, QALYs reflect both morbidity and mortality in a single measure of effectiveness. However, it is unclear if commonly used health utility estimates in HIV prevention CEA adequately reflect modern HIV treatment.
Numerous approaches to generating utility weights for QALYs have been described.7–9 Direct utility estimation asks participants to directly assign utility weights (e.g., standard gamble, time tradeoff). Indirect utility elicitation uses generic health-related quality-of-life (HRQoL) instruments (e.g., short form six dimensions [SF-6D]) that require conversion into utility weights using preferences from other populations. There is debate as to whether utilities should be estimated from the perspective of the “community” (individuals in the general public), or the “patient” (individuals with the health outcome of interest). 10 The US Panel on Cost Effectiveness in Health and Medicine calls for health effects to be measured by community-derived preference-based health utilities, while others maintain that those who are experientially knowledgeable about the condition have a more valid perspective.5,11,12
Health utility estimates for PWH may be increasingly outdated as HIV has evolved from an acute, terminal illness into a chronic disease. To understand how health utility estimates are used in economic evaluations, we examined commonly referenced sources for HIV utilities used in HIV prevention CEA, present previously unpublished data from two additional studies, and discuss best practices for future HIV research efforts.
Methods
Using Centers of Disease Control and Prevention’s (CDC) Cost-Effectiveness of HIV/AIDS Prevention Database (CHAD), 13 we identified utility sources most commonly cited in US CEA pertaining to HIV prevention. CHAD is populated with economic evaluations identified by a systematic search of the HIV prevention literature. Relevant studies were identified using a broad search strategy including the following keywords: “cost,”“cost effectiveness,” and “HIV prevention” in six electronic databases (PubMed, PsycINFO, EMBASE, Cochrane, CINAHL, and EconLit). For this analysis, we completed a three-stage selection process. First, we included modeling studies published after 1999 (when ART became widely available) through 2016, yielding 136 studies. Second, we conducted a detailed review of abstracts to identify CEA (using the following key words: “utility,”“health status,” or “quality”), yielding 103 studies. Third, full-text reviews were conducted to identify and abstract the utility source(s) referenced. Two studies were determined not to have used utilities, and four studies lacked sufficient detail for assessment. From the final sample of 97 studies, we present details on health utilities for the most frequently referenced sources, representing the majority of utility references in HIV prevention CEAs. In addition, we noted common practices around reporting health utilities in HIV modeling and cost-effectiveness studies.
We also present previously unreported utility estimates from the INSIGHT Strategies for Management of Anti-Retroviral Therapy (SMART) trial and CDC’s Medical Monitoring Project (MMP). SMART was a randomized controlled trial that compared clinical outcomes of continuous versus intermittent CD4+ count-guided ART. HRQoL using the Short Form 12 Health Survey (SF-12) was assessed at baseline clinic visits for US participants enrolled between 2002 and 2006.14–16 MMP is an ongoing multisite supplemental surveillance system of PWH receiving medical care in the United States, which included the SF-12 Version 2 (SF-12v2) HRQoL in 2007. SMART and MMP data were converted into SF-6D health utility weights using an algorithm developed by Brazier and Roberts for the SF-12 with slight modification for the SF-12v2. 17 For all sources examined, we compare health utility reporting practices, data collection time frames, sample characteristics, assessment methods, and utility estimates.
Results
Over half of the published CEAs reviewed referenced more than one source for health utilities (mean of 2 sources, with a maximum of 7). In many cases, estimates were derived from multiple sources using different assessment approaches, and it was often unclear how specific estimates were applied. Details on sample characteristics were limited for many studies, specifically with regards to key HIV transmission categories and treatment status.
Five studies were most frequently cited as health utility sources in the HIV prevention literature (Table 1).18–22 Data collection for all five pre-date 1998 and the widespread use of ART. There were differences in how studies classified disease status with earlier studies using symptomatic, asymptomatic, and AIDS and/or CD4 strata, and later studies using CD4 strata alone (Table 1). Three of five pre-ART studies used direct elicitation, including a meta-analysis that provided pooled utility estimates based on multinational data collected as early as 1985.18,19,22 Two studies reported both community-based and patient-based estimates, with community-based estimates yielding lower utilities for a given health state.18,21 Among these previously published sources, there was a wide variation in utility weights, even within the same disease state (e.g., estimates for CD4 <200 ranged from 0.44 to 0.85).
Health Utility Estimates for Persons With HIV in the United States
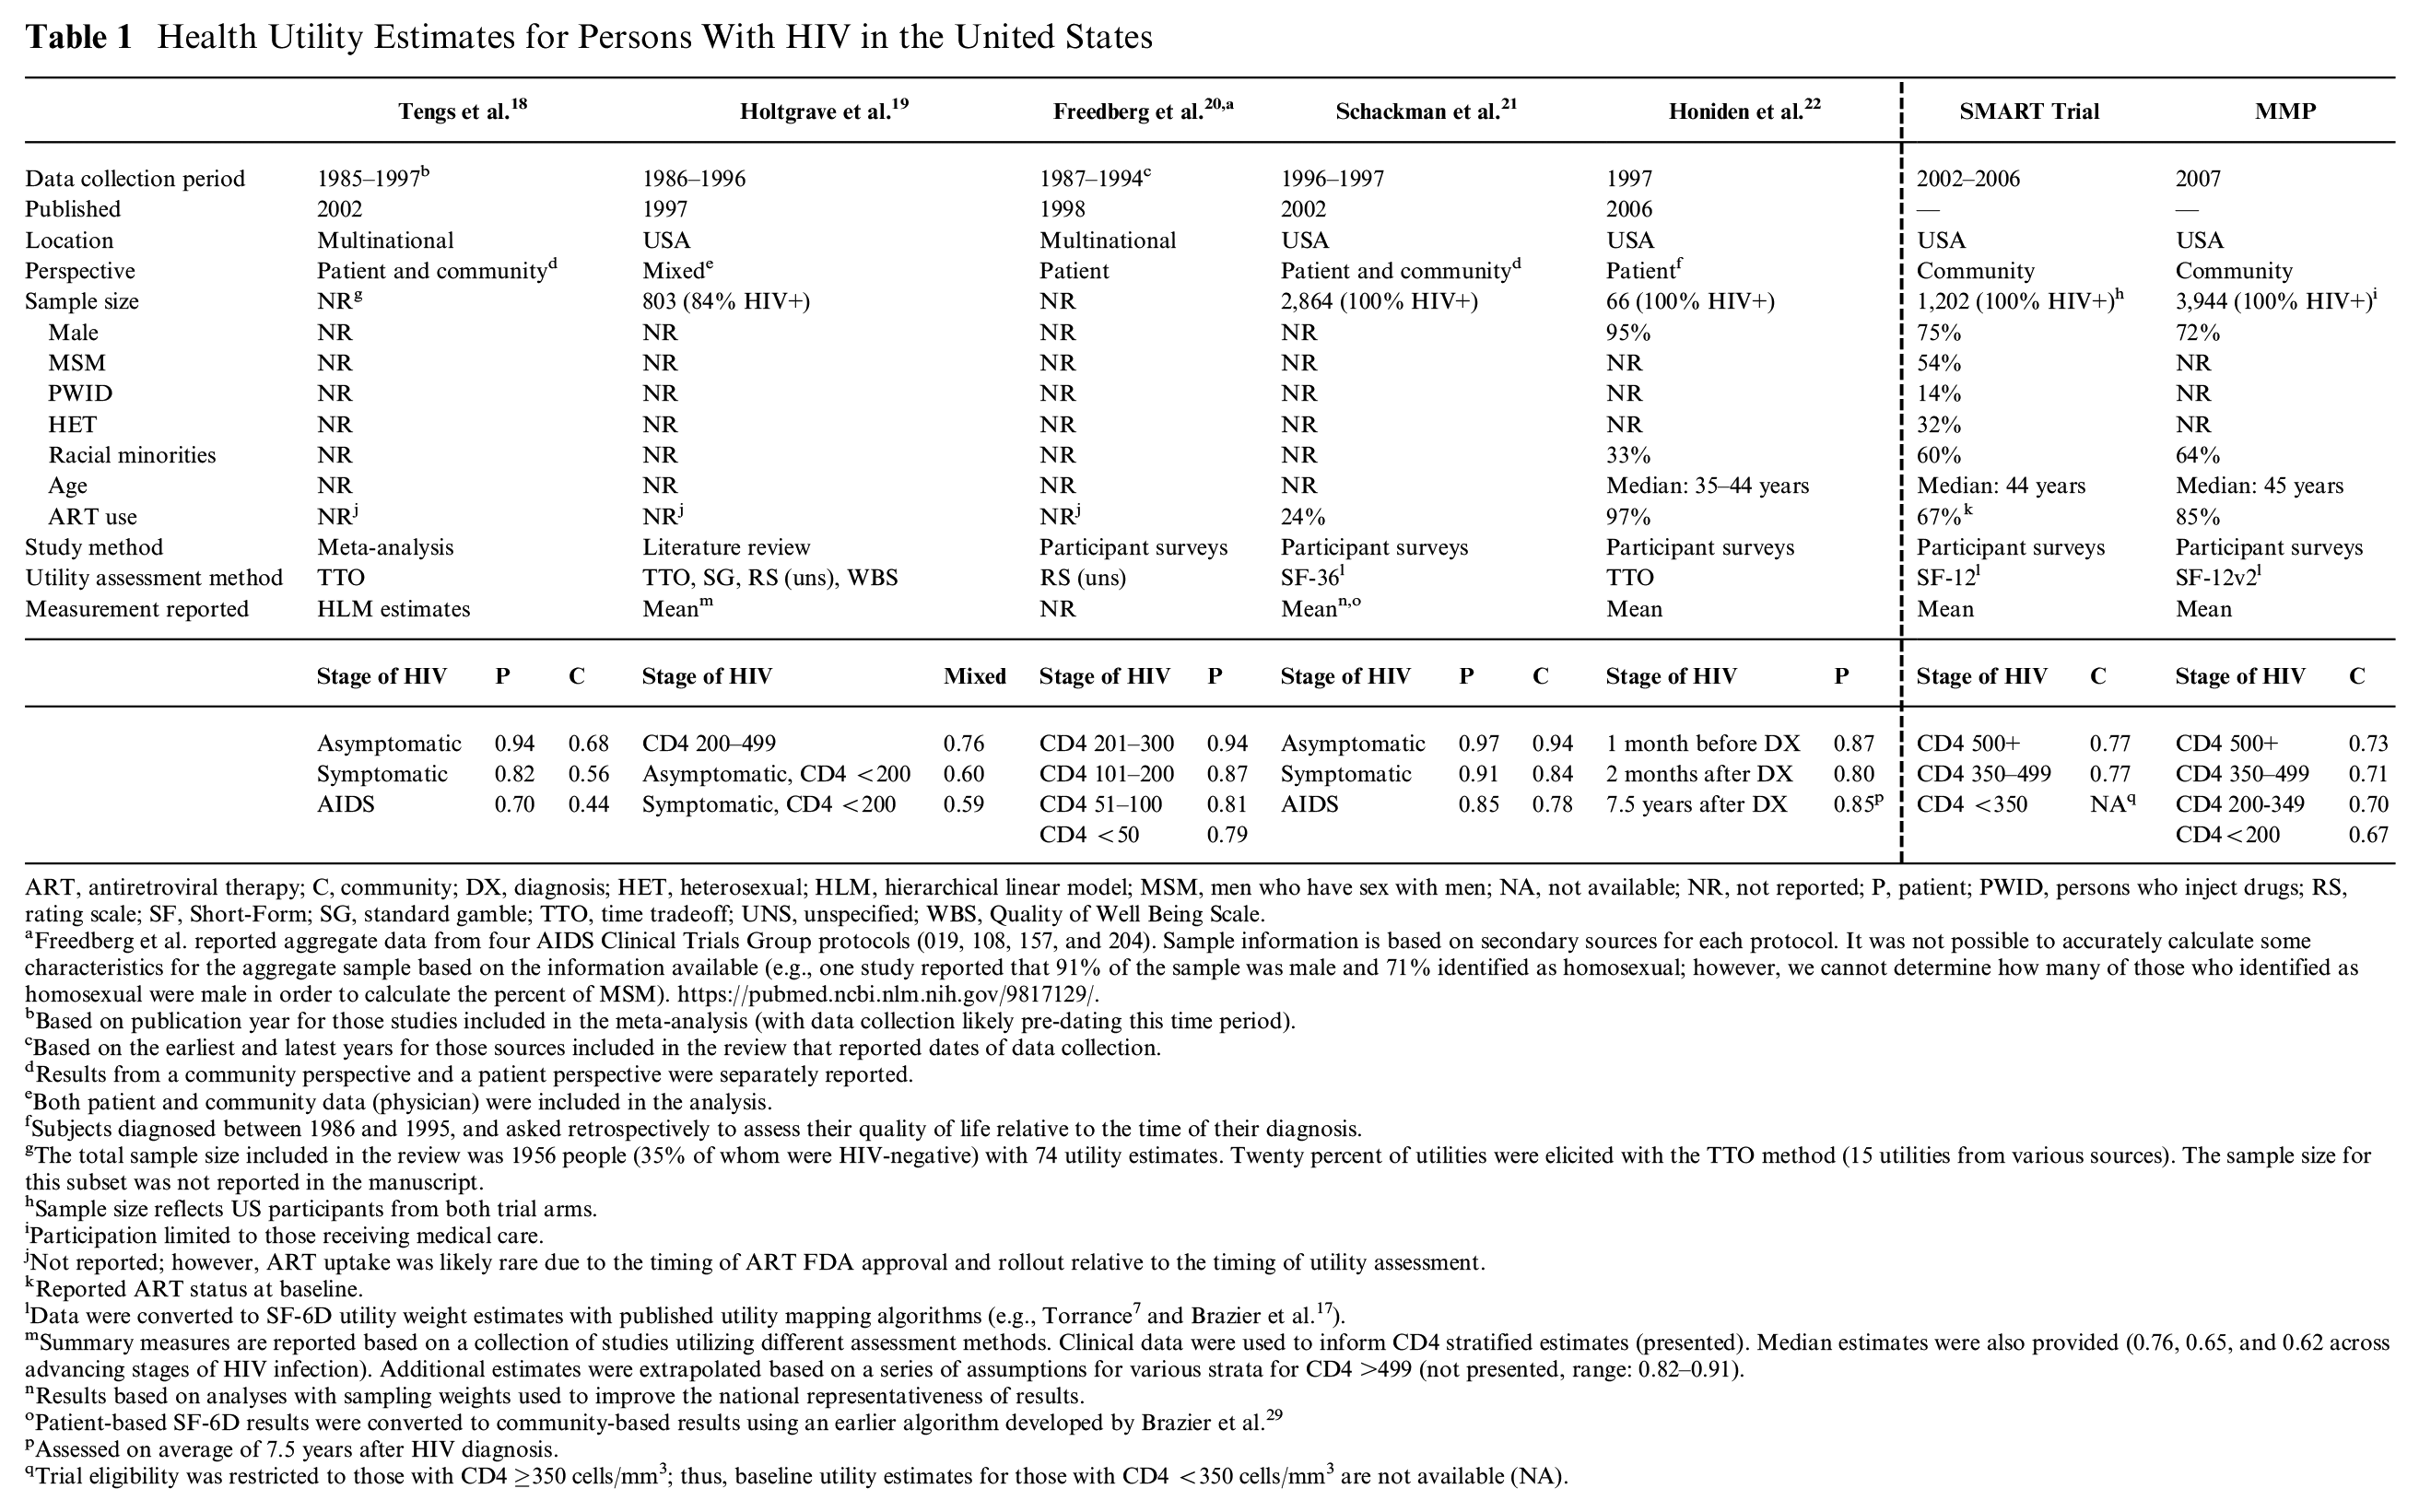
ART, antiretroviral therapy; C, community; DX, diagnosis; HET, heterosexual; HLM, hierarchical linear model; MSM, men who have sex with men; NA, not available; NR, not reported; P, patient; PWID, persons who inject drugs; RS, rating scale; SF, Short-Form; SG, standard gamble; TTO, time tradeoff; UNS, unspecified; WBS, Quality of Well Being Scale.
Freedberg et al. reported aggregate data from four AIDS Clinical Trials Group protocols (019, 108, 157, and 204). Sample information is based on secondary sources for each protocol. It was not possible to accurately calculate some characteristics for the aggregate sample based on the information available (e.g., one study reported that 91% of the sample was male and 71% identified as homosexual; however, we cannot determine how many of those who identified as homosexual were male in order to calculate the percent of MSM). https://pubmed.ncbi.nlm.nih.gov/9817129/.
Based on publication year for those studies included in the meta-analysis (with data collection likely pre-dating this time period).
Based on the earliest and latest years for those sources included in the review that reported dates of data collection.
Results from a community perspective and a patient perspective were separately reported.
Both patient and community data (physician) were included in the analysis.
Subjects diagnosed between 1986 and 1995, and asked retrospectively to assess their quality of life relative to the time of their diagnosis.
The total sample size included in the review was 1956 people (35% of whom were HIV-negative) with 74 utility estimates. Twenty percent of utilities were elicited with the TTO method (15 utilities from various sources). The sample size for this subset was not reported in the manuscript.
Sample size reflects US participants from both trial arms.
Participation limited to those receiving medical care.
Not reported; however, ART uptake was likely rare due to the timing of ART FDA approval and rollout relative to the timing of utility assessment.
Reported ART status at baseline.
Data were converted to SF-6D utility weight estimates with published utility mapping algorithms (e.g., Torrance 7 and Brazier et al. 17 ).
Summary measures are reported based on a collection of studies utilizing different assessment methods. Clinical data were used to inform CD4 stratified estimates (presented). Median estimates were also provided (0.76, 0.65, and 0.62 across advancing stages of HIV infection). Additional estimates were extrapolated based on a series of assumptions for various strata for CD4 >499 (not presented, range: 0.82–0.91).
Results based on analyses with sampling weights used to improve the national representativeness of results.
Patient-based SF-6D results were converted to community-based results using an earlier algorithm developed by Brazier et al. 29
Assessed on average of 7.5 years after HIV diagnosis.
Trial eligibility was restricted to those with CD4 ≥350 cells/mm3; thus, baseline utility estimates for those with CD4 <350 cells/mm3 are not available (NA).
In contrast, utility estimates derived from SMART (2002–2006) SF-12 and MMP (2007) SF-12V2 data were similar to each other and exhibited little variation across stages of HIV disease (ranging from 0.67 to 0.77). These indirect, community utility estimates also had a considerably smaller range across disease stages than pre-ART studies (0.44–0.97).
Discussion
We find that after 20 years of ART, cost-effectiveness analyses of HIV prevention interventions in the United States frequently use pre-ART heath utility weights which may have limited relevance today as HIV has evolved into a manageable, chronic disease. While there are few direct utility estimates from US populations in the current era of treatment, algorithms are available to map quality-of-life data to predict health utility scores.23,24
We also present post-ART health utility estimates that could be useful for economic evaluation. While MMP and SMART estimates were lower and had a more narrow range (0.67–0.77) than that of pre-ART studies, they are similar to estimates reported for ART clinical trial participants using similar indirect utility estimation (0.74–0.79). 25 These results are also consistent lower utility values reported in other studies that used indirect and community-based preferences.18,26,27 Additionally, we found a relatively low utility valuation (0.73 and 0.77) for the healthiest disease stage (CD4 >500) in the MMP and SMART data. This could be related to the conversion algorithm from the SF-12 HRQoL questionnaire to health utilities for current, healthier populations. Diminished HRQoL among PWH who have been effectively treated compared to the general population has been observed in other populations. 28 In addition to methodological considerations, it is important to consider differences in other aspects of HRQoL over the course of the epidemic. For example, socioeconomic considerations such as access to treatment and services are important as the epidemic increasingly affects marginalized communities.
Our study builds on previous research by identifying deficiencies in practices around applying and citing health utility data. Improvements are needed in the application and reporting of health utility data used in economic evaluations in HIV prevention. These include improved citation practices including citing original sources, clear identification of the specific utilities used from each source and providing information on the population from which the utilities were derived. Editors and reviewers should critically examine health utility citations and require transparency.
In addition to improved citation practices, cost-effectiveness analyses could include sensitivity analyses and unadjusted life years to address uncertainty in health state valuation for HIV. Incorporating sensitivity analyses that include both direct and indirect utility weights as well as estimates derived from the current era of treatment would be important to understand how these inputs affect cost-effectiveness findings and policy implications.
This study has limitations. Some studies focusing on HIV clinical care may not have been captured in the present analysis as the CHAD review process was developed to focus on HIV prevention. Differences in the classification of health states across studies and a lack of availability of data in certain health states limit the ability to make comparisons across studies. Thus, caution should be used in interpreting direct comparisons.
Conclusion
Cost-effectiveness analyses in HIV prevention use health utility weights that do not reflect the current state of the epidemic as it has evolved from an acute, terminal illness into a chronic disease. Sensitivity analyses that incorporate both direct and indirect utility weights as well as presenting life years in addition to QALYs would increase transparency and better inform HIV prevention policy.
Footnotes
The author(s) declared no potential conflicts of interest with respect to the research, authorship, and/or publication of this article.
The author(s) disclosed receipt of the following financial support for the research, authorship, and/or publication of this article: The INSIGHT SMART trial was funded through NIH NIAID U01 AI068641, U01 AI042170, and U01 AI046362. Funding for the Medical Monitoring Project is provided by a cooperative agreement from the Centers for Disease Control and Prevention. These funding agreements ensured independence in study design, interpreting the data, writing, and publishing the report. The findings and conclusions in this report are those of the authors and do not necessarily represent the official position of the Centers for Disease Control and Prevention.
Authors’ Note
Parts of this work were presented at the 2016 Society for Medical Decision Making Conference in Vancouver, Canada (PS 1-46).