
Abstract
The quality-adjusted life year (QALY) model provides one of the most popular health measures in health economics and clinical research. The QALY model combines quality of life and survival into a single measure and is often used in cost–utility studies, in which decision makers model which treatment is best. Usually, the QALY model is represented mathematically as
In most studies, the health–utility scale is anchored on 0 (dead) and 1 (perfect health). Health states considered worse than dead have negative utility values on this scale, and health states considered better than dead have a positive utility value. Rank ordering health states close to dead is problematic, because it depends on the measurement method whether a health state is considered better or worse than dead.6–7 In other words, the relative position of dead on the rank order is subject to uncertainty due to the choice of measurement method. Another source of uncertainty regarding the position of dead can be identified. In DCEs, paired comparisons of health states allow for a rank ordering of health states. This is used to assign cardinal values to health states by using random utility models. 8 There are several models to anchor DCE data on (dead) 0 and (perfect health) 1 in the EQ-5D or other health–utility valuation studies.9–11 Even within the same valuation study, however, each of these models leads to a different position of dead, resulting in varying amounts of health states that are considered worse than dead. Again, the relative position of dead on the rank order varies, but this is now due to uncertainty about the choice of random utility model.
The variation in the rank order position of dead causes variation in the values of health states on the health–utility scale. For example, to assess whether health states are positive or negative, the origin of the health–utility scale needs to be established. In some valuation methods such as TTO, SG, and BTD, it seems obvious to assign a value of 0 to dead, because health states are directly compared to dead. For example, in TTO, a health state is considered equal to dead if it is considered equal to 0 years in perfect health, and dead is then assigned a value of 0. For other methods such as the DCE, setting dead at 0 seems less obvious because health states are not directly compared to dead.
DCE valuations of health states produce a latent scale for health utilities that does not directly incorporate dead. 9 Equally important, however, are the theoretical considerations regarding the position of dead, which will be the focus of this article. Because DCE is becoming a more popular valuation method for health states, with substantial benefits regarding data collection, it is important to improve our understanding of the position of dead on the health–utility scale. Two research questions are formulated: 1) what are the arguments set forth to assign dead the number 0 on the health–utility scale, and 2) what are the effects of the position of dead on the health–utility scale on decision making? To accomplish this purpose, a literature review is conducted to explore the arguments put forward for setting dead at 0 on the health–utility scale. Furthermore, the effect of alternative values for dead on decision making with the QALY model is examined.
Literature Review
A literature review was conducted to explore the arguments set forth for anchoring the QALY model at dead (0) and perfect health (1). Six literature databases were examined: PubMed, Embase, Web of Science, PsycINFO, EconLit, and Cochrane. These databases span literature in the 3 most important domains for quality of life and health economic research: the biomedical, psychological, and economic sciences. The search strategy for each of these databases can be found in Supplementary Appendix A.
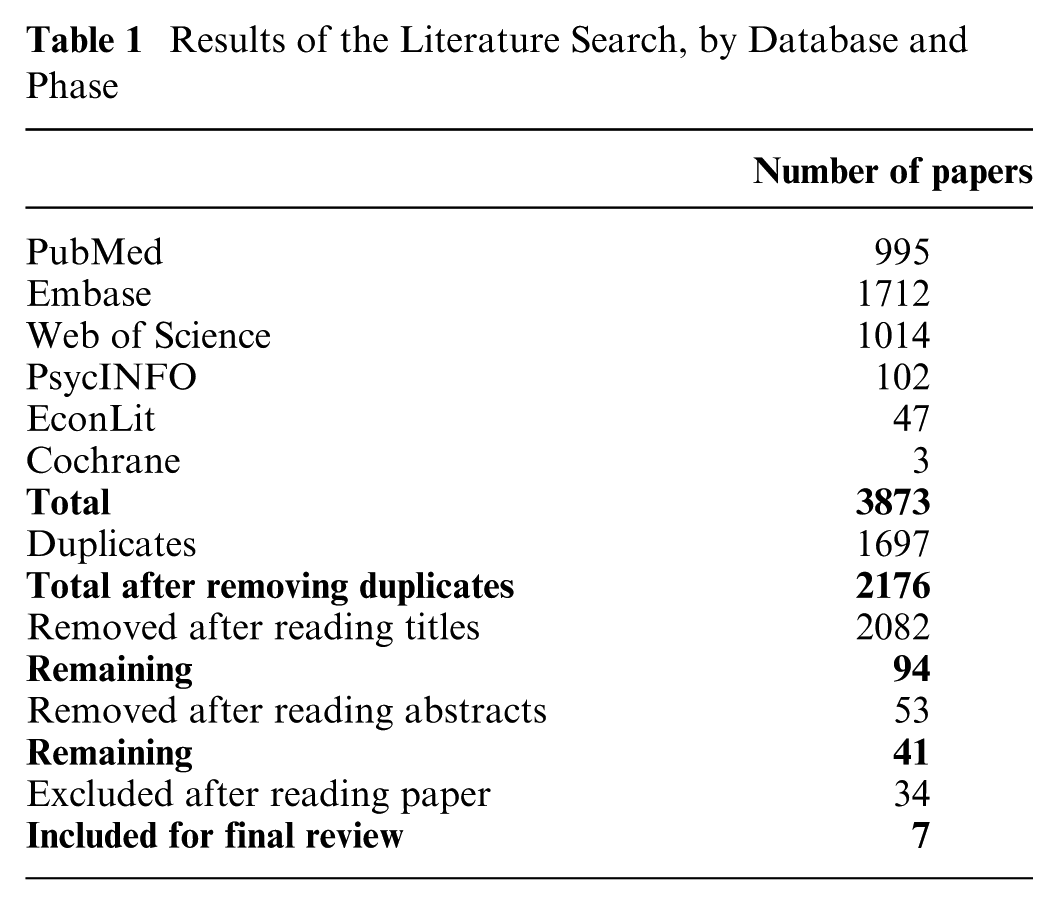
The search strategy resulted in the identification of 3873 papers, of which 1697 were duplicates, leaving 2176 papers to be further evaluated. In the next phase, 2082 papers were excluded because their title was irrelevant to the subject of this review, dealing with applied economic evaluations of treatments or medicines. Thus, a selection of 94 papers remained, of which 53 more papers were excluded based on their abstracts, dealing mainly with EQ-5D valuation studies and studies on utility assessment; 41 papers were read in the review. For final inclusion in the review, papers, books, or theses should at least be on a topic related to the QALY model, health utilities, scale properties, or methods for the elicitation of health utilities. An overview of the search results is provided in Table 1.
Results of the Literature Search, by Database and Phase
Because a literature review in electronic databases leads to the inclusion of research papers and does not include other sources, an additional selection of 11 health economic and decision analytical handbooks is included in our review, as well as 5 PhD theses.
Out of the papers, books, and theses that were included in the final selection, some papers provided arguments or comments dealing with topics related to setting dead to 0. An overview is provided in Table 2. Furthermore, for inclusion in the final review, the paper, book, or thesis must touch on the topic of anchoring the health–utility scale or QALY model. Literature on measurement theory is included if it is on scale anchoring, related to the topic of research. Literature was excluded if these criteria were not met, or if the paper was unavailable or only available in a language other than English.
Arguments Identified by the Literature Review or the Books and PhD Theses Review
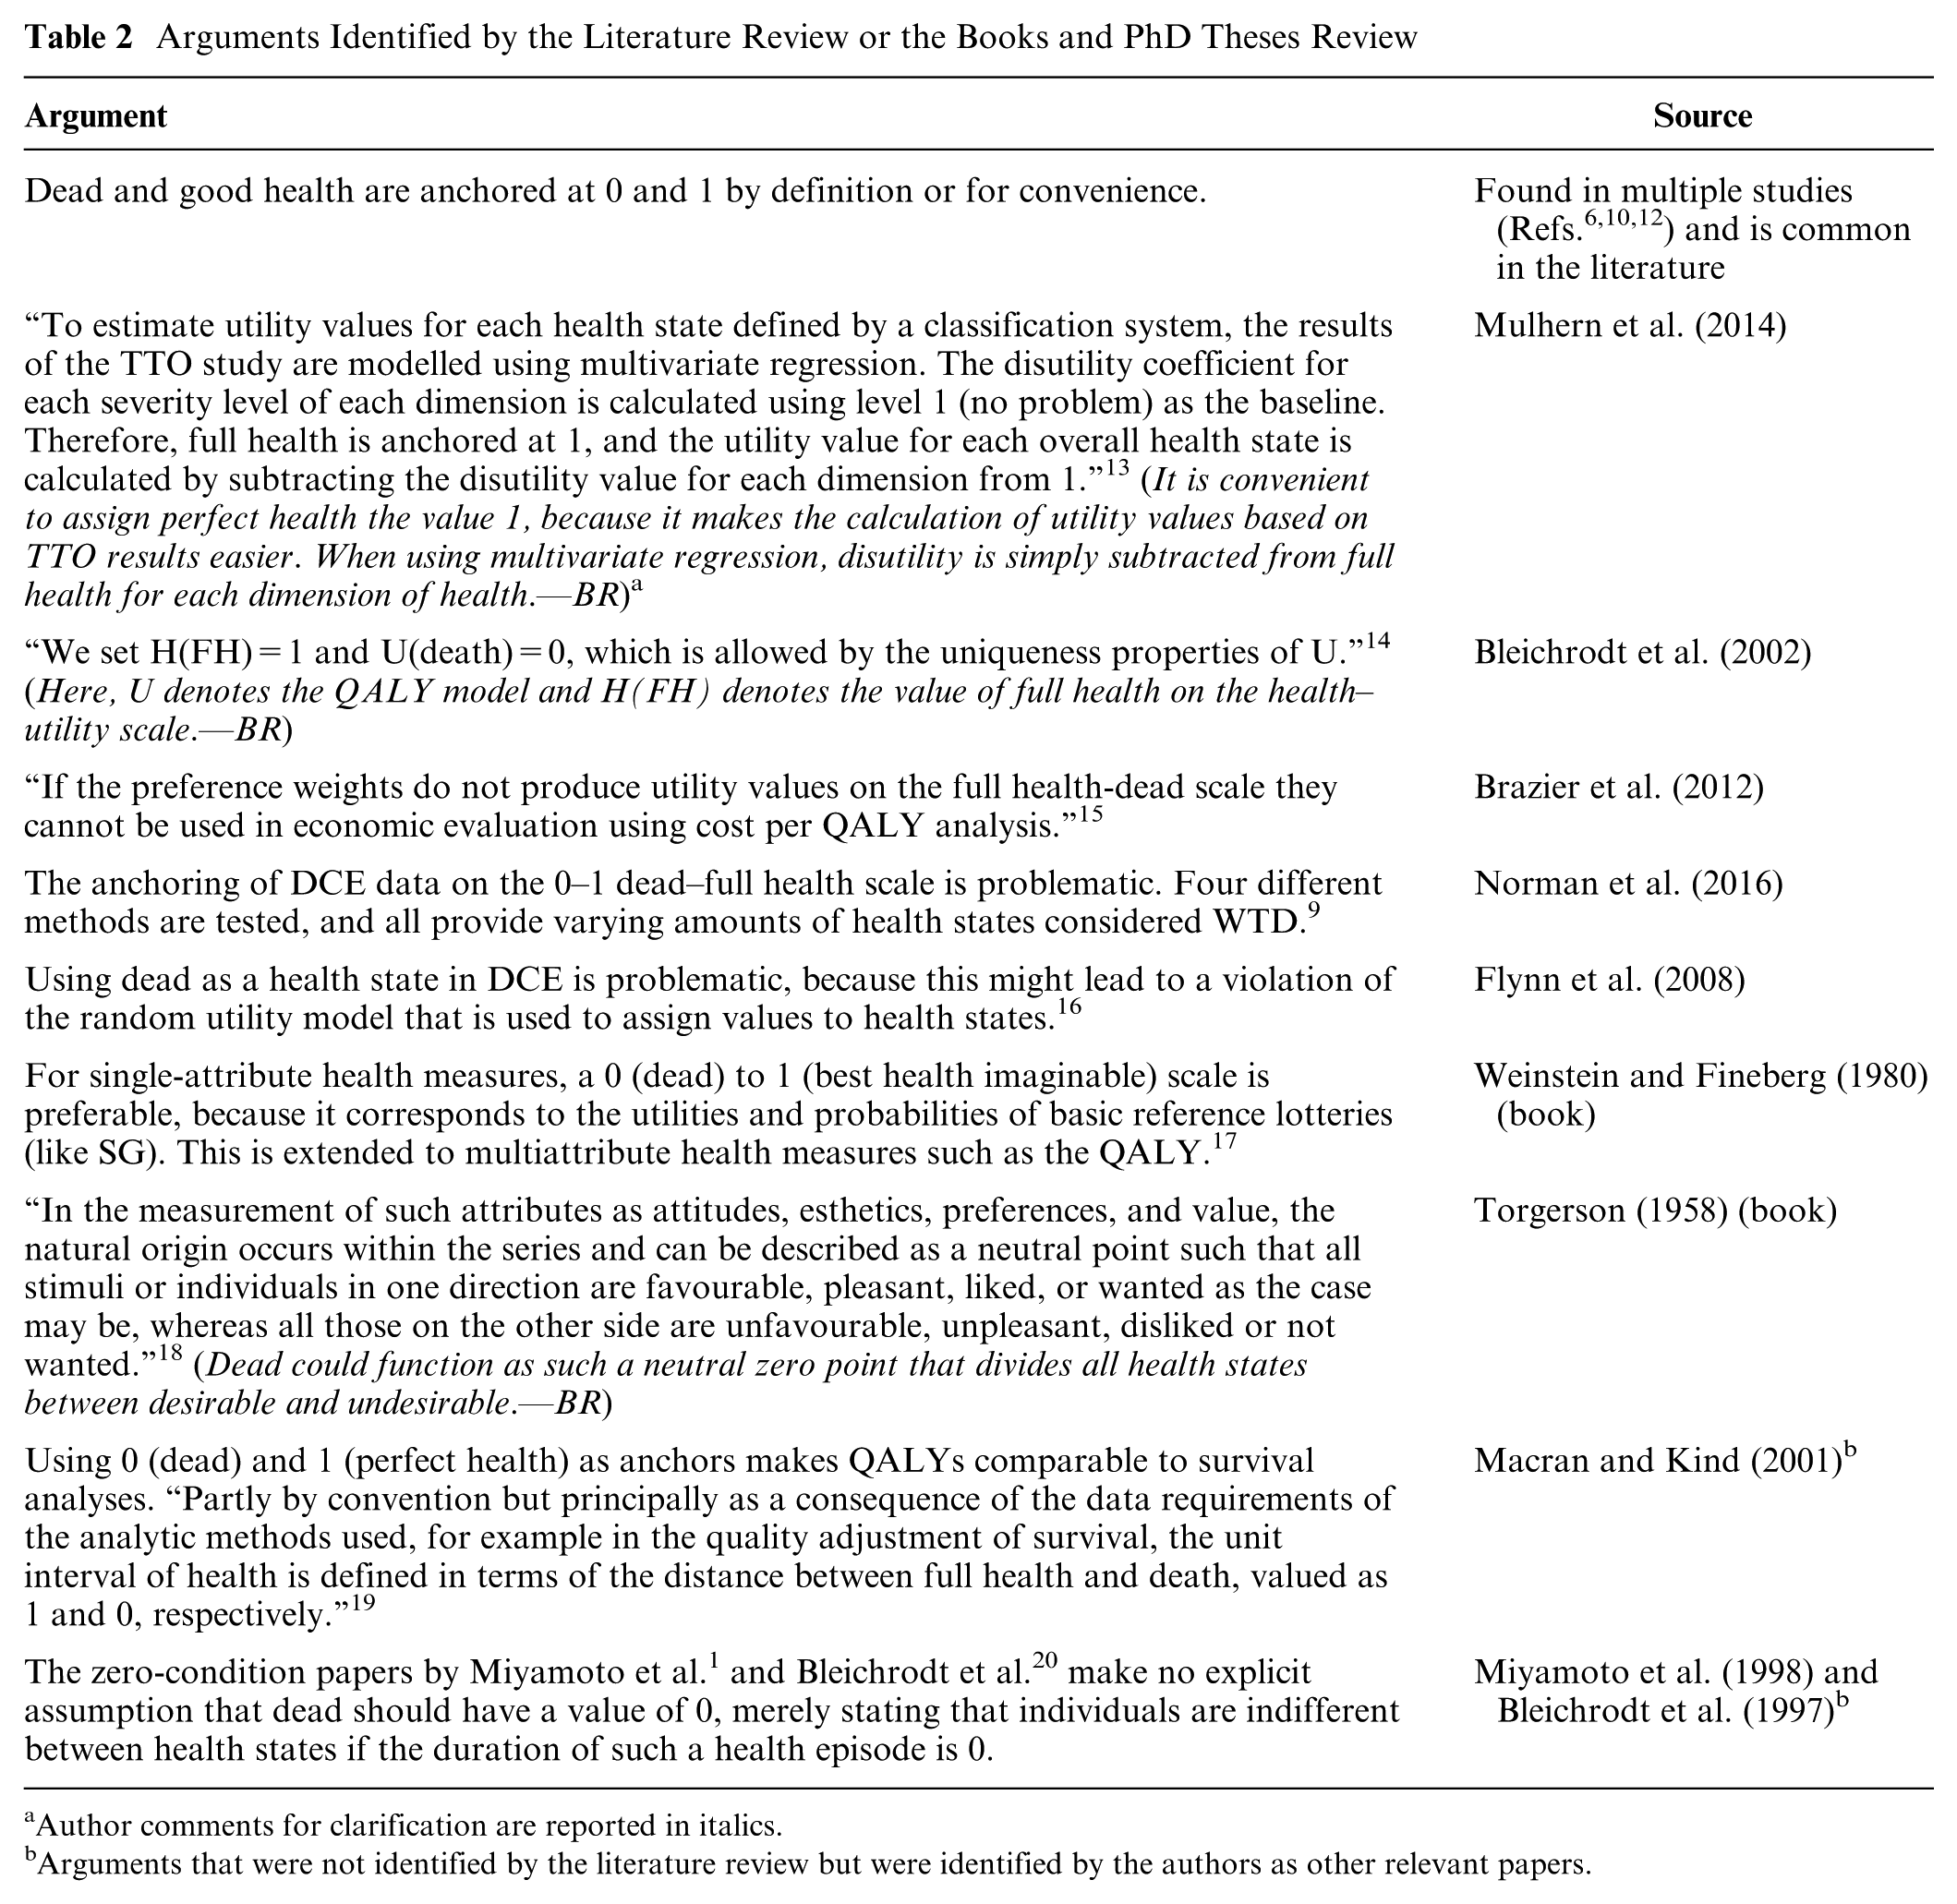
Author comments for clarification are reported in italics.
Arguments that were not identified by the literature review but were identified by the authors as other relevant papers.
Scale Properties and Decision Making
In addition to the arguments found above, we examine whether scale types can provide more arguments for setting dead at 0. First, we provide a short exposition of ratio and interval scales. Second, we provide an example that shows that, in the QALY model, the duration scale
Scale Properties
The QALY model is a utility function containing duration and health as attributes. 2 Utilities for expected utility calculations should have interval-scale properties, which will be defined later. 21 Below, interval and ratio scale types are considered, followed by their consequences for the QALY model and the position of dead.
Following Torgersen, measurement entails the assignment of numbers to objects to represent the degree of some common property of the objects.
18
The order of these numbers corresponds to the magnitude of the objects’ property. On interval scales, the size of the numeric difference between pairs of the objects is meaningful. These so-called intervals reflect the distance between different amounts of the objects’ properties.
18
An example of an interval scale is the Celsius temperature scale. On this scale, the difference between 10 and 20 °C is equal to the difference between 30 and 40 °C.
i
Coombs et al.
22
show that values on an interval scale can be linearly transformed by
On interval scales, the distances between the objects on the scale are meaningful. On ratio scales, the numbers themselves, assigned to the objects, are meaningful, because they correspond to the distance of the object from the natural origin.
18
An example of a ratio scale is the metric system of length, in which it is possible to state that an object with a length of 2 m is twice as long as an object with a length of 1 m. This assertion is possible because the origin is not arbitrary, as on interval scales; ratio scales have a natural origin, which means that an object of length 0 should be assigned the number 0 on the length scale. Statements about ratios are enabled by the natural 0, and ratio scales can be only multiplicatively transformed,
Scale Transformations, Indifference, and the QALY Model
The different properties of ratio and interval scales may affect QALY calculations differently. To illustrate whether scale transformations in the QALY model leave decisions invariant, examples are provided in Figure 1. Suppose that a respondent is indifferent between 2 health episodes A and B, as in Figure 2. Episode A yields 10 years in perfect health, followed by 10 years in a mild state. Episode B yields 15 years in perfect health, followed by 5 years in a moderate state. If we apply the standard health–utility scale with values 0 (dead) and 1 (perfect health) together with the QALY model,
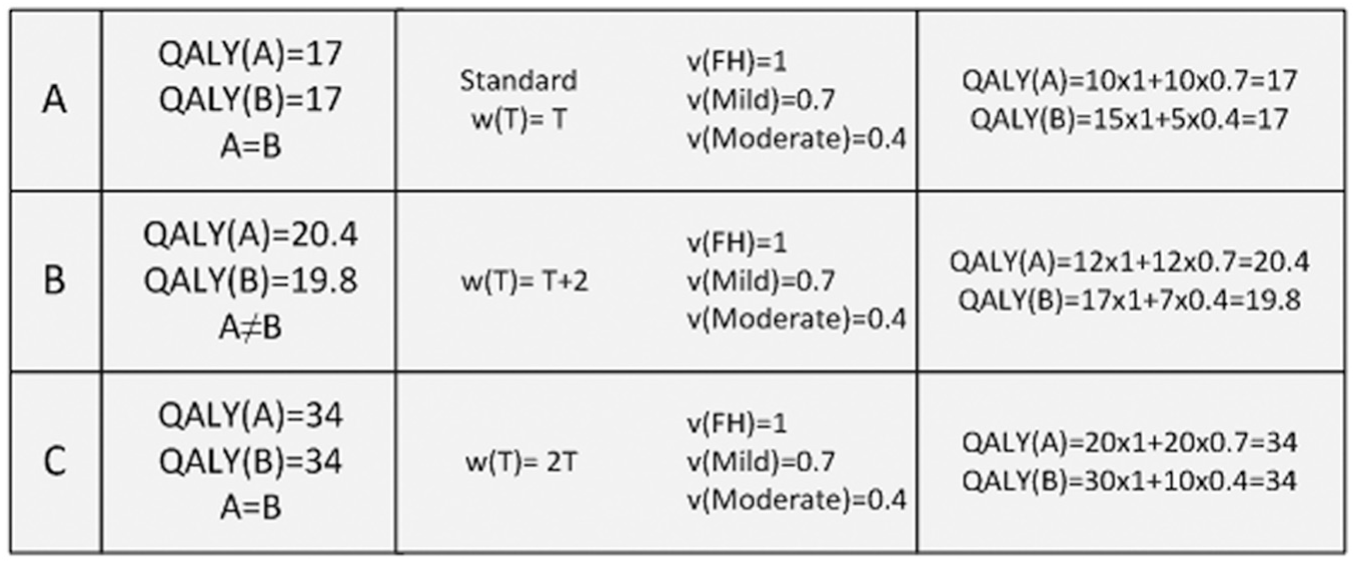
Different quality-adjusted life year (QALY) values after performing scale transformations on the value
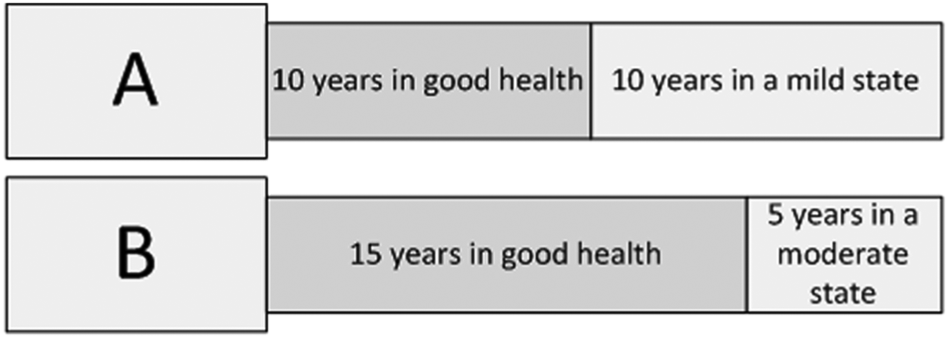
The decision maker is indifferent between 2 options, A and B.
Before discussing the health–utility scale
Row C of Figure 1 is meant to illustrate that, on ratio scales, indifferences do not change under ratio scale transformations. As stated before, ratio scales permit only positive multiplicative transformations. Row C of Figure 1 provides an illustration of such a transformation. Again, we use health episodes A and B, as in Figure 2, and apply the QALY model. Let us now assume that the duration scale is a ratio scale and apply a ratio scale transformation by multiplying all values on the duration scale by 2 to construct
Summarizing, the examples above show that interval scale transformations on the duration scale do not leave QALY indifferences invariant. Instead, ratio scale transformations are necessary to preserve the indifferences calculated with the QALY model. Therefore,
Anchoring Duration at 0
Next, an argument is given for setting the value of a duration of 0 years at 0. The zero condition by Miyamoto et al. states that all health states are equally preferred when the duration of those health episodes is 0, or
Anchoring Dead at 0
To set dead to 0, consider 2 health episodes: 1 episode
In the reasoning above, we have set 0 years at 0, using the zero condition for duration.
1
In essence, this zero condition asks which duration nullifies health differences. Symmetrically, one may ask which health state nullifies time differences, a zero condition for health. When considering
Scale Properties of the QALY Model
To summarize, the position of dead is fixed at 0; thus, additive transformations changing the value of dead are not allowed. Therefore, the health–utility scale has ratio scale properties, just like the duration scale. This is required because the QALY model is a multiplicative model, implying that both the duration and the health–utility scale must have ratio scale properties. Only when both scales have a true natural 0 will the multiplication be logically meaningful. 23 With dead and a duration of 0 years being assigned the number 0 on the 2 scales, this criterion is met.
The Position of Dead Relative to Other Health States
So far, we have discussed the effects of linear and multiplicative transformations of the duration scale
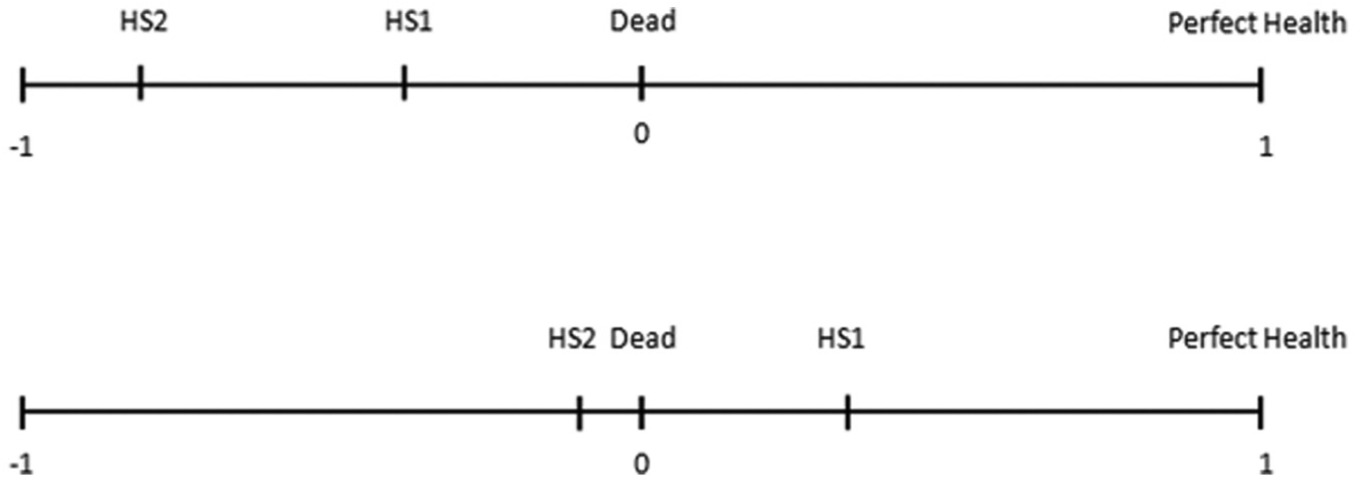
Position of dead on the health–utility scale. (Top) A health–utility scale with an emphasis on life-improving treatments. (Bottom) A health–utility scale with an emphasis on life-saving treatments. These figures illustrate altered priorities when the position of dead changes relative to other health states. In the top figure, the quality-adjusted life year (QALY) gain from dead to perfect health is smaller than the gain from HS1 (health state 1) to perfect health; in the bottom figure, it is larger.
Figure 3 also illustrates the importance of getting the ordinal position of dead right. This position determines the amount of health states considered worse than dead. Negative values are assigned to health states worse than dead, indicating that shorter durations are preferred to longer durations for these health states. This means that the ordinal position of dead again affects cost–utility analyses and as a consequence the allocation of resources in health care.
Discussion
The main findings of this article consist of the arguments found in the literature review, the arguments derived from the scale properties of the health–utility and duration scales of the QALY model, and the effect of the position of dead on decision making. The arguments from the literature review can be divided into practical arguments and theoretical arguments. The most common practical argument simply says that dead is anchored at 0 by definition or for convenience, or mentions that it is possible to do so. Other practical arguments explain why anchoring dead at 0 and perfect health at 1 is convenient in cost–utility analyses, a common application of the QALY. One example is that these anchors make the QALY comparable to survival analyses, and another example is that these anchors allow for a convenient calculation of QALYs by subtracting disutility from perfect health.13,15,19 A theoretical argument from the literature is that it is possible, but not necessary, to assign the number 0 to dead due to the uniqueness property of the QALY model. 20
Scale properties provide additional arguments for assigning the value 0 to dead. First, interval scale properties for the duration scale are not sufficient for QALY calculations. Specifically, applying interval scale transformations to the duration scale misrepresents the preferences of a respondent indifferent between 2 health episodes. Instead, ratio scale properties are necessary for the duration scale to calculate QALYs. This also holds for the health–utility scale. Second, we show that
Regarding our second research question, the position of dead strongly affects decision making. It determines the trade-off between life-saving and life-improving interventions. Furthermore, it determines which states are negative, with the accompanying notion of preferences for shorter durations.
Limitations and Strengths
One of the limitations of this study is that potentially relevant information was not presented in the titles and abstracts of the electronic literature that was searched. Because the topic of research is relatively unexplored, more information might have been found in full texts. Another limitation is that the book and PhD theses review was limited due to practical constraints. Be that as it may, the health economic handbooks that we did examine did not provide relevant arguments.
A strength of this study is the literature on measurement theory that provided relevant information. Another strength of this study is that we address our topic through a literature search as well as a theoretical analysis. In addition, multiple literature databases were searched for relevant electronic literature, which decreases the probability of missing relevant literature.
Relation to Other Studies
A study by Prieto and Sacristan also concludes that the health–utility scale should have ratio scale properties. 24 Prieto and Sacristan state that ratio scale properties are needed for the health–utility scale, because ratios between QALYs calculated for 2 different health episodes are not invariant under interval scale transformations of the health–utility scale. 24 There are some differences between Prieto and Sacristan’s reasoning and ours. Our reasoning starts from the duration scale, and our aim is to establish the origin of the health–utility scale. Prieto and Sacristan instead start from the health–utility scale and are not concerned with the origin of scales.
Implications for Research
For decision making, the position of dead relative to other health states is critical. The ordinal position of dead determines the amount of health states considered worse than dead and the trade-off between life-saving and life-improving values. In practice, the position of dead is determined by the choice of model and the choice of valuation method. Some valuation methods value states using dead, for example TTO, SG, and BTD.5,12 The position of dead is then fixed, and health states are positioned on the health–utility scale relative to dead. These methods establish positive and negative health states in a more or less straightforward way.
In DCEs, setting dead at zero is less straightforward because health states are not compared to dead. Different models to incorporate dead into DCEs lead to varying results, and it is unclear which model should be preferred.9,25,26 We have shown that dead needs to have the value 0 in the QALY model, but we also argue that the ordinal position of dead needs to be carefully established. Then, for DCEs, more attention should be given to anchoring dead relative to other health states. Although our study highlights the importance of getting the relative position of dead right, it does not provide a direct solution for the problems related to discrete choice experiments.
Conclusion
This article provides insight into the arguments for setting dead at 0 in the QALY model and the effects of the position of dead on decision making. Our main conclusions are that both the health–utility scale and duration scale should have ratio scale properties and that dead should be assigned the value 0, via preferences and the 2 zero conditions. The position of dead relative to other health states should be carefully established, because it weighs the relative contribution of life-saving and life-improving values in cost–utility analyses and separates positive and negative health states. Given that dead is the origin of the health–utility scale, measurement methods comparing health states to dead should, in our opinion, receive more attention.
Supplemental Material
DS_10.1177_0272989X18765184 – Supplemental material for Setting Dead at Zero: Applying Scale Properties to the QALY Model
Supplemental material, DS_10.1177_0272989X18765184 for Setting Dead at Zero: Applying Scale Properties to the QALY Model by Bram Roudijk, A. Rogier T. Donders, and Peep F.M. Stalmeier in Medical Decision Making
Footnotes
Acknowledgements
The authors thank Eddy Adang, Balder Stalmeier, Richard Norman, and 3 anonymous reviewers for helpful suggestions and comments on an earlier draft of this article.
Research was performed at the Department for Health Evidence, Radboudumc, Nijmegen, the Netherlands. Research was presented as a poster at the EuroQol Plenary Meeting in Barcelona, Spain, September 21–22, 2017.
Financial support for this study was provided entirely by a grant from the EuroQol Research Foundation (EQ Project 2015150). The funding agreement ensured the authors’ independence in designing the study, interpreting the data, writing, and publishing the report.
Notes
References
Supplementary Material
Please find the following supplemental material available below.
For Open Access articles published under a Creative Commons License, all supplemental material carries the same license as the article it is associated with.
For non-Open Access articles published, all supplemental material carries a non-exclusive license, and permission requests for re-use of supplemental material or any part of supplemental material shall be sent directly to the copyright owner as specified in the copyright notice associated with the article.