
Abstract
The clinical complexity of health policy models such as the Cost-Effectiveness of Preventing AIDS Complications Pediatric (CEPAC-P) model allows highly detailed analyses that capture many essential components of HIV disease progression and clinical care.1–4 However, microsimulation model complexity often requires that model users undergo extensive training before conducting time-intensive and computationally intensive model-based analyses. Public health planners aim to allocate resources among health care strategies as efficiently as possible. However, they do not always have access to published research findings from a detailed microsimulation model for scenarios that resemble their own specific circumstances. Moreover, they may prefer instantaneous (although less nuanced) results in order to make policy decisions quickly. Therefore, there is a pressing need for alternate approaches to make model results accessible to a wide range of users and to permit users to modify analyses quickly to reflect the unique features of their own clinical or programmatic settings.
In a previous analysis, we used the CEPAC-P microsimulation model of pediatric HIV acquisition and disease progression to evaluate two strategies for infant HIV testing and screening in South Africa, Zimbabwe, and Côte d’Ivoire to inform World Health Organization (WHO) recommendations. 5 As requested by policy makers, we varied key clinical and economic inputs to reflect a range of local settings. These variations were time-intensive and computationally intensive. A “light” version of the CEPAC-P model—a metamodel, based on statistical analysis of model inputs and outputs from many simulation runs—may provide a solution to making this complex health policy model publicly available while enabling public health planners to customize the model input parameters to local settings and receive immediate results. There is a sizeable literature on metamodeling, most of it in the physical sciences and engineering.6–8 In health policy, as yet, such statistical metamodels have mainly been used to reduce computing time in value of information analyses, quantifying the impact of decision uncertainty in model input parameters.9–13 In this article, we describe the use of metamodels to simulate different scenarios based on sets of input parameters that can be varied in a widely accessible decision-support tool. The objectives of this study were to make the CEPAC-P model results available in a real-time decision-making tool to public health planners and to investigate the predictive validity of linear regression metamodels used to support this tool that compares infant HIV testing and screening strategies.
Methods
Infant HIV Testing Strategies in the CEPAC-P Model
Early infant HIV diagnosis and antiretroviral therapy markedly reduce pediatric mortality. 14 The WHO recommends early infant HIV diagnosis (EID) at 6 weeks of age for all infants who are at risk for HIV infection (i.e., HIV-exposed). However, many HIV-exposed infants are not being tested (49% globally, as of 2017), 15 due in part to loss to follow-up before the 6-week visit and to lack of knowledge of maternal HIV status and thus infant risk. Infant immunization coverage exceeds 80% in many high HIV prevalence settings, and immunization visits may therefore provide valuable opportunities for HIV diagnosis among infants.16,17 In a previous analysis, we used the CEPAC-P microsimulation model to evaluate the cost-effectiveness of adding a screening strategy to determine HIV exposure to the currently WHO-recommended strategy of testing only known HIV-exposed infants. The microsimulation model analysis evaluated these strategies in Côte d’Ivoire, Zimbabwe, and South Africa. For this metamodeling analysis, we use the CEPAC-P results from South Africa as an example setting. 5 The incremental cost-effectiveness ratio in South Africa was $420/year of life saved (YLS), suggesting that screening to determine exposure would be cost-effective at willingness-to-pay (WTP) thresholds higher than $420/YLS.
CEPAC-P Model Strategies and Structure
The CEPAC-P model is a first-order, Monte Carlo simulation model of infant HIV acquisition, disease progression, diagnosis, and treatment.1–4 Using CEPAC-P, we simulated a “birth cohort” of all infants born in South Africa in a given year, composed of HIV-unexposed infants, HIV-exposed infants who do not acquire HIV, and infants with HIV. A virtual cohort of 30 million infants was simulated in order to achieve stable model output. We examined the two strategies mentioned in the previous section, more specifically: 1) current infant testing programs, using polymerase chain reaction (PCR)-based testing at 6 weeks of age for all infants born to mothers known to be living with HIV (EID); and 2) in addition to current EID programs, a novel program of screening mothers to determine infant exposure at immunization visits at 6 or 10 weeks of age (with an antibody-based rapid diagnostic test [RDT]), followed by PCR-based testing for infants identified as HIV-exposed (screen and test).
The structure of the CEPAC-P model has been described in detail in prior publications.2–4 Briefly, infants enter the model at birth and are at risk of having acquired or acquiring HIV during the mother’s pregnancy, delivery, or during breastfeeding. After an infection occurs, individuals transition monthly between health states, including chronic HIV infection, acute opportunistic infections (OIs), and death, with transition probabilities based on age, CD4% (age <5years) or CD4 cell count (age ≥5), retention in care or loss to follow-up, antiretroviral therapy (ART) use, and response to ART. The simulation ends when an individual dies from an HIV-related or non-HIV-related cause. Costs are calculated from the health care system perspective (here, in 2016 US$) and include the costs of routine HIV care, care for OIs, ART regimens, laboratory monitoring, and HIV screening and testing. 4 Costs and life-years are discounted at a rate of 3% annually. More information about the CEPAC-P model is available at https://www.massgeneral.org/medicine/mpec/research/cpac-model.
Metamodel Parameters
A metamodel, or model of the model, is a second model that simplifies the relationship between the inputs and outputs of a simulation model. 9 The CEPAC-P model includes hundreds of individual input parameters related to HIV natural history, peri- and postnatal transmission, HIV test characteristics, multiple treatment regimens, laboratory monitoring, and costs. To select input parameters for the metamodel and decision-support tool (i.e., the parameters that the lay user will be able to modify), we used three criteria. First, we included parameters to which cost-effectiveness results were sensitive in the original microsimulation model–based analyses for South Africa or which are known to affect all CEPAC-P model results.2,4,5 Second, we selected parameters that are likely to vary across settings in sub-Saharan Africa, in order to allow users of the decision-support tool to reflect programs in countries beyond South Africa. 5 Third, we selected parameters that were identified by policy makers during a regional workshop organized by the WHO in Johannesburg in June 2017. During this workshop, policy makers and program planners from 16 African countries provided key information about the local availability of the data parameters selected as inputs for the tool through the first two methods, and suggested additional parameters that would be helpful to make policy decisions. 18 Based on these considerations (i.e., impact on cost-effectiveness results, variability between countries, and relevance to policy makers), we selected 14 clinical/epidemiological parameters and 4 cost parameters for the metamodels (Table 1).
Metamodel Input Parameters, Descriptions, and Value Ranges a
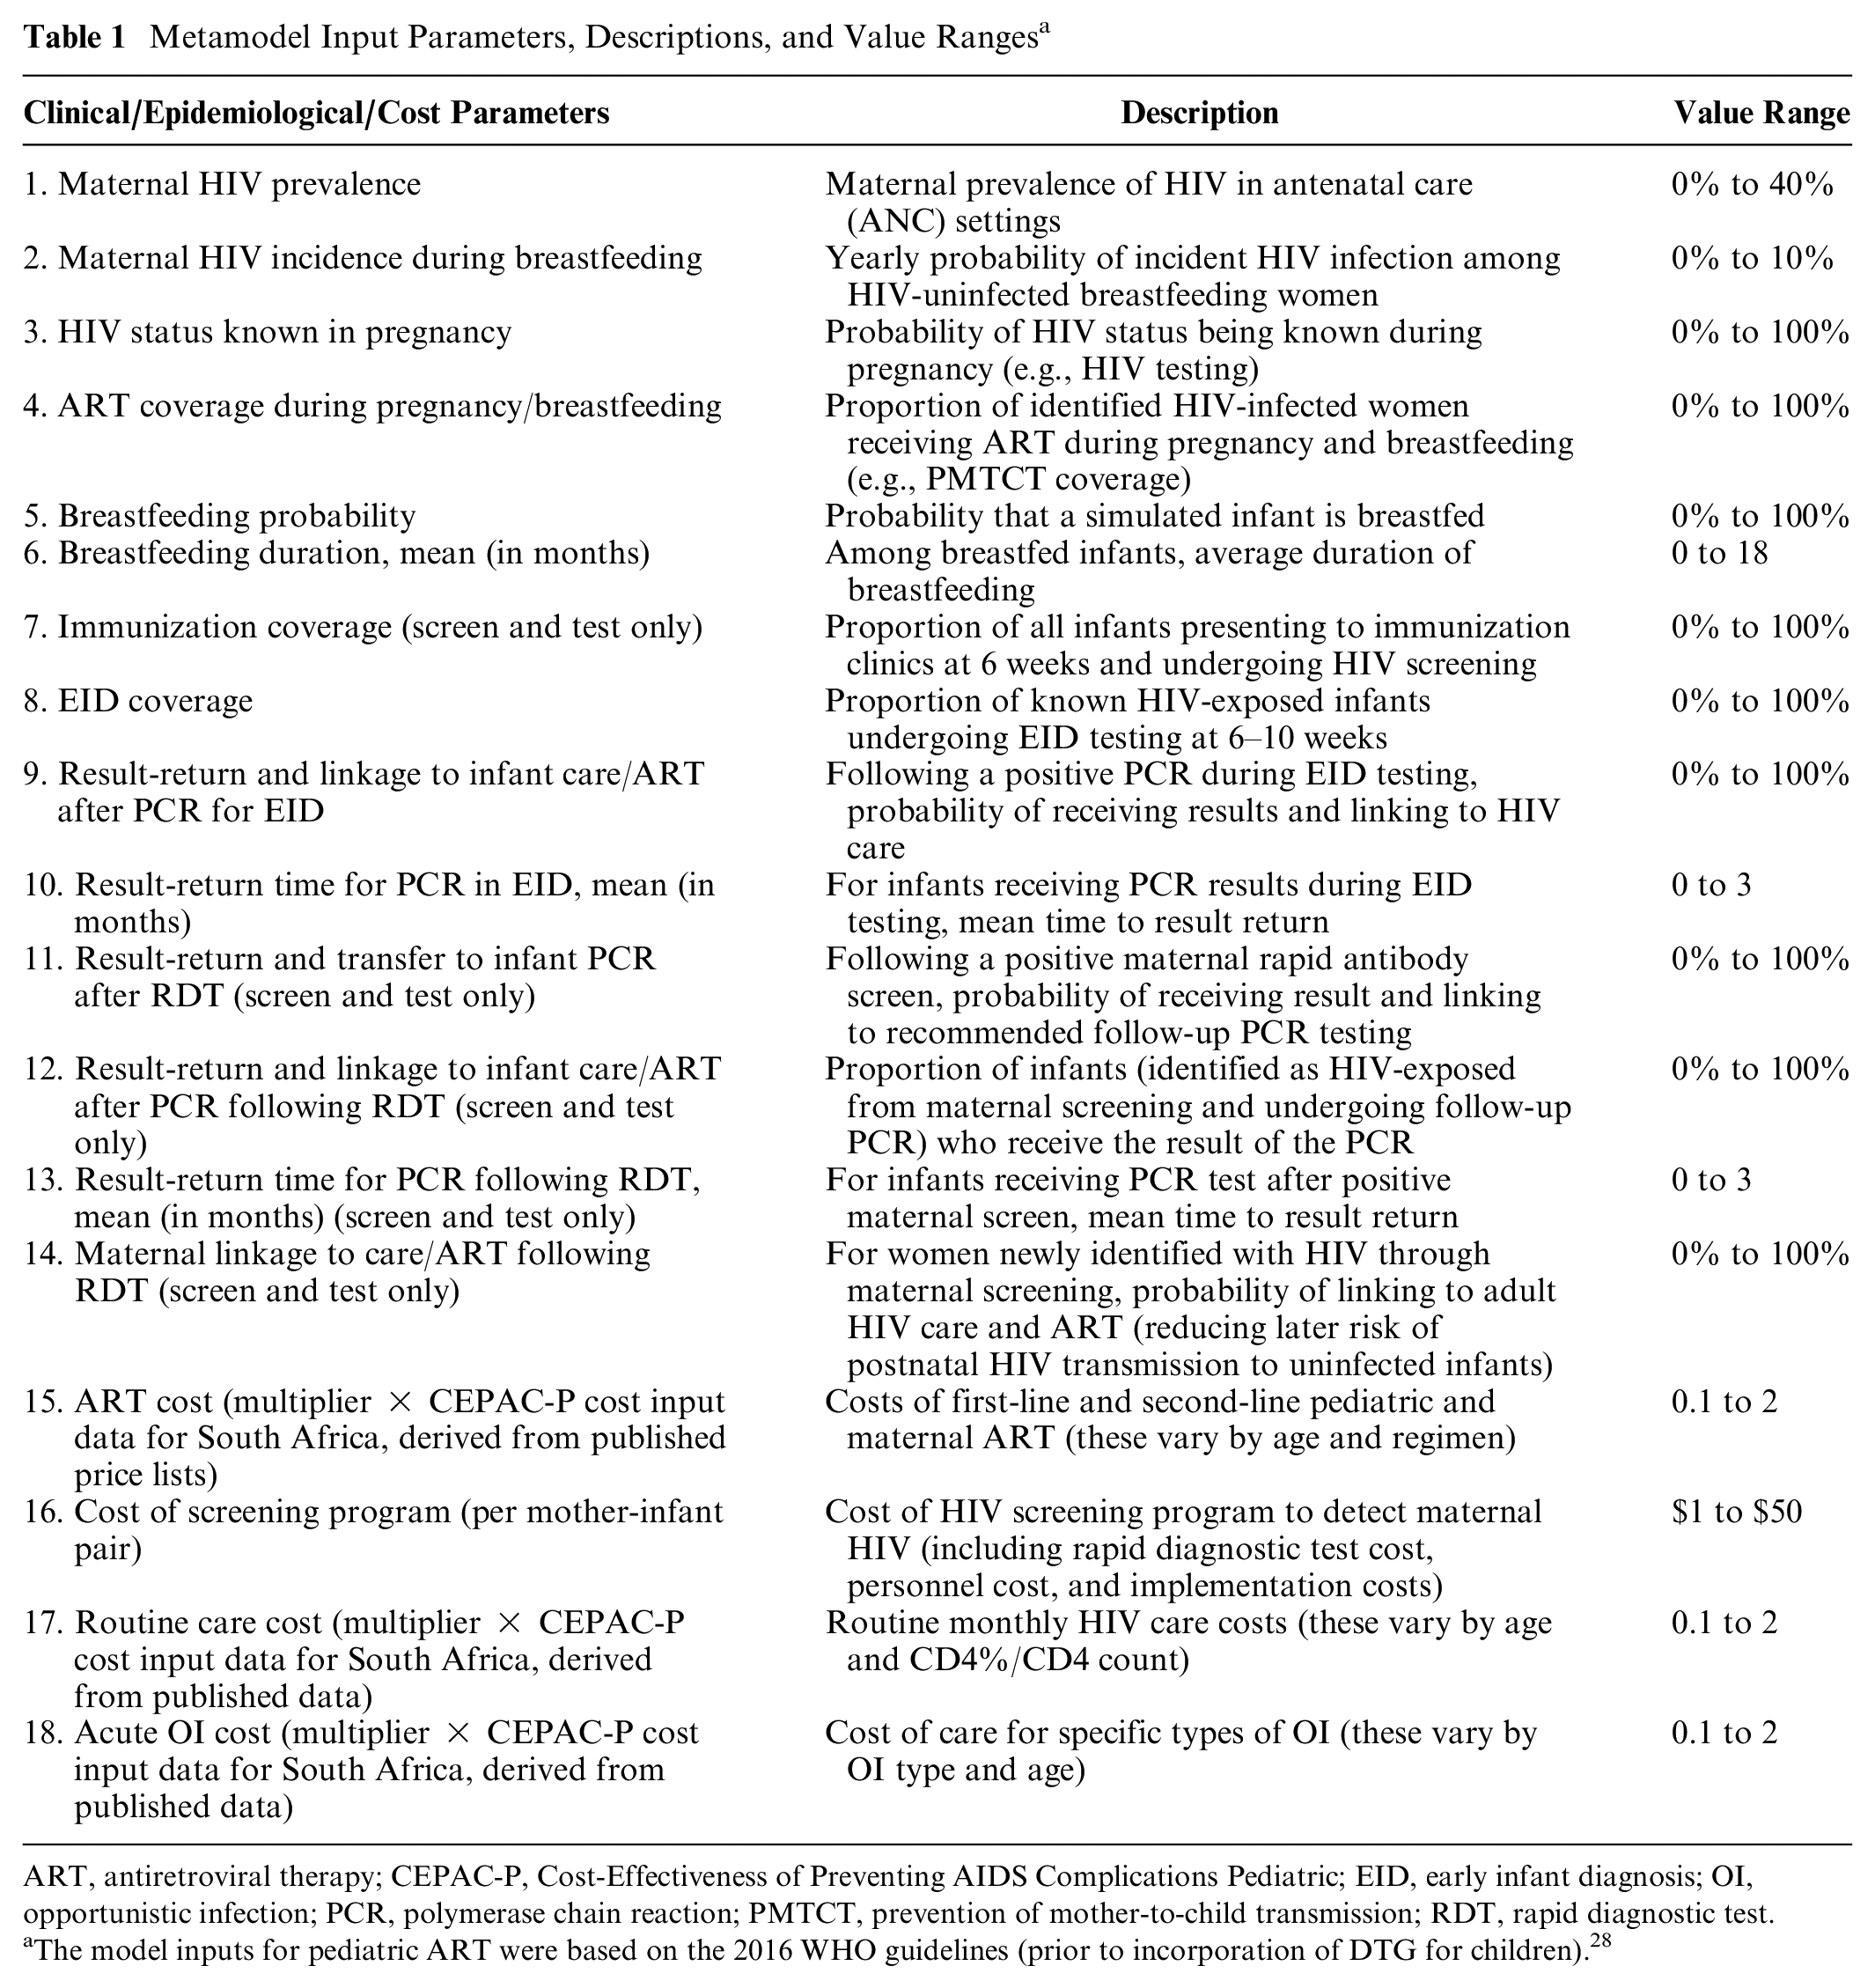
ART, antiretroviral therapy; CEPAC-P, Cost-Effectiveness of Preventing AIDS Complications Pediatric; EID, early infant diagnosis; OI, opportunistic infection; PCR, polymerase chain reaction; PMTCT, prevention of mother-to-child transmission; RDT, rapid diagnostic test.
The model inputs for pediatric ART were based on the 2016 WHO guidelines (prior to incorporation of DTG for children). 28
We fitted separate metamodels to each outcome: life expectancy and lifetime per-person HIV-related cost. From these outcomes, we calculated net health benefit (NHB). NHB expresses the cost-effectiveness of the programs by subtracting forgone health benefits due to the resources required by the intervention from the gain in health resulting from the intervention (NHB = health benefit − (cost/WTP for health)). For this analysis, we assumed a WTP for health of $547/YLS, which reflects the combined ICER of a package of services that the health sector was able to afford with the 2016 to 2018 HIV budget of about $1.6 billion per year in South Africa. 19 In the decision-support tool, the user is able to vary the WTP for health.
Generating Datasets of CEPAC-P Model Inputs and Outputs to Fit the Metamodels
We used Latin Hypercube Sampling (LHS) 20 in MATLAB 21 to generate the input parameter values for 5000 CEPAC-P model simulations. LHS is a method of stratified sampling that selects values randomly from the parameter space. The purpose is to cover a range of input values that the user may want to choose in the decision-support tool, indicating variability across settings and policies. The ranges considered are provided in Table 1.
Metamodel
We chose an ordinary least squares (OLS) regression for the metamodel, because it performed as well or better than more complex nonlinear metamodels in our preliminary analyses (Appendix A). Moreover, it is the simplest and most practical model compared to more advanced metamodeling techniques. 22 We evaluated the performance of OLS for both outcomes of life expectancy and cost. We fitted metamodels to both strategies (EID and screen and test), because some parameters are irrelevant for the EID strategy and, therefore, not included in the model (e.g., immunization coverage). OLS assumes a linear relationship between the model parameters and the outcomes. We added interaction terms to optimize model fit. All metamodels were developed in R software and the code is provided in Appendix B. 23
Metamodel Performance
For each strategy, we first tested the predictive validity of the metamodels for both outcomes (life expectancy and cost) using a cross-validation approach. 24 We randomly split the total number of simulations in half and developed two metamodels independently using each of these 2500 simulations (training datasets). Next, we used each metamodel to predict the outcomes using the dataset that was not used to generate that metamodel (validation datasets). For each metamodel, we compared the predicted outcome values with the original CEPAC-P model-generated results using the R2 statistic. The R2 statistic measures the proportion of variability in the model outcomes that can be explained by the input parameters. Generally, a large R2 value (e.g., close to 1) indicates that the model fits the data well. The metamodel was considered valid if the R2 statistic computed on the data that was used in model development (i.e., the training dataset) was similar to the R2 computed on the data that was not used to fit the models (i.e., the validation dataset). Friedman and Friedman, in their landmark paper on the validation of metamodels, visually compare the R2 values to indicate whether the R2s are similar enough to indicate that internal validity of the metamodel is sufficient and do not define any cutoff values. 24
For each strategy, we next assessed between-method agreement between the CEPAC-P model and the metamodels for the outcomes of life expectancy and cost, as well as for the resulting NHB, with Bland-Altman plots. 25 In the Bland-Altman plots, we plotted the differences between predicted CEPAC-P model outcome values obtained with the metamodel and the actual CEPAC-P model outcome values [(Ycepac−Ymetamodel)] against the mean of the two outcome values [(Ycepac+ Ymetamodel)/2]. The limits of agreement, represented by two dotted lines in the plot, provide an interval within which 95% of between-method differences in predicted outcomes are expected to fall and is estimated by µ± 1.96 * SD, where µ is the mean difference and SD is the standard deviation of the differences. The smaller the 95% limits of agreement, the closer the metamodel predictions resemble the observations as projected by the CEPAC-P model.
Finally, when comparing the two strategies (EID and screen and test), we determined the predictive validity, defined as the percentage of simulations in which the metamodels accurately predicted the strategy with the greatest CEPAC-P-projected NHB (i.e., the optimal strategy). We also calculated the mean and range of NHB losses from “wrong” decisions by the metamodels, representing forgone benefits in terms of health, if the metamodels were used in lieu of the CEPAC-P model for decision making.
In the CEPAC-P model analysis comparing EID and screen and test, a cohort of all infants born in a given year in South Africa was simulated. In that cohort, a minority of infants are HIV-exposed (base-case: 34%), and even fewer acquire HIV (6%). Therefore, the absolute difference between life expectancies in the two strategies was small, because the clinical benefits of screen and test for HIV-exposed infants were diluted by the large number of infants in the population who were HIV-unexposed and who did not benefit from that strategy. As a result, the differences in NHB between the two strategies were also small. Generally, the strategy with the greatest NHB is the economically optimal strategy, 26 but without substantial difference in cost-effectiveness, decisions can be made based on other factors such as programmatic feasibility. In comparing the metamodel-predicted and CEPAC-P-predicted optimal strategy, we therefore used a new approach, introducing a zone of indifference. In this approach, we had three possible scenarios: 1) EID could be indicated as the optimal strategy (EID’s NHB was greatest and the difference between the NHB’s of the two strategies was larger than the zone of indifference); 2) screen and test could be indicated as the optimal strategy (screen and test’s NHB was greatest and the difference between the NHB’s of the two strategies was larger than the zone of indifference); or 3) the difference in NHB between the two strategies represented too narrow a margin to generate a decision (the difference was smaller than the zone of indifference). We expanded the width of this indifference zone from 0 (base case analysis) to the width needed to produce between-method agreement on the optimal strategy or indifference between strategies in 95% of the simulations (i.e., an a priori determined arbitrary standard).
Results
Decision-Support Tool
The metamodels were embedded into an online decision-support tool, available with full documentation at the WHO website: https://www.who.int/publications-detail/paediatric-hiv-testing-strategy-decision-tool or directly via the link: https://mghcost-effectiveness.shinyapps.io/CEA_Q1_May12/. Figure 1 displays the design of the tool.

Screenshot of the decision-support tool in R Shiny.
Model Fit Using Cross-Validation
We show results for the EID strategy in Table 2. First, cross-validation showed that the R2 values computed on the training and validation datasets were high, indicating that OLS explain the variation in CEPAC-P-projected results well (Table 2). The R2 for life expectancy was slightly higher (R2 = 0.99 for both training and validation datasets) than for costs (R2 = 0.98 for both training and validation datasets).
Cross-Validation Results of Linear Regression Metamodels in Comparison With the CEPAC-P Model for the EID and Screen and Test Strategies a

EID, early infant diagnosis; CEPAC-P, Cost-Effectiveness of Preventing AIDS Complications Pediatric; OLS, ordinary least squares.
We conducted 5000 CEPAC-P model microsimulations. We divided these 5000 parameter sets into a training dataset (the 2500 simulations used in metamodel development) and a validation dataset (the 2500 simulations not used in metamodel development).
Agreement Between Metamodels and CEPAC-P Model
For both strategies, the Bland-Altman plots showed good agreement for life expectancy between the CEPAC-P model and the OLS regression metamodels (Figure 2). With EID, comparing the CEPAC-P model and metamodel (Figure 2a), the mean between-method difference in discounted life expectancy was −0.004 life-months. In 95% of the simulations, life expectancy as measured with the metamodel was within 1.01 life-months below or above the CEPAC-P model-generated value (95% limits of agreement: −1.01, 1.003 life-months). The limits of agreement of the between-method differences represented 0.3% of mean overall life expectancy. There was poorer agreement for lifetime HIV-related costs between the CEPAC-P model and the metamodel. With EID, comparing CEPAC-P and the metamodel, the mean between-method difference was $ 0.93 (95% limits of agreement: −$57, $59; Figure 2b). The limits of agreement represented a bigger proportion ( ∼ 20%) of mean overall lifetime costs compared to life expectancy.
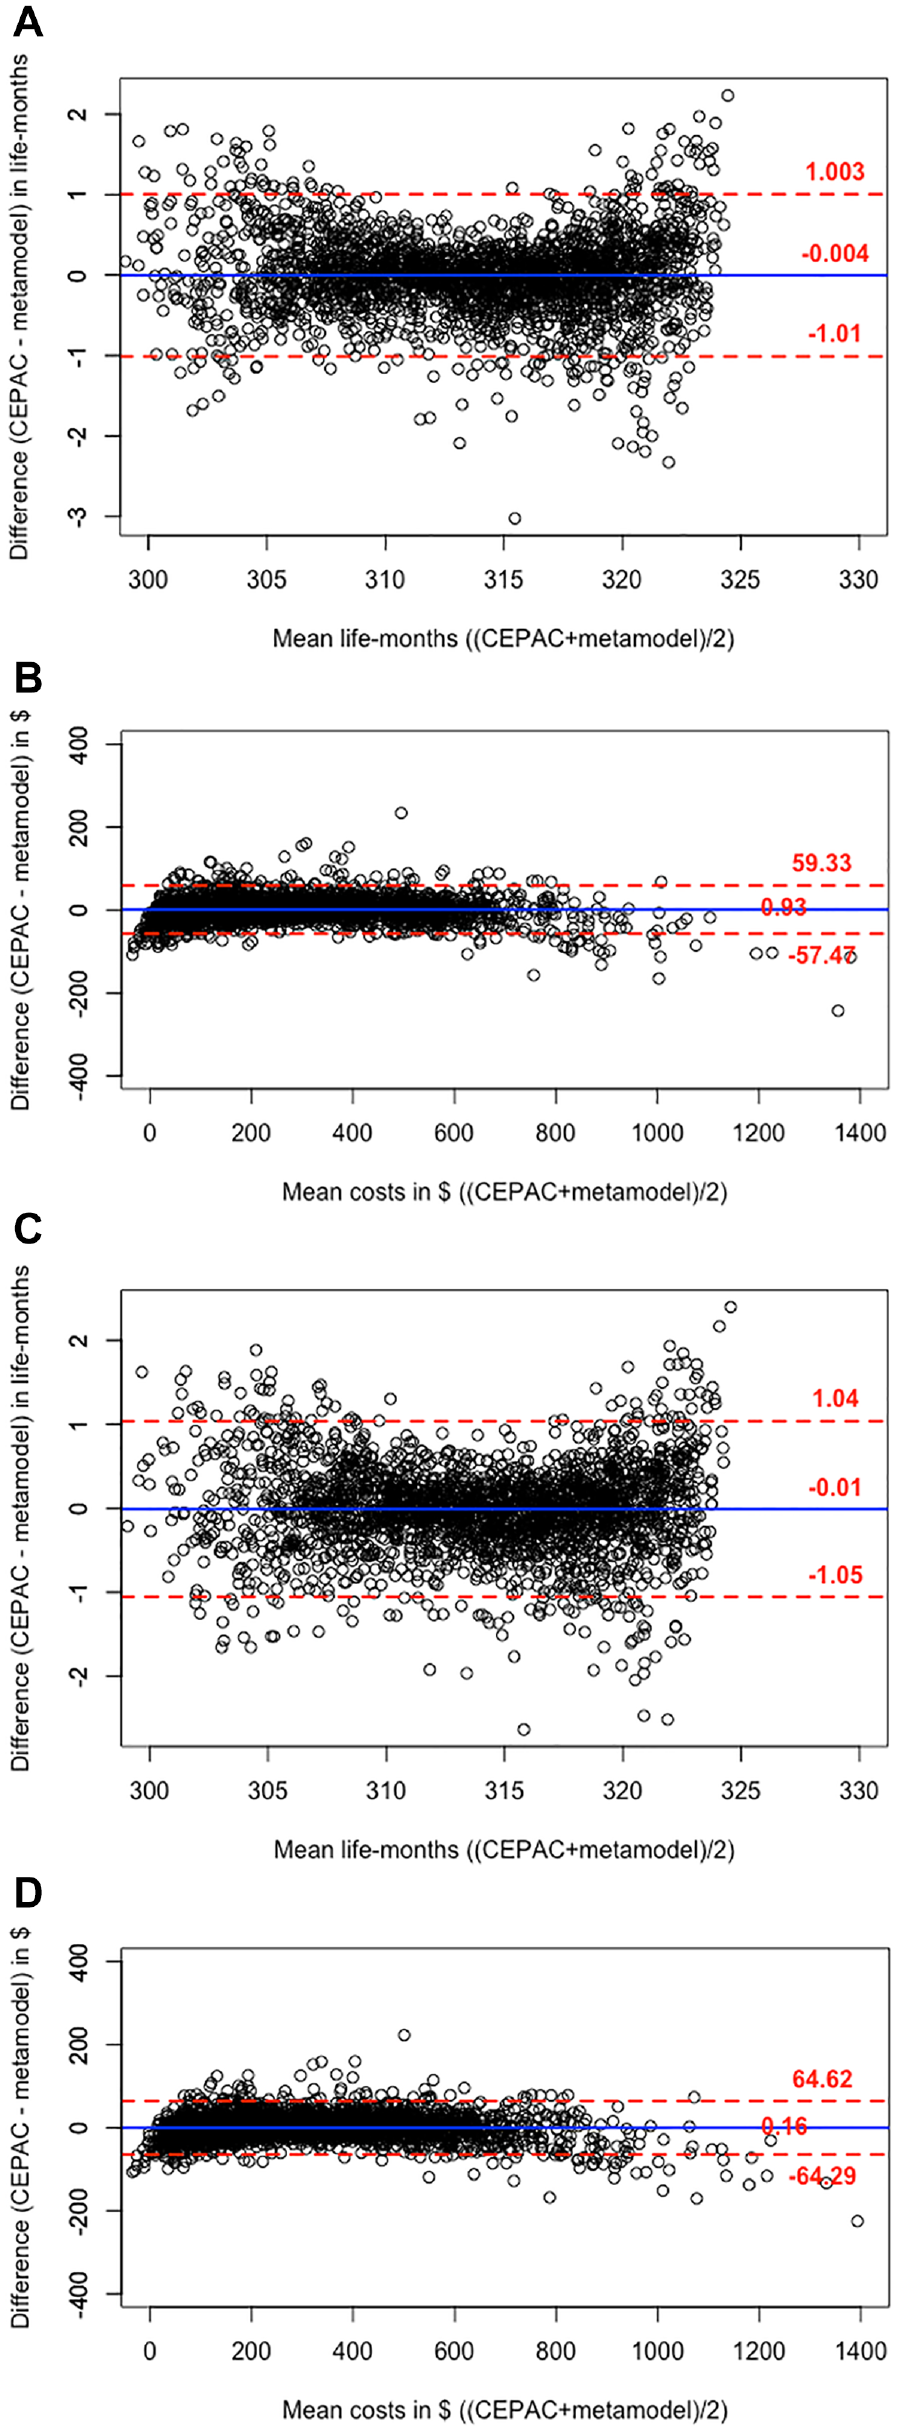
Bland-Altman plots comparing CEPAC-P model results with the results of the linear regression metamodels. Shows the comparison of the CEPAC-P microsimulation model results with results from the OLS metamodels for the EID and Screen and test strategies, using Bland-Altman plots. The vertical axis indicates the between-method difference in predicted outcomes in life-months (for life expectancy) or USD (for lifetime HIV-related per-person cost). The horizontal axis indicates the mean value of the CEPAC-P-projected and metamodel-generated outcomes for each set of parameter values. The solid line indicates the mean of the differences and the dotted lines indicate the limits of agreement within which 95% of the differences fall. The open circles indicate the results of 2500 comparisons. Comparisons are shown between CEPAC-P-generated life expectancy and the OLS metamodel for EID (panel a), CEPAC-P-generated cost and the OLS metamodel for EID (panel b), CEPAC-P-generated life expectancy and the OLS metamodel for screen and test (panel c), and CEPAC-P-generated cost and the OLS metamodel for screen and test (panel d).
The agreement between CEPAC-P and the metamodels was similar for the Screen and test strategy. For example, for life expectancy, there was a mean between-method difference of −0.01 life-months (95% limits of agreement: −1.05, 1.04 life-months; Figure 2c), and for costs, a mean between-method difference of $ 0.16 (95% limits of agreement: −$64, $65; Figure 2d).
Prediction of Optimal Strategy
Without a zone of indifference (i.e., requiring the selection of either EID or Screen and test to have the highest NHB and thus be “optimal”), the metamodels identified the same optimal strategy as CEPAC-P in 87.7% of the simulations. The mean loss in NHB in the instances where the metamodel chose the “wrong” strategy compared to CEPAC-P was very low at 0.018 (range: 0.0002–1.1) life-months.
With a zone of indifference, we calculated the proportion of all simulations in which the metamodel either selected the same optimal strategy as CEPAC-P or generated a result of “indifferent,” as a function of the defined width of the zone of indifference. The metamodel predicted the same optimal strategy or state of indifference between strategies as CEPAC-P in 95% of the simulations when we expanded the zone of indifference from 0 to 0.24 life-months ( ∼ 7 days).
Regression Coefficients
The regression coefficients of the metamodel input parameters for life expectancy and lifetime HIV-related costs for the EID and Screen and test strategies using the total dataset of 5000 simulations are displayed in Appendix C.
Discussion
We investigated the validity of linear regression metamodels to predict the results of a complex microsimulation model of infant HIV testing and screening strategies. Cross-validation results showed good predictive validity of this metamodeling technique. The R2 statistic was high for life expectancy (R2 = 0.99) and HIV-related costs (R2 = 0.98). Bland-Altman plots showed good agreement for the comparison between the metamodels and the CEPAC-P model for life expectancy (within 1.05 life-months difference), suggesting that an OLS metamodel predicts these CEPAC-P-generated outcomes reliably. For the outcome of HIV-related costs, 95% of the between-method differences were within $65. The slightly poorer agreement for costs, compared to life expectancy, could be attributed to the skewedness of the cost outcomes. However, when we compared the OLS metamodels to more advanced metamodeling techniques that take the nonnormal distribution of the cost outcome into account, such as generalized additive models, OLS with and without log transformation, and generalized linear models with gamma-family and log-link (Appendix A), OLS surprisingly offered the best predictive validity as compared with CEPAC-P. Thus, at least for this application, the linear regression metamodel provides an accurate, easy to use, and efficient proxy for the CEPAC-P simulation model upon which it is based.
The online decision-support tool (running the metamodels in the background) can be used to support decision makers who wish to understand the sensitivity of a decision to variations in assumptions about key population quantities. Using the tool in practice could potentially identify gaps in data availability on (or uncertainty in) key model parameters and the need to collect better estimates. We hope that this tool will help public health planners to allocate resources between testing strategies as efficiently as possible.
Despite the fact that the absolute difference in NHB between EID and Screen and test was very small in the original CEPAC-P model-based analysis, the metamodels identified the same optimal strategy as CEPAC-P 87.7% of the time. Moreover, the losses in health benefits due to “wrong” choices by the metamodel were very small (mean = 0.018 life-months; range: 0.0002–1.1 life-months), so that their consequences for decision-making can likely be ignored. When we designated a small difference in NHB of 0.24 life-months ( ∼ 7 days) or below as too narrow a margin to make a decision between strategies, the percentage of accurate predictions (i.e., both CEPAC-P and metamodels indicated EID optimal, Screen and test optimal or too small of a difference to generate a decision) increased to 95%. When the economic value of both strategies is considered similar, decisions can be made based on other factors such as programmatic feasibility. Alternatively, program planners could delay the decision and continue the currently implemented strategy until findings from the CEPAC-P model on their own clinical or programmatic settings become available.
In our original analysis, with the CEPAC-P model, the differences in NHB between the two strategies were very small, due to the fact that we modeled a birth cohort consisting of HIV-unexposed infants, HIV-exposed infants who do not acquire HIV, and infants with HIV. 5 In this population, only ∼ 6% of infants acquired HIV. The life expectancy gains and HIV-related costs due to EID and Screen and test were mainly accrued in this small portion of the modeled population and were thus diluted when we calculated aggregated NHB over the total modeled population, as is required to understand the value of a testing strategy which must reach both children with and without HIV. We expect that the ability of these metamodels to predict the same optimal strategy as the CEPAC-P model will increase when they are used in analyses in which the differences in NHB between the strategies are more pronounced, and thus the decision is more certain.
The OLS metamodels performed well in terms of predictive validity and between-methods level of agreement for life expectancy, and relatively well for lifetime HIV-related costs. Our aim was to use the metamodels to facilitate publicly available, online decision-support tools that allow users to provide their own input data to generate setting-specific results. Therefore, in addition to the accuracy of model predictions and level of agreement, we also consider the practicality of embedding the metamodels at the “back-end” of a decision-support tool. OLS yields a simple formula with regression coefficients that is transparent and can easily be used to calculate a predicted value for outcomes when a user enters setting-specific values for the input parameters of the metamodel. Additional considerations in building the tool are that we would like to present multiple clinical and economic outcomes, both short- and long-term, for this and other policy analyses. Regularly updating the metamodels with new evidence may be warranted. Therefore, only if OLS would not sufficiently predict the CEPAC-P-predicted outcomes would it justify turning to more advanced metamodeling techniques that would bring extra challenges in developing and maintaining the decision support tool.
The metamodel is limited to the policies, or health care strategies, that were simulated in the original microsimulation model analyses. Although changes in parameterization would allow the metamodel user to evaluate the same policies (EID and Screen and test) in different settings, the metamodel will not be able to evaluate an entirely novel policy, unless the policy is only defined by the parameters included in the metamodels. For example, including the parameter “age” in the metamodels, would allow the user to compare EID testing at a different age.
The major strength of this validation study is that in addition to R2 cross-validation, we used another approach that specifically focused on between-methods agreement of predicted outcomes (i.e., the Bland-Altman approach). We note that a high R2 statistic does not necessarily mean that the CEPAC-P model and the metamodel are in high agreement. 25 This concept is best illustrated for the outcome of lifetime HIV-related costs. The OLS metamodel shows a very high R2 of 0.98, but when we look at the level of agreement between the CEPAC-P model and the metamodel with Bland-Altman plots, moderate absolute differences in lifetime HIV-related costs (i.e., ∼ 20% of mean overall lifetime costs) suggest that it may not be acceptable to replace the former with the metamodel to predict costs. This is mainly due to several extreme outliers when the costs in the CEPAC-P simulation are close to zero. However, when evaluating NHB rather than just costs, the metamodel performed adequately, as demonstrated by predicting the same optimal strategy as the CEPAC-P model 88% of the time.
This study is subject to several limitations. First, the metamodels may only be generalizable to countries and local settings for which the values of the CEPAC-P model parameters not included in the metamodels are applicable. Although we have included the parameters in the metamodels that showed variation between countries and appeared sensitive to changing the outcomes in sensitivity analyses, additional metamodels may be needed for settings with parameter values that strongly deviate from the sub-Saharan African values for these additional parameters. Second, there is no clear consensus about the WTP for health in South Africa or most other countries. We used a WTP for health of $547/YLS. 19 This threshold value is relatively close to the incremental cost-effectiveness ratio of $420/YLS of screen and test compared to EID, which makes the decision to indicate screen and test as the optimal strategy relatively uncertain. Choosing a different WTP threshold would affect the percentage of accurate predictions by the metamodels. When the difference between the WTP for health and the incremental cost-effectiveness ratio of the two strategies is more pronounced, the decision will be more certain, and the percentage of accurate predictions will increase. In the decision tool, we allow the user to alter the WTP threshold to explore the impact on the clinical and cost-effectiveness outcomes. Finally, our conclusion that linear regression metamodels provide sufficient fit is specific for our policy comparison (EID v. Screen and test) using the CEPAC-P model as the gold standard. Further research using different policy comparisons and microsimulation models should go through a similar process of fitting different forms of metamodels, assess the fit, and choose the best-fitting metamodeling technique. However, it is not uncommon to successfully capture complex disease progression and processes in a “simple” linear regression model. For example, the Framingham coronary heart disease risk score is generated by one of the most commonly used clinical prediction models, which is based on a logistic regression analysis. 27
Despite these limitations, we conclude that metamodels can provide accurate support when instantaneous results to inform policy decisions are preferred. For this policy question, comparing EID with Screen and test using the CEPAC-P model, the linear regression metamodel offers sufficient predictive validity to identify the optimal testing strategy as compared with CEPAC-P. Moreover, metamodels can simulate different scenarios in real-time based on sets of input parameters that can be depicted in a widely accessible decision-support tool.
Supplemental Material
Figure1a_AppendixA.rjf_online_supp – Supplemental material for Developing and Validating Metamodels of a Microsimulation Model of Infant HIV Testing and Screening Strategies Used in a Decision Support Tool for Health Policy Makers
Supplemental material, Figure1a_AppendixA.rjf_online_supp for Developing and Validating Metamodels of a Microsimulation Model of Infant HIV Testing and Screening Strategies Used in a Decision Support Tool for Health Policy Makers by Djøra I. Soeteman, Stephen C. Resch, Hawre Jalal, Caitlin M. Dugdale, Martina Penazzato, Milton C. Weinstein, Andrew Phillips, Taige Hou, Elaine J. Abrams, Lorna Dunning, Marie-Louise Newell, Pamela P. Pei, Kenneth A. Freedberg, Rochelle P. Walensky and Andrea L. Ciaranello in MDM Policy & Practice
Supplemental Material
Figure1b_AppendixA.rjf_online_supp – Supplemental material for Developing and Validating Metamodels of a Microsimulation Model of Infant HIV Testing and Screening Strategies Used in a Decision Support Tool for Health Policy Makers
Supplemental material, Figure1b_AppendixA.rjf_online_supp for Developing and Validating Metamodels of a Microsimulation Model of Infant HIV Testing and Screening Strategies Used in a Decision Support Tool for Health Policy Makers by Djøra I. Soeteman, Stephen C. Resch, Hawre Jalal, Caitlin M. Dugdale, Martina Penazzato, Milton C. Weinstein, Andrew Phillips, Taige Hou, Elaine J. Abrams, Lorna Dunning, Marie-Louise Newell, Pamela P. Pei, Kenneth A. Freedberg, Rochelle P. Walensky and Andrea L. Ciaranello in MDM Policy & Practice
Supplemental Material
Figure1c_AppendixA.rjf_online_supp – Supplemental material for Developing and Validating Metamodels of a Microsimulation Model of Infant HIV Testing and Screening Strategies Used in a Decision Support Tool for Health Policy Makers
Supplemental material, Figure1c_AppendixA.rjf_online_supp for Developing and Validating Metamodels of a Microsimulation Model of Infant HIV Testing and Screening Strategies Used in a Decision Support Tool for Health Policy Makers by Djøra I. Soeteman, Stephen C. Resch, Hawre Jalal, Caitlin M. Dugdale, Martina Penazzato, Milton C. Weinstein, Andrew Phillips, Taige Hou, Elaine J. Abrams, Lorna Dunning, Marie-Louise Newell, Pamela P. Pei, Kenneth A. Freedberg, Rochelle P. Walensky and Andrea L. Ciaranello in MDM Policy & Practice
Supplemental Material
Figure1d_AppendixA.rjf_online_supp – Supplemental material for Developing and Validating Metamodels of a Microsimulation Model of Infant HIV Testing and Screening Strategies Used in a Decision Support Tool for Health Policy Makers
Supplemental material, Figure1d_AppendixA.rjf_online_supp for Developing and Validating Metamodels of a Microsimulation Model of Infant HIV Testing and Screening Strategies Used in a Decision Support Tool for Health Policy Makers by Djøra I. Soeteman, Stephen C. Resch, Hawre Jalal, Caitlin M. Dugdale, Martina Penazzato, Milton C. Weinstein, Andrew Phillips, Taige Hou, Elaine J. Abrams, Lorna Dunning, Marie-Louise Newell, Pamela P. Pei, Kenneth A. Freedberg, Rochelle P. Walensky and Andrea L. Ciaranello in MDM Policy & Practice
Supplemental Material
METAMODELING_05.07_clean.rjf_appendix_a_online_supp – Supplemental material for Developing and Validating Metamodels of a Microsimulation Model of Infant HIV Testing and Screening Strategies Used in a Decision Support Tool for Health Policy Makers
Supplemental material, METAMODELING_05.07_clean.rjf_appendix_a_online_supp for Developing and Validating Metamodels of a Microsimulation Model of Infant HIV Testing and Screening Strategies Used in a Decision Support Tool for Health Policy Makers by Djøra I. Soeteman, Stephen C. Resch, Hawre Jalal, Caitlin M. Dugdale, Martina Penazzato, Milton C. Weinstein, Andrew Phillips, Taige Hou, Elaine J. Abrams, Lorna Dunning, Marie-Louise Newell, Pamela P. Pei, Kenneth A. Freedberg, Rochelle P. Walensky and Andrea L. Ciaranello in MDM Policy & Practice
Supplemental Material
METAMODELING_05.07_clean.rjf_appendix_b_online_supp – Supplemental material for Developing and Validating Metamodels of a Microsimulation Model of Infant HIV Testing and Screening Strategies Used in a Decision Support Tool for Health Policy Makers
Supplemental material, METAMODELING_05.07_clean.rjf_appendix_b_online_supp for Developing and Validating Metamodels of a Microsimulation Model of Infant HIV Testing and Screening Strategies Used in a Decision Support Tool for Health Policy Makers by Djøra I. Soeteman, Stephen C. Resch, Hawre Jalal, Caitlin M. Dugdale, Martina Penazzato, Milton C. Weinstein, Andrew Phillips, Taige Hou, Elaine J. Abrams, Lorna Dunning, Marie-Louise Newell, Pamela P. Pei, Kenneth A. Freedberg, Rochelle P. Walensky and Andrea L. Ciaranello in MDM Policy & Practice
Supplemental Material
METAMODELING_05.07_clean.rjf_appendix_c_online_supp – Supplemental material for Developing and Validating Metamodels of a Microsimulation Model of Infant HIV Testing and Screening Strategies Used in a Decision Support Tool for Health Policy Makers
Supplemental material, METAMODELING_05.07_clean.rjf_appendix_c_online_supp for Developing and Validating Metamodels of a Microsimulation Model of Infant HIV Testing and Screening Strategies Used in a Decision Support Tool for Health Policy Makers by Djøra I. Soeteman, Stephen C. Resch, Hawre Jalal, Caitlin M. Dugdale, Martina Penazzato, Milton C. Weinstein, Andrew Phillips, Taige Hou, Elaine J. Abrams, Lorna Dunning, Marie-Louise Newell, Pamela P. Pei, Kenneth A. Freedberg, Rochelle P. Walensky and Andrea L. Ciaranello in MDM Policy & Practice
Footnotes
Acknowledgements
We thank George Siberry, MD, for his expertise during the course of this research and comments that greatly improved the article.
The author(s) declared no potential conflicts of interest with respect to the research, authorship, and/or publication of this article.
The author(s) disclosed receipt of the following financial support for the research, authorship, and/or publication of this article: This work was funded by the World Health Organization. Additional support for model development was provided by the Elizabeth Glaser Pediatric AIDS Foundation, the Eunice Kennedy Shriver National Institute of Child Health and Human Development (R01HD079214), the National Institute of Allergy and Infectious Diseases (R37AI058736, R37AI093269, T32AI007433), and the Steve and Deborah Gorlin Massachusetts General Hospital (MGH) Research Scholars Award (RPW). The content is solely the responsibility of the authors and does not necessarily represent the official views of the World Health Organization, the Elizabeth Glaser Pediatric AIDS Foundation, the National Institutes of Health, or the Massachusetts General Hospital Executive Committee on Research.
References
Supplementary Material
Please find the following supplemental material available below.
For Open Access articles published under a Creative Commons License, all supplemental material carries the same license as the article it is associated with.
For non-Open Access articles published, all supplemental material carries a non-exclusive license, and permission requests for re-use of supplemental material or any part of supplemental material shall be sent directly to the copyright owner as specified in the copyright notice associated with the article.