
Abstract
Background
The unrelated mean effects (UME) model has been proposed for evaluating the consistency assumption globally in the network of interventions. However, the UME model does not accommodate multiarm trials properly and omits comparisons between nonbaseline interventions in the multiarm trials not investigated in 2-arm trials.
Methods
We proposed a refinement of the UME model that tackles the limitations mentioned above. We also accompanied the scatterplots on the posterior mean deviance contributions of the trial arms under the network meta-analysis (NMA) and UME models with Bland-Altman plots to detect outlying trials contributing to poor model fit. We applied the refined and original UME models to 2 networks with multiarm trials.
Results
The original UME model omitted more than 20% of the observed comparisons in both networks. The thorough inspection of the individual data points’ deviance contribution using complementary plots in conjunction with the measures of model fit and the estimated between-trial variance indicated that the refined and original UME models revealed possible inconsistency in both examples.
Conclusions
The refined UME model allows proper accommodation of the multiarm trials and visualization of all observed evidence in complex networks of interventions. Furthermore, considering several complementary plots to investigate deviance helps draw informed conclusions on the possibility of global inconsistency in the network.
Highlights
We have refined the unrelated mean effects (UME) model to incorporate multiarm trials properly and to estimate all observed comparisons in complex networks of interventions.
Forest plots with posterior summaries of all observed comparisons under the network meta-analysis and refined UME model can uncover the consequences of potential inconsistency in the network.
Using complementary plots to investigate the individual data points’ deviance contribution in conjunction with model fit measures and estimated heterogeneity aid in detecting possible inconsistency.
Systematic reviews with network meta-analysis (NMA) have been at the forefront of evidence-based medicine over the past 2 decades. 1 The explosive rate of published systematic reviews with NMA from several health care fields and a recent comprehensive review on the methodological advances of NMA attest to the reception of this evidence synthesis design from the wide research community.1,2 NMA has the advantage of providing a hierarchy of interventions for a specific research question to assist the end users of systematic reviews in selecting the best intervention for a condition. The intervention hierarchy results from modeling direct evidence from the relevant clinical trials and indirect evidence for interventions never compared in any clinical trial simultaneously. Consequently, NMA provides coherent evidence for all possible comparisons of interventions under the investigated outcome. 3
The credibility of the results from NMA strongly depends on the validity of the consistency assumption that underlies this evidence synthesis tool. The consistency assumption dictates the agreement of direct and indirect evidence for any pairwise comparison in a closed loop of interventions (i.e., a path that starts and ends with the same intervention). 4 The evaluation of the consistency assumption includes methods for local and global detection of possible inconsistency.2,5 The local evaluation is the most prevalent in the published systematic reviews.6,7 Among the methods for global evaluation, the unrelated mean effects (UME) model, introduced by Dias et al., 5 is the most frequently applied. 6 The UME model is particularly useful in complex networks, in which the implementation of several statistical tests of inconsistency, such as the loop-specific approach, 8 may become cumbersome, challenging when loops are also informed by multiarm trials and prone to multiplicity issues.
A global evaluation using the UME model is achieved by comparing the Bayesian NMA model with the Bayesian UME model using measures of model fit, 5 such as the deviance information criterion (DIC). 9 The model with the smaller DIC value by 3 or 5 units may be preferred regarding model fit and complexity. 10 If the UME model fits the data better, this is evidence of possible inconsistency in the network. 5 A scatterplot of the posterior mean deviance of the individual data points under the UME model against the NMA model can reveal the trials with a higher than expected posterior mean deviance. 5 These trials may help identify the loops with possible evidence of inconsistency. 5
Furthermore, the inspection of the between-trial variance for substantial reductions also offers valuable information on the suitability of the contrasted models. Suppose the between-trial variance estimated from a model such as the UME that does not incorporate the consistency assumption is substantially lower than that estimated from the NMA model. This implies that the estimated between-trial variance had to increase for the NMA model to fit well given the lack of consistent effects, thus suggesting potential inconsistency.
The presence of multiarm trials in the network may challenge the application of the UME model. Suppose a comparison is informed by a multiarm trial alone. In that case, selecting a different baseline intervention for that trial may omit this comparison from the estimation process. 11 This was the case with the network of thrombolytic treatments that Dias et al. 5 considered to illustrate the UME model (figure 3 in Ref 5). A closed-loop of 3 interventions (SK, SK plus t-PA, and Acc t-PA) was informed by a multiarm trial and a 2-arm trial for 1 of the comparisons (SK versus SK plus t-PA). Of the 16 observed comparisons, the UME model estimated 15 treatment effects, inevitably omitting 1 of the comparisons in the multiarm trial (SK plus t-PA versus Acc t-PA). Considering a different baseline intervention for this trial (e.g., SK plus t-PA) would have resulted in the omission of a different comparison (in that case, SK versus Acc t-PA).
The omitted comparisons in the multiarm trials may carry evidence of possible design inconsistency in the network. The design inconsistency indicates disagreement in the treatment effects across different designs (i.e., 2-arm and multiarm trials) for the same comparison. Design inconsistency can be formally investigated using the design-by-treatment interaction model.12,13 Contrasting the NMA model with the UME model regarding the treatment effect of all observed comparisons in the network offers an informal, exploratory investigation of the design inconsistency.
We aimed to propose a straightforward refinement of the UME model that accommodates the multiarm trials properly and yields treatment effects for all observed comparisons in networks with multiarm trials. Therefore, the proposed refinement allows the scrutiny of all observed evidence in the network to draw informed conclusions about the possibility of consistency. The article has the following structure. We first introduce 2 published systematic reviews with NMA as motivating examples. Then we present the Bayesian random-effects NMA and UME models—the latter as proposed by Dias et al. 5 (called the UME-Dias model). We follow by proposing a straightforward refinement of the Bayesian random-effects UME model (called the refined UME model). We demonstrate the refined UME model using the motivating examples. Finally, we conclude with a discussion of the results, strengths, and limitations of the proposed refinement in complex networks with multiarm trials.
Motivating Examples
We considered 2 motivating examples: 1) the network of antimanic drugs for the mean change on mania rating scales, 14 and 2) the network of pharmacologic interventions for the exacerbation of chronic obstructive pulmonary disease (COPD). 15 Both networks included multiarm trials. The corresponding articles analyzed these networks in the standardized mean difference (SMD) and log odds ratio (OR) scales. Both outcomes were harmful; therefore, a negative SMD or log OR favored the first intervention in the comparison, and a positive SMD or log OR favored the second intervention. There was information on the number of missing (participant) outcome data in each arm of every trial for both networks. We excluded the missing outcome data from the analysis for illustrative purposes. Namely, we subtracted the number of missing outcome data from the number randomized in each arm of every trial. Methods to properly account for aggregate missing outcome data in NMA have been described elsewhere.16,17
Methods
Random-Effects NMA Model with Multiarm Trials
For a network of

where
For a continuous outcome, we extract the mean outcome,

where

with
Under the random-effects model,
Likewise, in a multiarm trial
By assuming a common
Random-Effects UME Model of Dias and Colleagues
Contrary to the NMA model, the UME-Dias model does not pose consistency equations. Therefore, the UME-Dias model comprises separate random-effects pairwise meta-analyses for the observed comparisons.
5
The random-effects UME-Dias model also considers a shared between-trial variance across the observed comparisons to borrow strength from comparisons with many trials.5,11 Hence, the estimation of between-trial variance is greatly improved.
19
Suppose the network includes a total of
In the absence of multiarm trials, the UME-Dias model estimates the treatment effects of all observed comparisons. When the network includes multiarm trials, the UME-Dias model estimates the same vector

By making it similar to fitting separate pairwise meta-analyses to the data, the random-effects UME-Dias model retains its simplicity.
11
However, of the
Refined Random-Effects UME Model
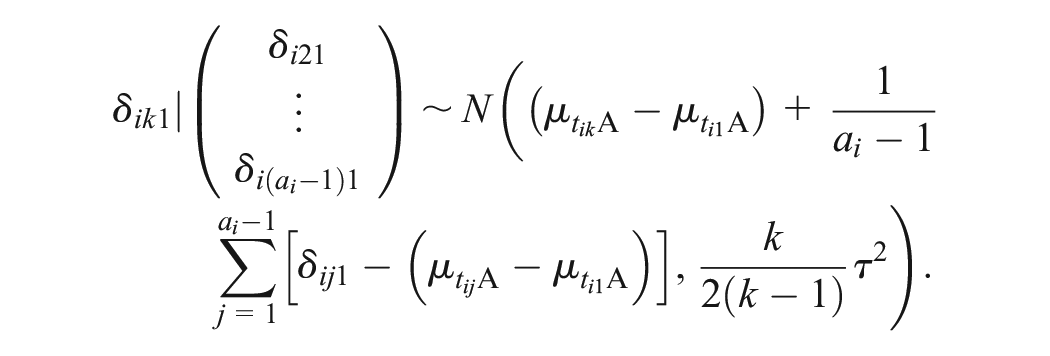
The UME-Dias model does not properly accommodate the multiarm trials. The random effects are inherently correlated in multiarm trials. Hence, as a matter of principle, the conditional univariate normal distributions of the random effects for the multiarm trials (equation (11) in Dias et al. 10 ) should be maintained in the UME model. Dias et al. 11 also suggested accounting for the correlated effects in the multiarm trials; however, the authors did not formally implement this model in their book.
In our proposed refinement of the UME-Dias model, we have maintained the conditional univariate normal distributions of the random effects for the multiarm trials. We have also developed an algorithm to automatically detect pairwise comparisons in the multiarm trials that the UME-Dias model would omit. When there is at least 1 omitted comparison, we perform another random-effects NMA in the subset of multiarm trials, and we use the consistency equation to obtain the summary treatment effect of the omitted comparisons. When the subset of multiarm trials forms subnetworks rather than a fully connected network, we perform random-effects NMA with consistency equations in each subnetwork separately. To prevent the multiarm trials from contributing twice to the estimation of
In the absence of multiarm trials, the refined UME model boils down to the UME-Dias model. In the presence of multiarm trials, comparisons can also be omitted when the fixed-effect model is considered. 5 In that case, the weighting approach proposed by Rücker and Schwarzer 20 can be used to prevent comparison omission. Dias et al. 11 discussed this weighting approach for the fixed-effect UME-Dias model in a Bayesian context.
Model Implementation
For each network, we applied Bayesian random-effects NMA, the refined UME model, and the UME-Dias model.
5
We considered a normal prior distribution with zero mean and variance 10,000 for the location parameters of the models, and we assigned a half-normal prior distribution with scale parameter 1 on
We tabulated the posterior median and posterior standard deviation of
Results
Network of Antimanic Drugs
Figure 1A illustrates the network of 13 antimanic drugs and placebo. There were 17 (27%) 3-arm trials in the network. Of the 33 (36%) observed comparisons, 7 (21%) were informed solely by at least 1 multiarm trial and contained no baseline intervention. The UME-Dias model omitted these comparisons. The maximum value of
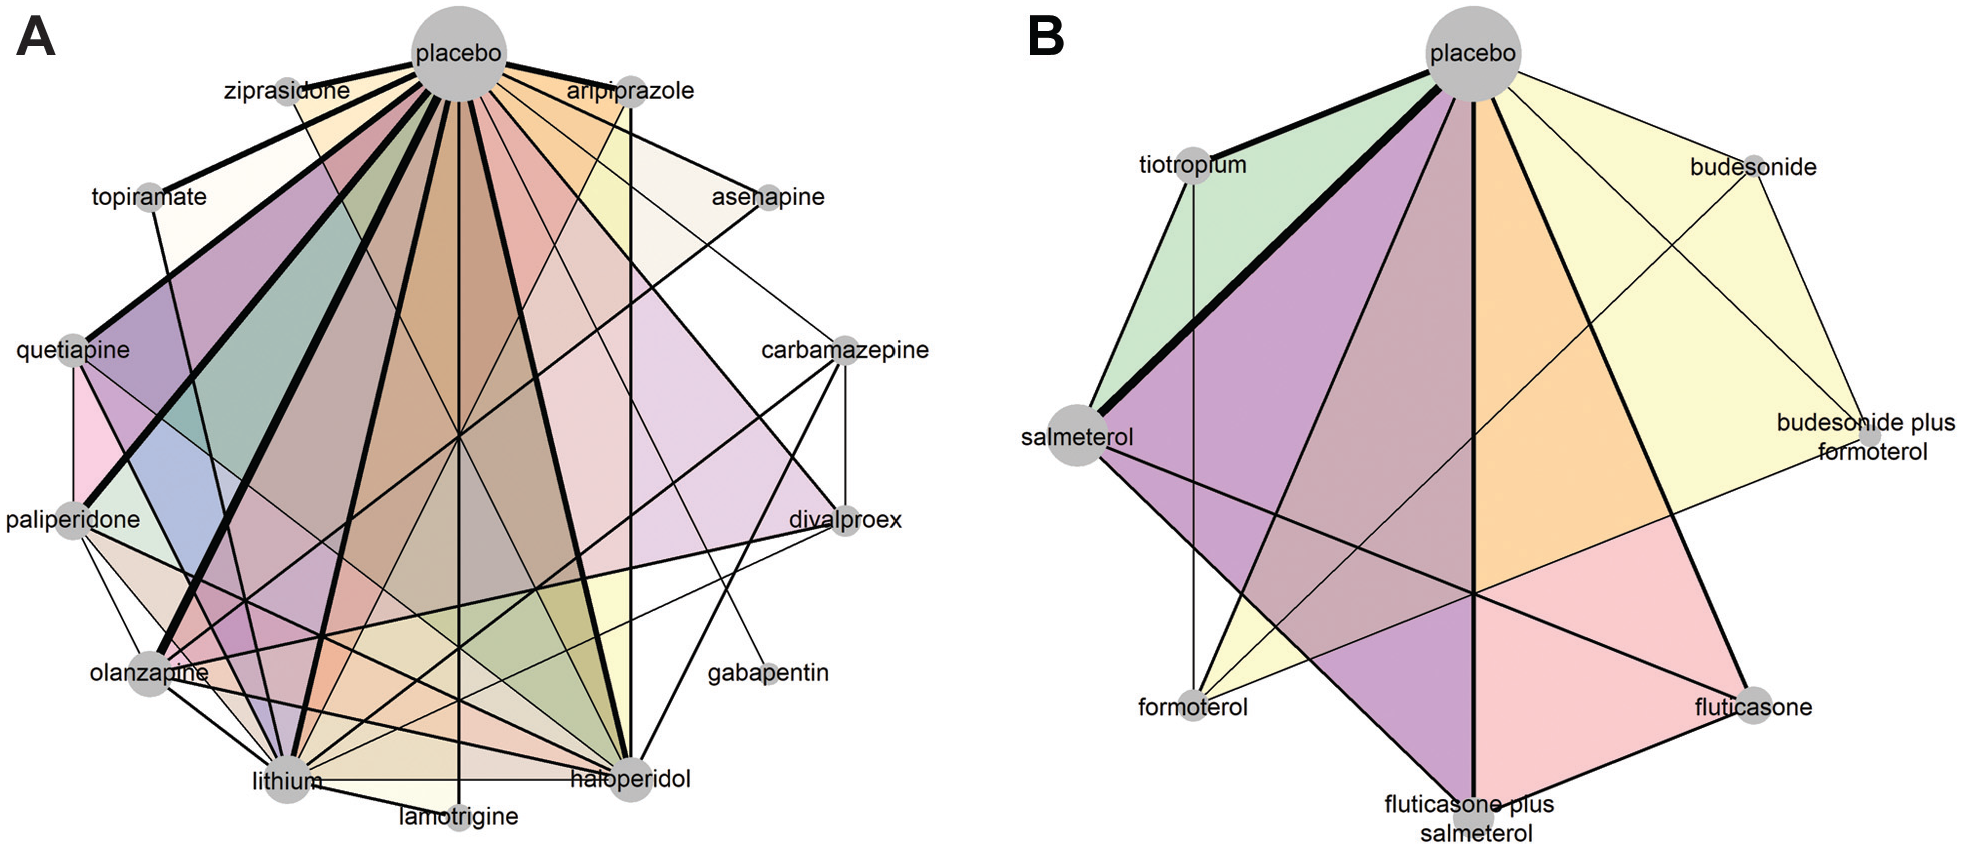
The network of antimanic drugs for the mean change on mania rating scales 14 (plot A). The network of pharmacologic interventions for exacerbating chronic obstructive pulmonary disease 15 (plot B). Each node refers to an intervention, and each link refers to a pairwise comparison. The size of the nodes is proportional to the number of observed comparisons that include that node. The thickness of the edge is proportional to the number of trials that investigated that comparison. The colored intervention loops indicate multiarm trials.
Measures of Model Assessment for the NMA and UME Models
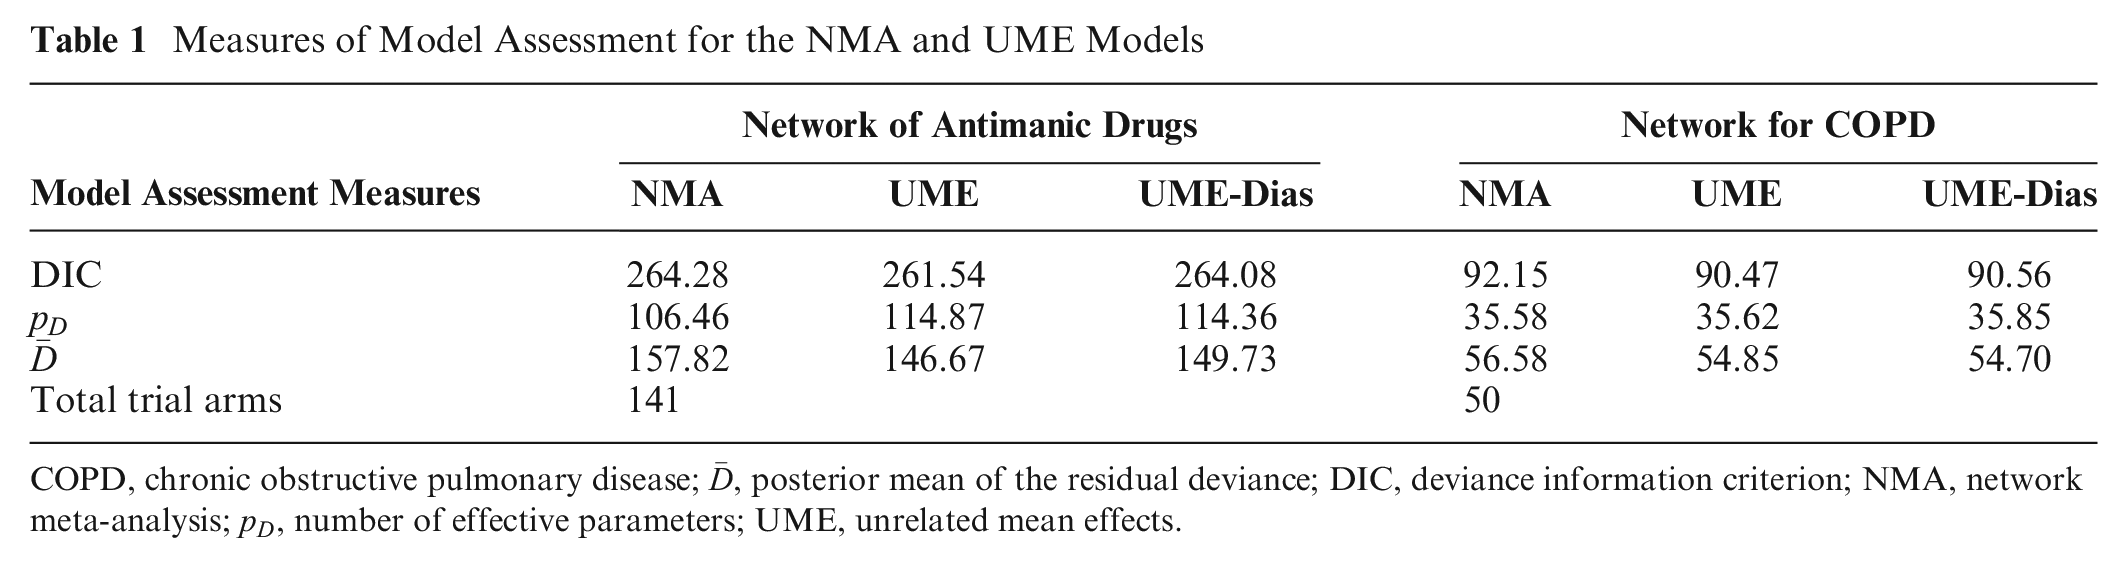
COPD, chronic obstructive pulmonary disease;
Estimated between-Trial Standard Deviation (
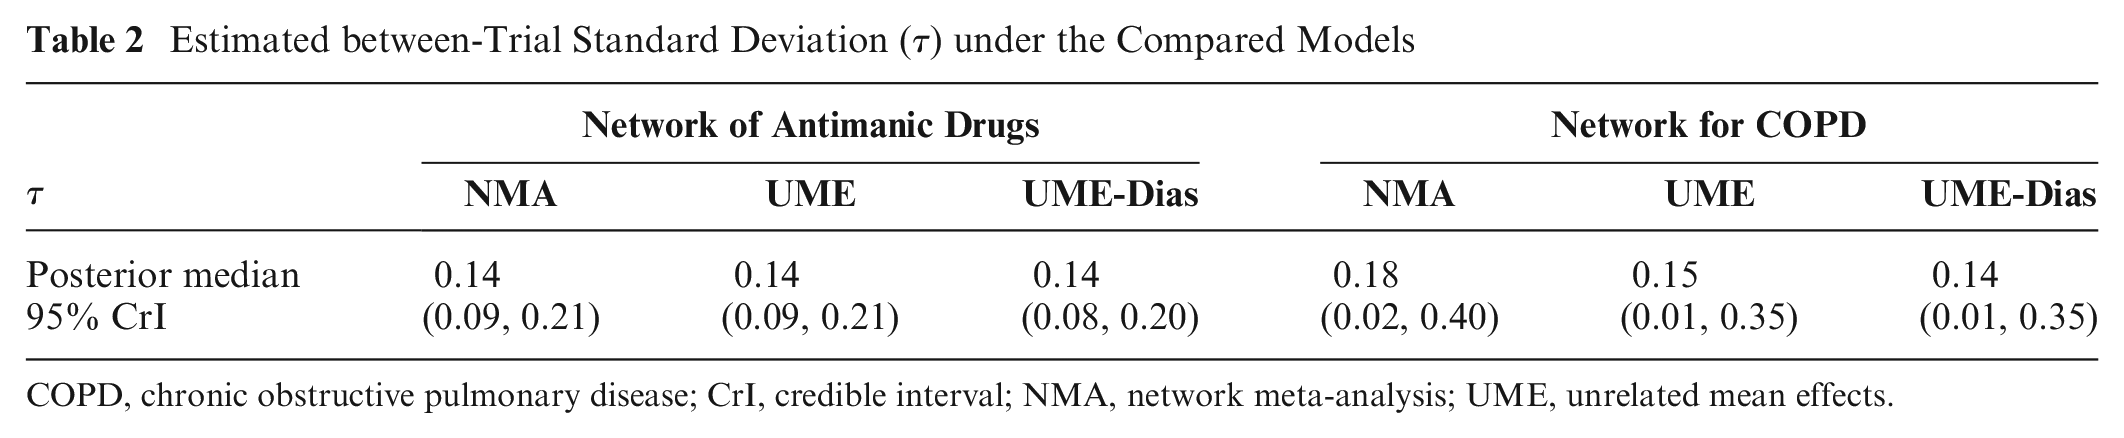
COPD, chronic obstructive pulmonary disease; CrI, credible interval; NMA, network meta-analysis; UME, unrelated mean effects.
Overall, including the consistency equations yielded similar posterior mean deviance contributions of the trial arms with discounting these equations and almost identical deviance contributions for both UME models (Figure 2A). An exception was 7 trial arms associated with larger deviance under the NMA model compared with the UME models that greatly exceeded the expected deviance contribution equal to 1. Of those trial arms, the arms of the 40th trial yielded a remarkably large posterior mean deviance contribution under all models.
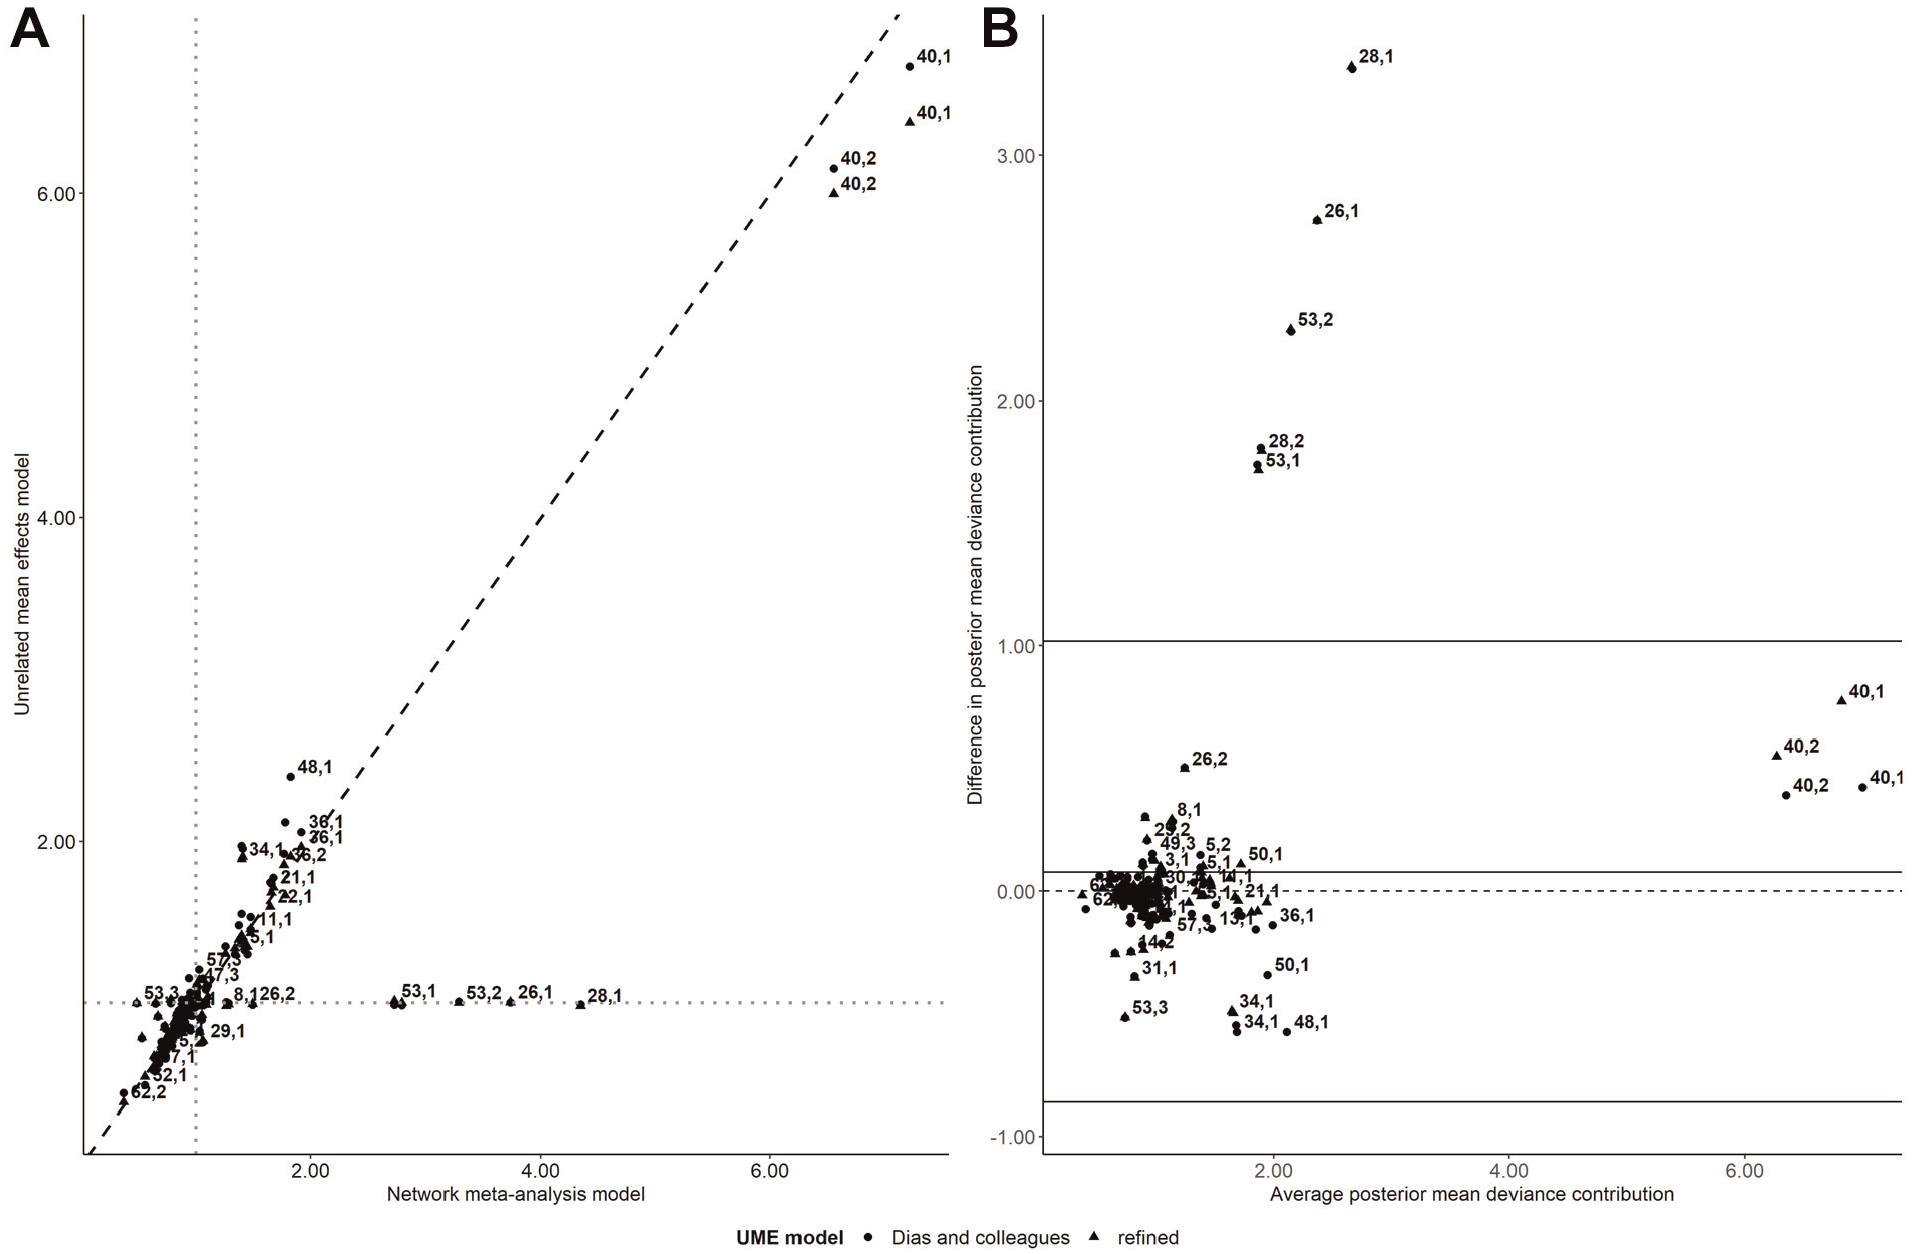
Scatterplot on the posterior mean deviance contributions of the trial arms under the unrelated mean effects (UME) models (refined and Dias and colleagues; y axis) and the network meta-analysis (NMA) model (x axis) for the network of antimanic drugs (plot A). The gray dotted lines refer to 1 posterior mean deviance contribution. The Bland-Altman plot on the difference in the posterior mean deviance contributions between the NMA and the UME models (refined and Dias and colleagues) against the average posterior mean deviance contributions of the compared models (plot B). Each data point corresponds to a trial arm, indicated by a pair of numbers. The first number refers to the trial ID, and the second number refers to the trial’s arm, as placed in the analyzed data set (Supplementary Table S1).
In the Bland-Altman plot, the bias was slightly positive, indicating a tendency for the NMA model to yield slightly larger posterior mean deviance contributions on average than the refined UME model (Figure 2B). The trial arms associated with larger deviance under the NMA model were found outside the upper limit of agreements. These trial arms contributed 1 posterior mean deviance under the UME models (Figure 2A). Two of these points referred to 2-arm trials that were the sole contributors in divalproex versus carbamazepine (the 28th trial) and lithium versus divalproex (the 26th trial; Supplementary Table S1 in Supplementary Material 2). The remaining outlying points referred to haloperidol and lithium compared only in the multiarm trial (the 53rd trial), which included the omitted comparison of paliperidone versus lithium (Supplementary Table S1 in Supplementary Material 2). Supplementary Figure S1 (in Supplementary Material 2) located trials 28, 26, and 53 outside the red parabola (i.e.,
Overall, there were similar posterior estimates and sufficient overlapping in the 95% CrIs of SMD for the NMA and either UME model except for the comparisons of divalproex versus carbamazepine and of lithium versus divalproex and haloperidol (Figure 3). These comparisons corresponded to trials that contributed to the poor fit of the NMA model (Figure 2; Supplementary Figure S1), thus signaling possible inconsistency in the network
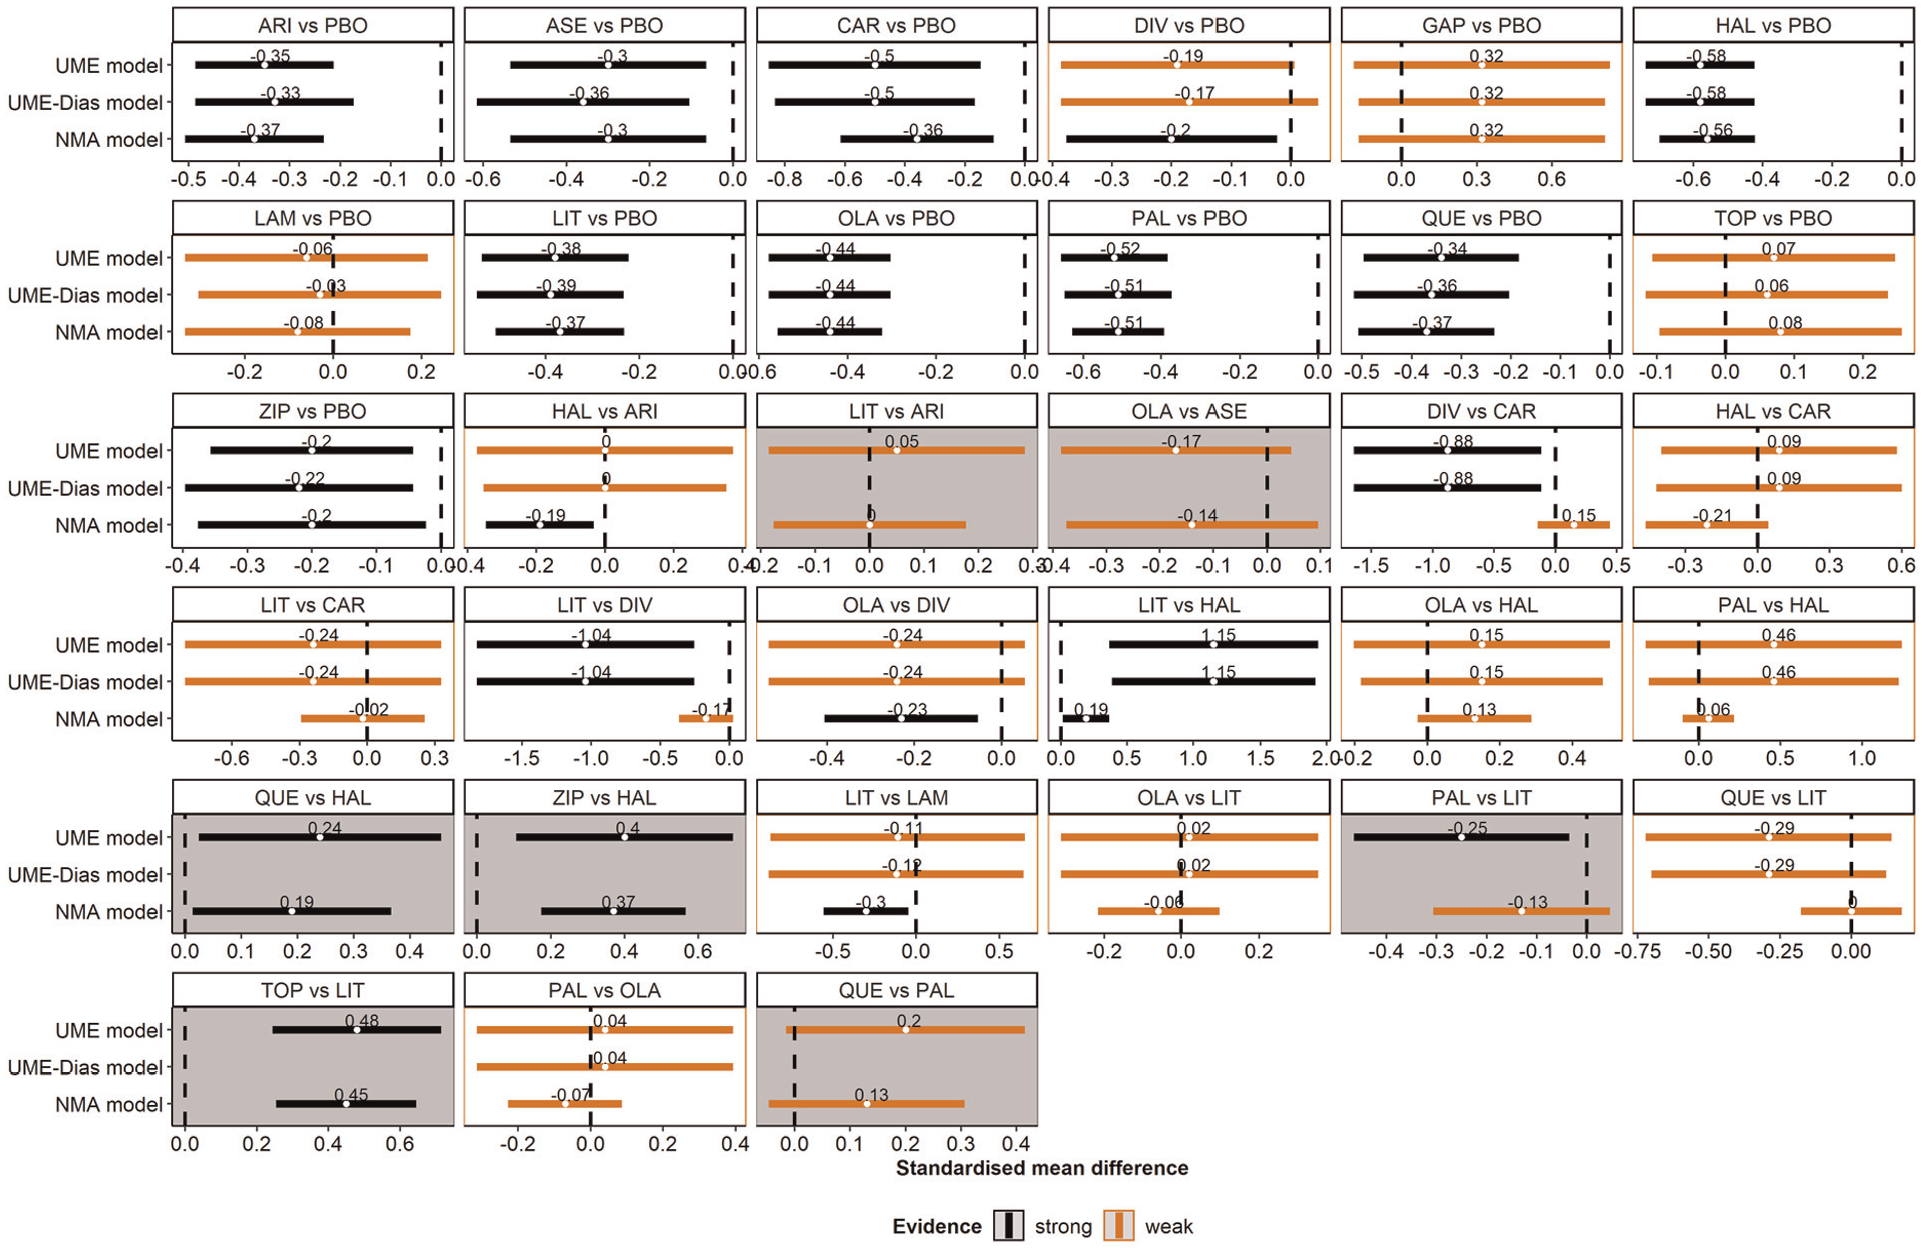
A panel of forest plots on the standardized mean difference (SMD) for all observed comparisons under the network meta-analysis (NMA), the refined unrelated mean effects (UME) model, and the UME-Dias model. Results refer to the posterior mean and 95% credible interval of the SMD. Gray panels refer to the omitted comparisons. Red and black indicate weak and strong evidence, respectively. Namely, the corresponding 95% credible interval includes and excludes the null value, respectively.
Network of Pharmacologic Interventions for COPD
The network of 5 interventions (and their combinations) and placebo for COPD included 5 (24%) multiarm trials: 2 three-arm and 3 four-arm trials (Figure 1B). Of the 15 (54%) observed comparisons, 6 (40%) were omitted from the UME-Dias model. All models converged according to the
Overall, both UME models yielded similar posterior mean deviance contributions (Figure 4A). The scatterplot indicated a poor fit of the NMA model for 2 trial arms that exhibited substantial deviance under the NMA model and deviance close to 1 for both UME models (Figure 4A). These trial arms were flagged as outliers in the Bland-Altman plot as they exceeded the upper limit of agreement (Figure 4B). The 2 points referred to the unique trial that compared formoterol with tiotropium (Supplementary Table S2 in Supplementary Material 2). This trial was found outside the red parabola of the leverage plot for NMA (Supplementary Figure S2, plot C, in Supplementary Material 2) alongside the 2-arm trial 1 (0 events in fluticasone; Supplementary Table S2). Trial 1 also contributed to the poor fit of both UME models (Supplementary Figure S2, plots A and B) as both arms were associated with a substantial posterior mean deviance (Figure 4A).
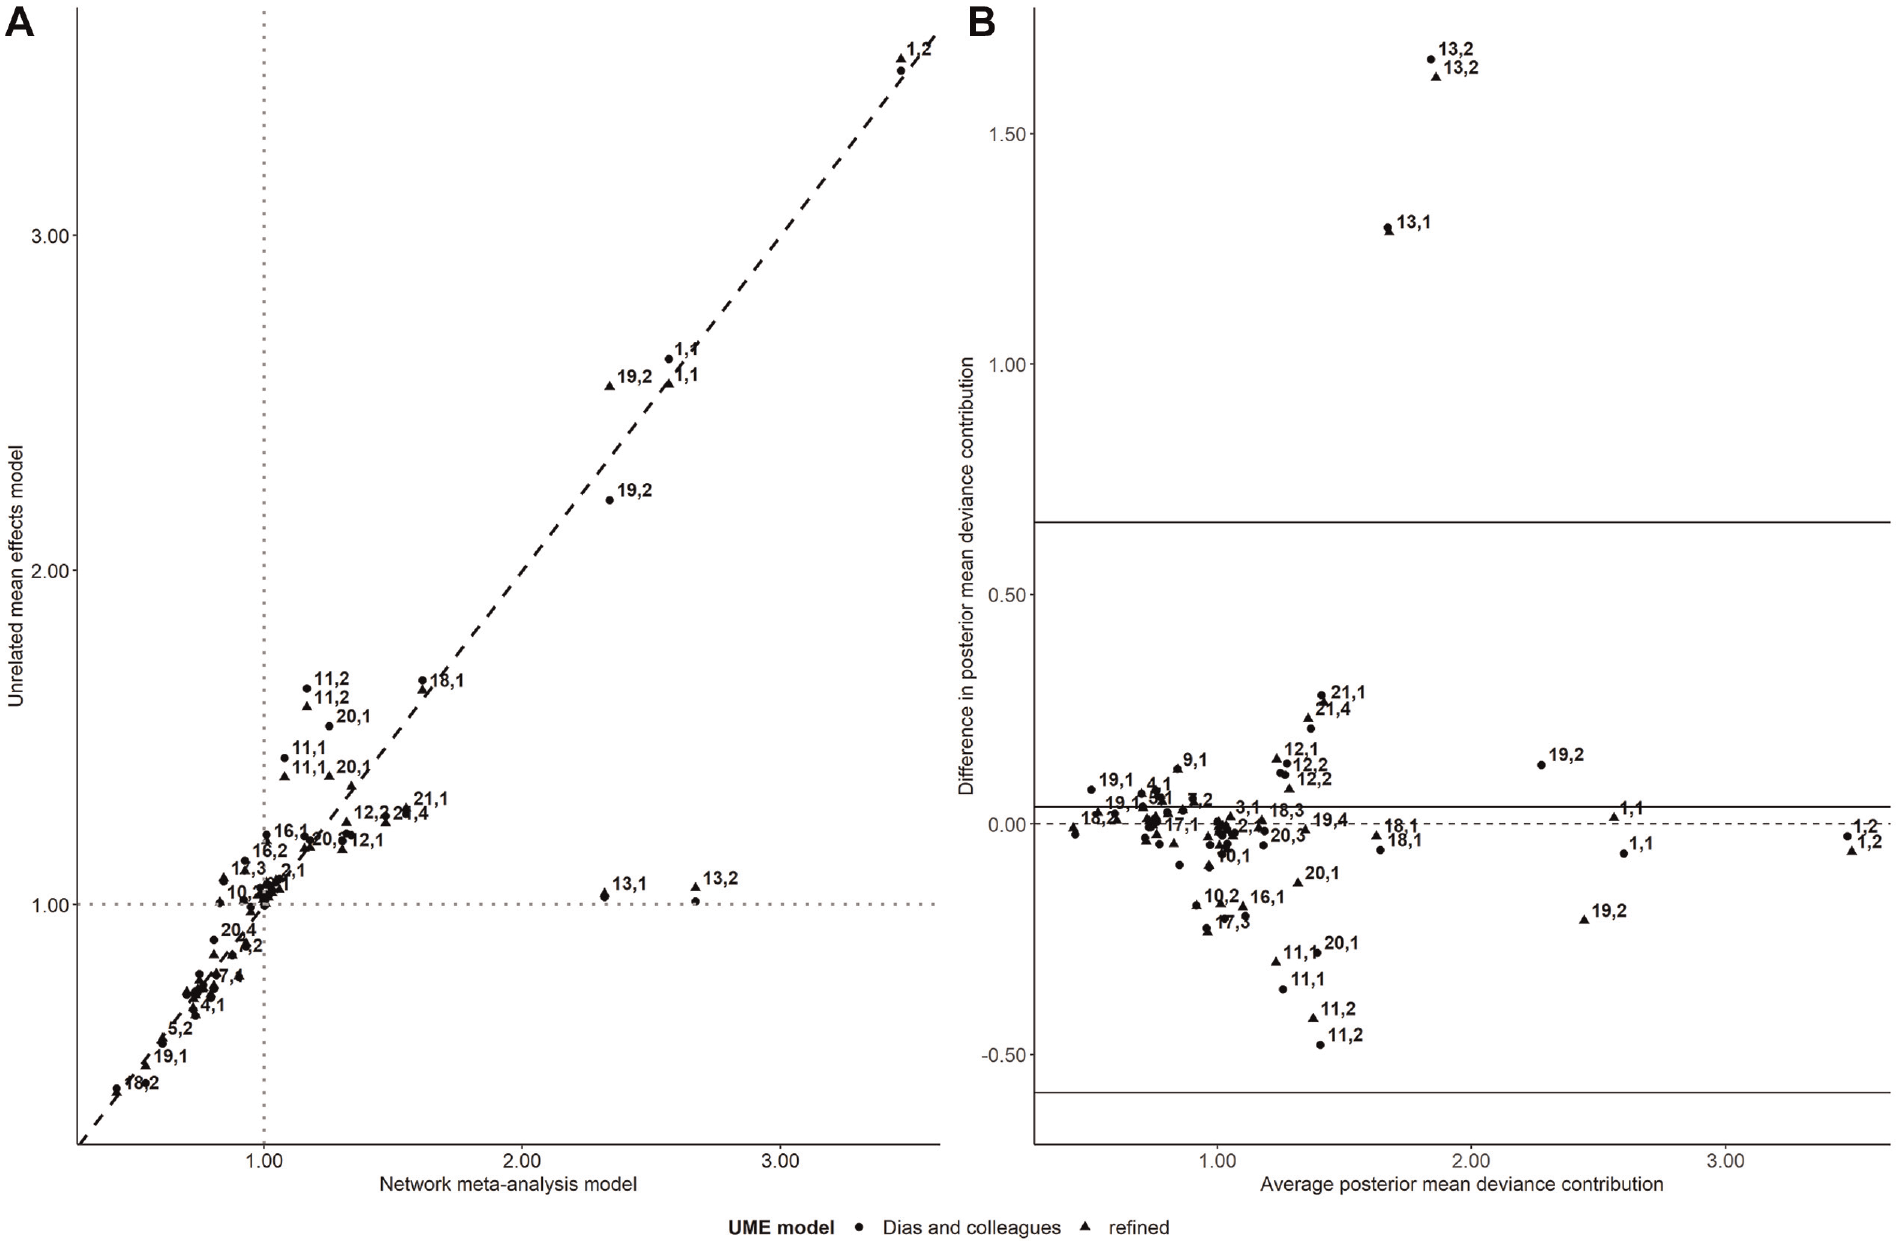
Scatterplot of the posterior mean deviance contributions of the trial arms under the unrelated mean effects (UME) models (refined and Dias and colleagues; y axis) and the network meta-analysis (NMA) model (x axis) for the network of pharmacologic interventions for chronic obstructive pulmonary disease (plot A). The gray dotted lines refer to 1 posterior mean deviance contribution. The Bland-Altman plot on the difference in the posterior mean deviance contributions between the NMA and the UME models (refined and Dias and colleagues) against the average posterior mean deviance contributions of the compared models (plot B). Each data point corresponds to a trial arm, indicated by a pair of numbers. The first number refers to the trial ID, and the second number refers to the trial’s arm, as placed in the analyzed data set (Supplementary Table S2).
The panel of forest plots illustrated almost identical results for the UME models and, overall, similar results for the NMA and either UME model (Figure 5). For the comparison of formoterol with tiotropium, the posterior estimate of OR differed remarkedly between the NMA and UME models, which, in conjunction with the substantial deviance contribution of the corresponding trial to the poor fit of the NMA model (Figure 4), may suggest possible inconsistency in the network.
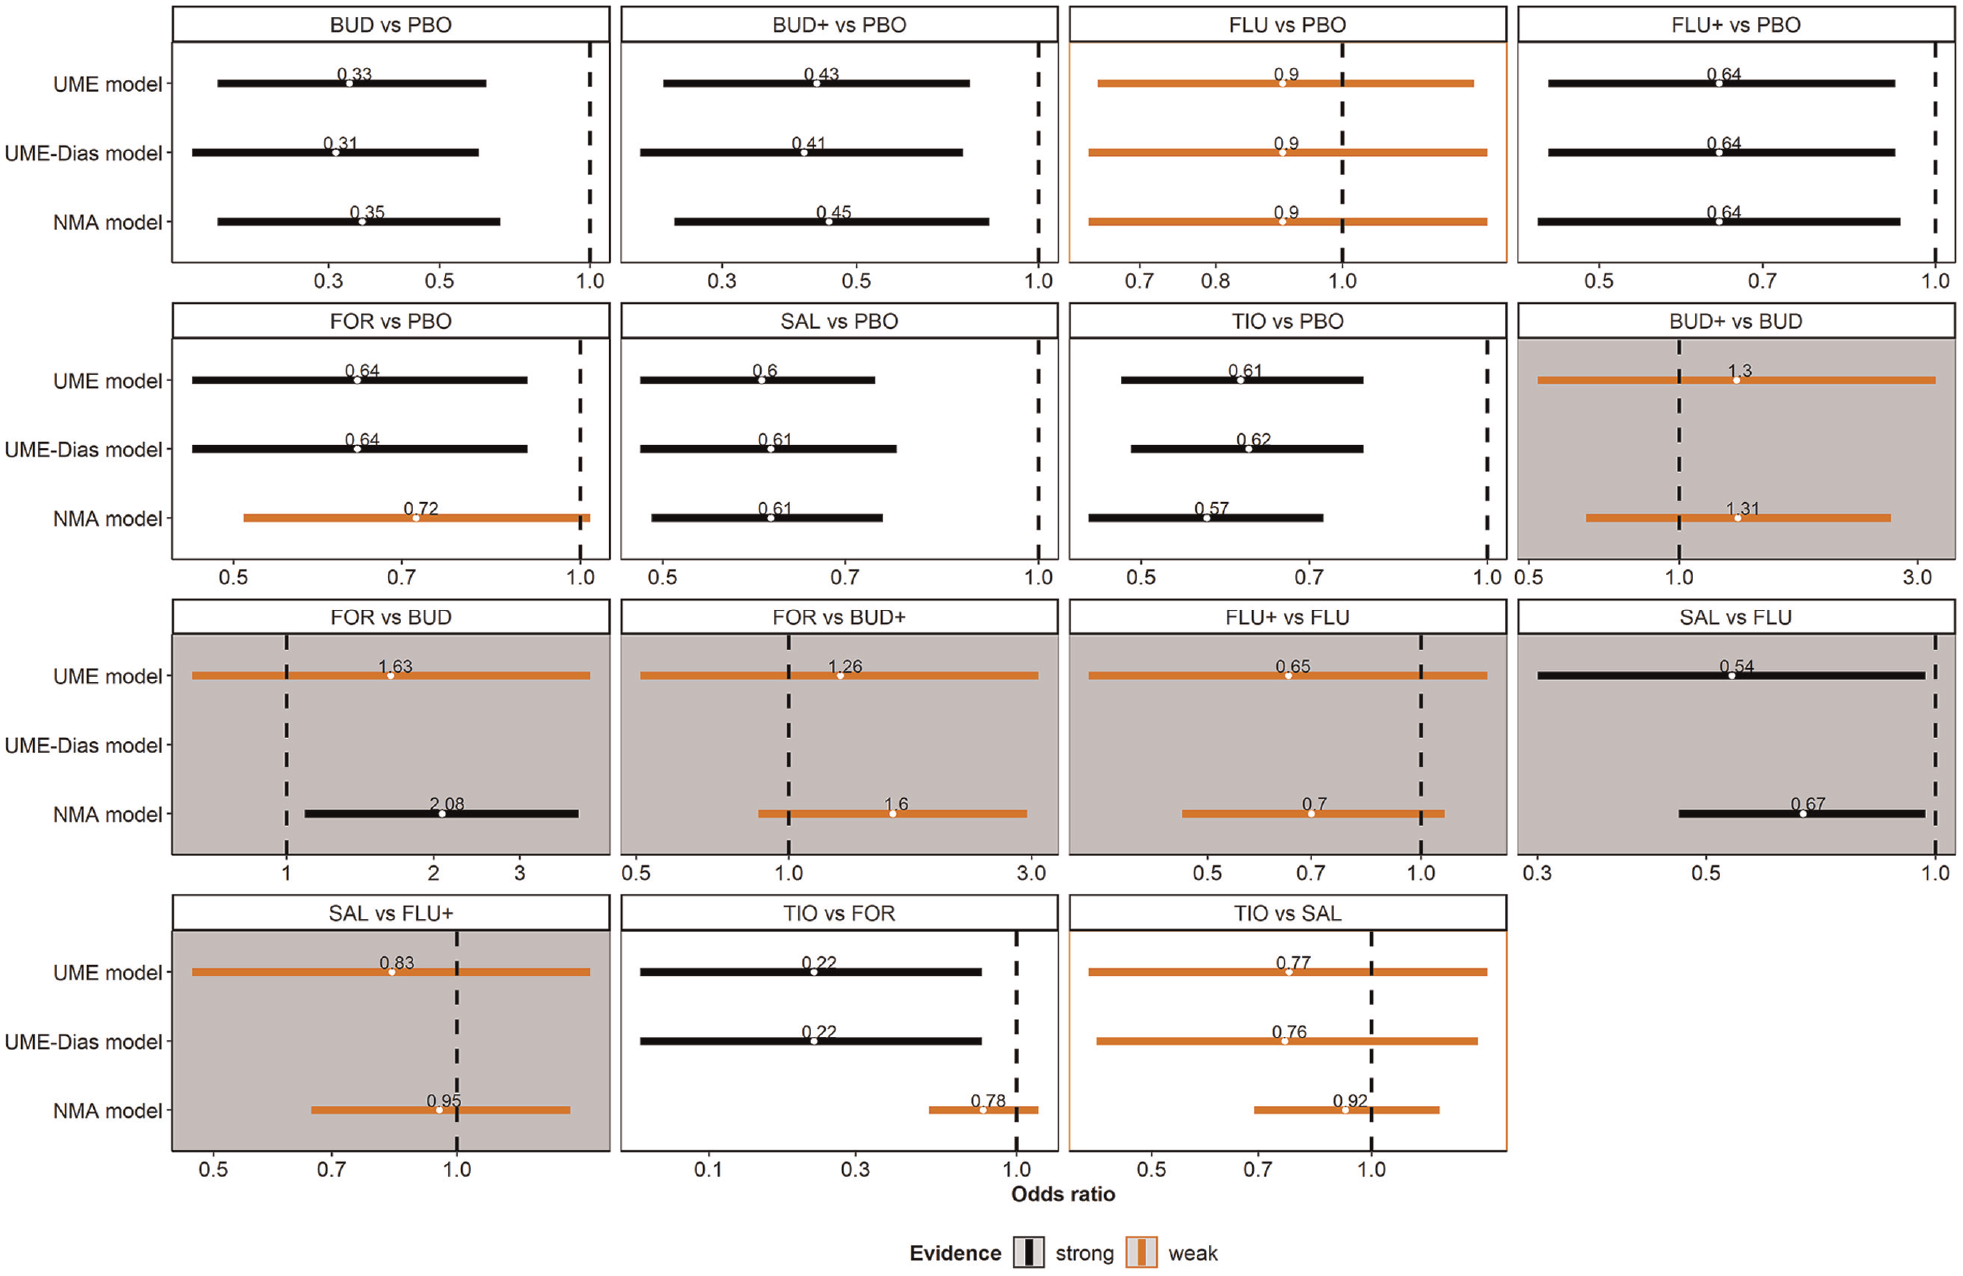
A panel of forest plots on the odds ratio (OR) for all observed comparisons under the network meta-analysis (NMA), refined unrelated mean effects (UME) model, and the UME-Dias model. The results refer to the posterior mean and 95% credible interval of the OR. Gray panels refer to the omitted comparisons. Red and black indicate weak and strong evidence, respectively. Namely, the corresponding 95% credible interval includes and excludes the null value, respectively.
Discussion
The refined UME model and the UME-Dias model gave the same conclusions regarding possible inconsistency in both examples. Both models elucidated the same data points that contributed to possible inconsistency in the investigated networks. They also yielded similar measures of model fit and almost identical estimated
The present study considered a series of complementary plots to thoroughly investigate the individual data points’ deviance contribution, which laid the foundation for signaling possible inconsistency in both examples. Specifically, the scatterplot flagged the data points with higher posterior mean deviance than expected for the NMA model. The Bland-Altman plot complemented the scatterplot by detecting the outlying trial arms among those with substantial deviance contribution as they laid outside the 95% limits of agreement. Furthermore, this plot offers further exploratory insights that are not obvious by looking at the scatterplot. For instance, the lack of randomness in the scattered points and a nonzero bias may indicate a possible mismatch between the direct and NMA evidence that questions the whole evidence base. The leverage plot for NMA revealed that the outlying data points were found outside the red parabola, thus contributing substantially to the DIC (an amount larger than 3) and the model’s poor fit. The panel of forest plots pinpointed poor overlapping in the 95% CrI of the treatment effects of comparisons informed by the outlying trials, showing the consequences of possible inconsistency.
The panel of forest plots should be used to aid model critique and highlight the issues caused when potential inconsistency is detected rather than scrutinize the relative effects between the NMA and UME models. A comparison of the posterior mean of the treatment effects obtained via the NMA model with those obtained via the UME model has been criticized as an inappropriate method to evaluate inconsistency. 6 This is because an NMA estimate is an amalgamation of direct and indirect evidence.
In the present study, we elaborated on the random-effects UME model for 2 reasons. First, the random-effects model is more appropriate than the fixed-effect model in systematic reviews, in which clinical and methodological heterogeneity should be expected and may manifest as statistical heterogeneity. 27 Second, the proper accommodation of multiarm trials and related parameterization issues are relevant in the random-effects model.
We have developed an algorithm to automatically detect the omitted comparisons (if any) in the network and incorporate them in the refined UME model. In Supplementary Material 1, we provide user-defined functions in R to run the refined UME model in 1 step and obtain the necessary plots of the present work. The user can employ the following effect measures: OR for binary outcomes, mean difference, SMD, and ratio of means for continuous outcomes.
The refined UME model is not immune to different parameterization, which comprises our work’s major limitation. The choice of parameterization will affect the derived omitted comparisons, because selecting a different baseline intervention for the multiarm trials will derive different omitted comparisons.5,11 Suppose a connected network comprises an ABC, an AC, and an AB trial. Selecting intervention A to be the baseline arm in the ABC trial will yield the BC comparison as omitted. Selecting intervention B or C as the baseline arm in the ABC trial will not yield omitted comparisons. Suppose the network did not include an AB trial. Selecting intervention C as the baseline arm in the ABC trial will yield the AB as an omitted comparison. However, regardless of the selected parameterization, the refined UME model will estimate all observed comparisons of the network, contrary to the UME-Dias model.
Another limitation, common to the UME models, is that different parameterizations of the multiarm trials may affect the estimates and possibly the measures of model fit. 11 Suppose there is also a BC trial in the example above, and we are interested in the BC comparison. Since the multiarm and 2-arm trials inform all comparisons, there are no omitted comparisons. However, selecting a different baseline arm will lead to one comparison being informed solely by the corresponding 2-arm trial. When A is the baseline arm in the ABC trial, the BC trial supports only the BC comparison. When B or C is the baseline arm, both ABC and BC trials contribute to the estimation of BC. The extent to which different parameterizations lead to different conclusions may also depend on the extent of between-trial variance. Different parameterizations may not affect the conclusions if the between-trial variance is low.
Useful clinical decisions can be made based only on models that assume the underlying evidence is consistent to ensure coherent estimates for a proper incremental assessment of benefits and costs. Models like the UME that synthesize evidence without the consistency assumption are useful for assessing the feasibility of this assumption. When the consistency assumption is not deemed feasible, the whole evidence base should be called into question. Decisions should not be based on results from any syntheses that do not properly account for the reasons for this inconsistency.
Conclusion
The proposed refinement of the UME model handles multiarm trials properly, and it yields treatment effects for all observed comparisons. A thorough inspection of the deviance contribution of the individual data points in conjunction with visualizing the posterior summaries of all observed comparisons under the NMA and refined UME models can aid our conclusions about possible global inconsistency in the network. In the presence of inconsistency, we should not be making inferences based on any of the models because they do not adequately describe the totality of the evidence available.
Supplemental Material
sj-7z-1-mdm-10.1177_0272989X211068005 – Supplemental material for A Revised Framework to Evaluate the Consistency Assumption Globally in a Network of Interventions
Supplemental material, sj-7z-1-mdm-10.1177_0272989X211068005 for A Revised Framework to Evaluate the Consistency Assumption Globally in a Network of Interventions by Loukia M. Spineli in Medical Decision Making
Supplemental Material
sj-docx-2-mdm-10.1177_0272989X211068005 – Supplemental material for A Revised Framework to Evaluate the Consistency Assumption Globally in a Network of Interventions
Supplemental material, sj-docx-2-mdm-10.1177_0272989X211068005 for A Revised Framework to Evaluate the Consistency Assumption Globally in a Network of Interventions by Loukia M. Spineli in Medical Decision Making
Footnotes
Acknowledgements
We would like to thank 2 anonymous reviewers for their insightful comments that thoroughly improved the article.
The author declared no potential conflicts of interest with respect to the research, authorship, and/or publication of this article. The author disclosed receipt of the following financial support for the research, authorship, and/or publication of this article: Financial support for this study was provided entirely by a grant from the German Research Foundation (Deutsche Forschungsgemeinschaft, grant No. SP 1664/1-3). The funding agreement ensured the authors’ independence in designing the study, interpreting the data, writing, and publishing the report.
Research Data
Data supporting the findings of this study are available as supplementary material.
References
Supplementary Material
Please find the following supplemental material available below.
For Open Access articles published under a Creative Commons License, all supplemental material carries the same license as the article it is associated with.
For non-Open Access articles published, all supplemental material carries a non-exclusive license, and permission requests for re-use of supplemental material or any part of supplemental material shall be sent directly to the copyright owner as specified in the copyright notice associated with the article.