
Abstract
The Affordable Care Act (ACA) provided access to health insurance for 20 million previously uninsured Americans, including over 12 million in the ACA marketplace. 1 Despite gaining access to insurance, many individuals struggled to estimate expected out-of-pocket costs across plans in order to choose a plan that fit their needs. 2 In many areas, more than 40 plan choices were available in the marketplace, leading to choice overload. 3 As a result, numerous decision support tools were developed to help individuals choose the best health insurance plan for themselves and/or their families.
Both qualitative4,5 and quantitative6,7 data suggest that individuals can benefit from health insurance decision support, including out-of-pocket expense calculators. However, the level of personalization and method of cost estimation varies across tools. For example, in some state-based tools, 8 global evaluations of one’s subjective-health status are used to estimate how healthy or sick an individual feels. Those subjective ratings are used to suggest insurance plans. When selecting insurance in the ACA marketplace on healthcare.gov last year, users were asked whether they expected “low,” “medium,” or “high” health care utilization, with the website providing definitions of those qualitative descriptors in terms of numbers of doctor visits and medications. The website then showed cost estimates for groups of plans by metal level (gold, silver, or bronze) before showing specific plans within metal level category. A more complex tool,9,10 like some other tools used to facilitate health insurance decisions,11–13 uses data from the Medical Expenditure Panel Survey (MEPS) 14 to estimate costs to the consumer for each available plan in their region, after insurance is applied. These objective estimates are based on national data about health services that Americans use, how frequently they use them, and the cost of these services across demographic characteristics and health conditions. Available plans are then sorted from lowest to highest expected annual cost to an individual or family, and “good fit” plans are highlighted based on an algorithmic prediction of costs and the risk of incurring more costs than expected.9,10
In each of these available tools, consumers can learn about available health insurance plans and the specific costs required to cover themselves and/or their family. However, the best way to estimate personalized costs is unknown. Subjective evaluations of health status or health care utilization have been used reliably to report physical symptomatology of diseases, emotional well-being, and functional-related health15,16 across diverse health conditions.17,18 Subjective-health status is simple for users to complete, does not ask personal health information, and may provide an efficient way to calculate insurance needs. However, their lack of precision may not generate the best estimate of health care utilization for some individuals, in part because some medical conditions may be far more costly in dollars than in perceived loss of health and vice versa.
Estimating health care utilization and costs using nationally representative data on demographic characteristics and health conditions may be a more precise and objective way to estimate health insurance plan costs. However, users might not want to share personal health information online.19,20 In addition, the detailed cost calculations might not be necessary if subjective-health assessments are sufficient to approximate utilization.
The purpose of this study was to describe the potential value added from using a quantitative cost calculator based on MEPS national data compared to a method using subjective-health status to estimate users’ expected health care utilization and costs. We compared expected health care utilization using each of these two methods in a sample of 327 individuals. We then analyzed how each method related to subsequent self-reported health care utilization at a 1-year follow-up. We also explored whether age moderated the relation between subjective-health status and MEPS-based predictions of health care utilization to see if older adults’ subjective-health ratings were less reliable than those of younger adults.
Methods
Participants
Participants were part of a larger randomized study evaluating a web-based decision tool that supported individuals’ health insurance choices through the ACA marketplace. 10 The study was approved by the Human Research Protection Office of Washington University. Participants were recruited from community events, online advertisements, social service organizations, and the recruitment/retention arm of the Center for Community-Engaged Research at Washington University. All participants completed informed consent. After completing the study procedures, they received a gift card, glossary of health insurance terms, and list of health insurance enrollment facilitators near them. The final sample included 327 men and women between the ages of 18 and 64 who were English-speaking, eligible for the ACA marketplace, and lived in counties within 90 miles of St. Louis, Missouri (individuals 65 and older are not eligible for the marketplace since they are Medicare eligible). Table 1 displays demographic information about participants.
Participant Characteristics Overall and at 1-Year Follow-Up

Participants could select more than one response; numbers will not add up to 100%.
Predicted Yearly Medical Expenses
Individuals were asked to indicate whether they had any of the following common and costly medical conditions: arthritis, musculoskeletal conditions, chronic obstructive pulmonary disease or asthma, cancer, diabetes, depression, anxiety, other mental illness, stroke, hypertension, heart conditions, epilepsy, and attention deficit hyperactivity disorder. Participants could manually enter other conditions not itemized above, although these other conditions were not factored into the cost estimation. An algorithm estimated individuals’ predicted yearly expenditures based on age, gender, and health conditions, using national data from the MEPS. 14 MEPS is a set of large-scale surveys of families and individuals, their medical providers, and employers across the United States. MEPS utilizes a complex survey design and administers questionnaires to collect nationally representative data on demographic characteristics, health conditions, health status, use of medical care services, charges and payments, access to care, satisfaction with care, health insurance coverage, income, and employment. See references for additional details on MEPS and the tool’s use of MEPS data.9,14
Measures
Baseline
Demographics
Participants were surveyed about gender, age, race/ethnicity, number of dependents, and self-reported chronic conditions.
Self-reported health status
All participants were asked to report their perceived health status with the question, “Would you say that, in general, your health is . . .” Response options included Poor, Fair, Good, Very Good, and Excellent.21–23 Poor and fair were grouped together in analyses due to small numbers of individuals selecting these categories.
One-Year Follow-up
Self-reported health care utilization over last 12 months
In order to assess utilization of health care services, study personnel followed up with participants 12 months after initial recruitment. Participants were asked, “In the past 12 months, how many times did you go to . . .” 1) a doctor’s office, clinic, or other health care provider; 2) an emergency room; 3) an urgent care center; and 4) were you a patient in a hospital for one night or longer. Utilization variables were combined and treated as total number of visits in the past year.
Data Analysis
Descriptive statistics were calculated for the sample. Four mixed effects linear models tested associations between 1) self-reported health status and MEPS-predicted expenses, 2) self-reported health status and number of chronic conditions, 3) self-reported health status and health care utilization, and 4) MEPS-predicted expenses and health care utilization. We expected differences to exist in insurance status between baseline and follow-up since participants were eligible for the study if they were eligible for the ACA marketplace; many participants were recruited at events to enroll in health insurance. Thus, we did not control for insurance status in multivariable analyses presented here, but we verified that insurance status did not change outcomes reported. We explored whether a significant interaction existed between age and self-reported health status in predicting MEPS-based expenses, treating both variables as continuous for this analysis. Significance of α = 0.05 was used, and all tests were two-sided.
Results
Overall, 327 individuals completed the baseline assessment. Of those, 120 participants responded to the follow-up survey. Characteristics of the entire study population and the follow-up population are reported in Table 1.
Self-Reported Health Status and Predicted Expenses
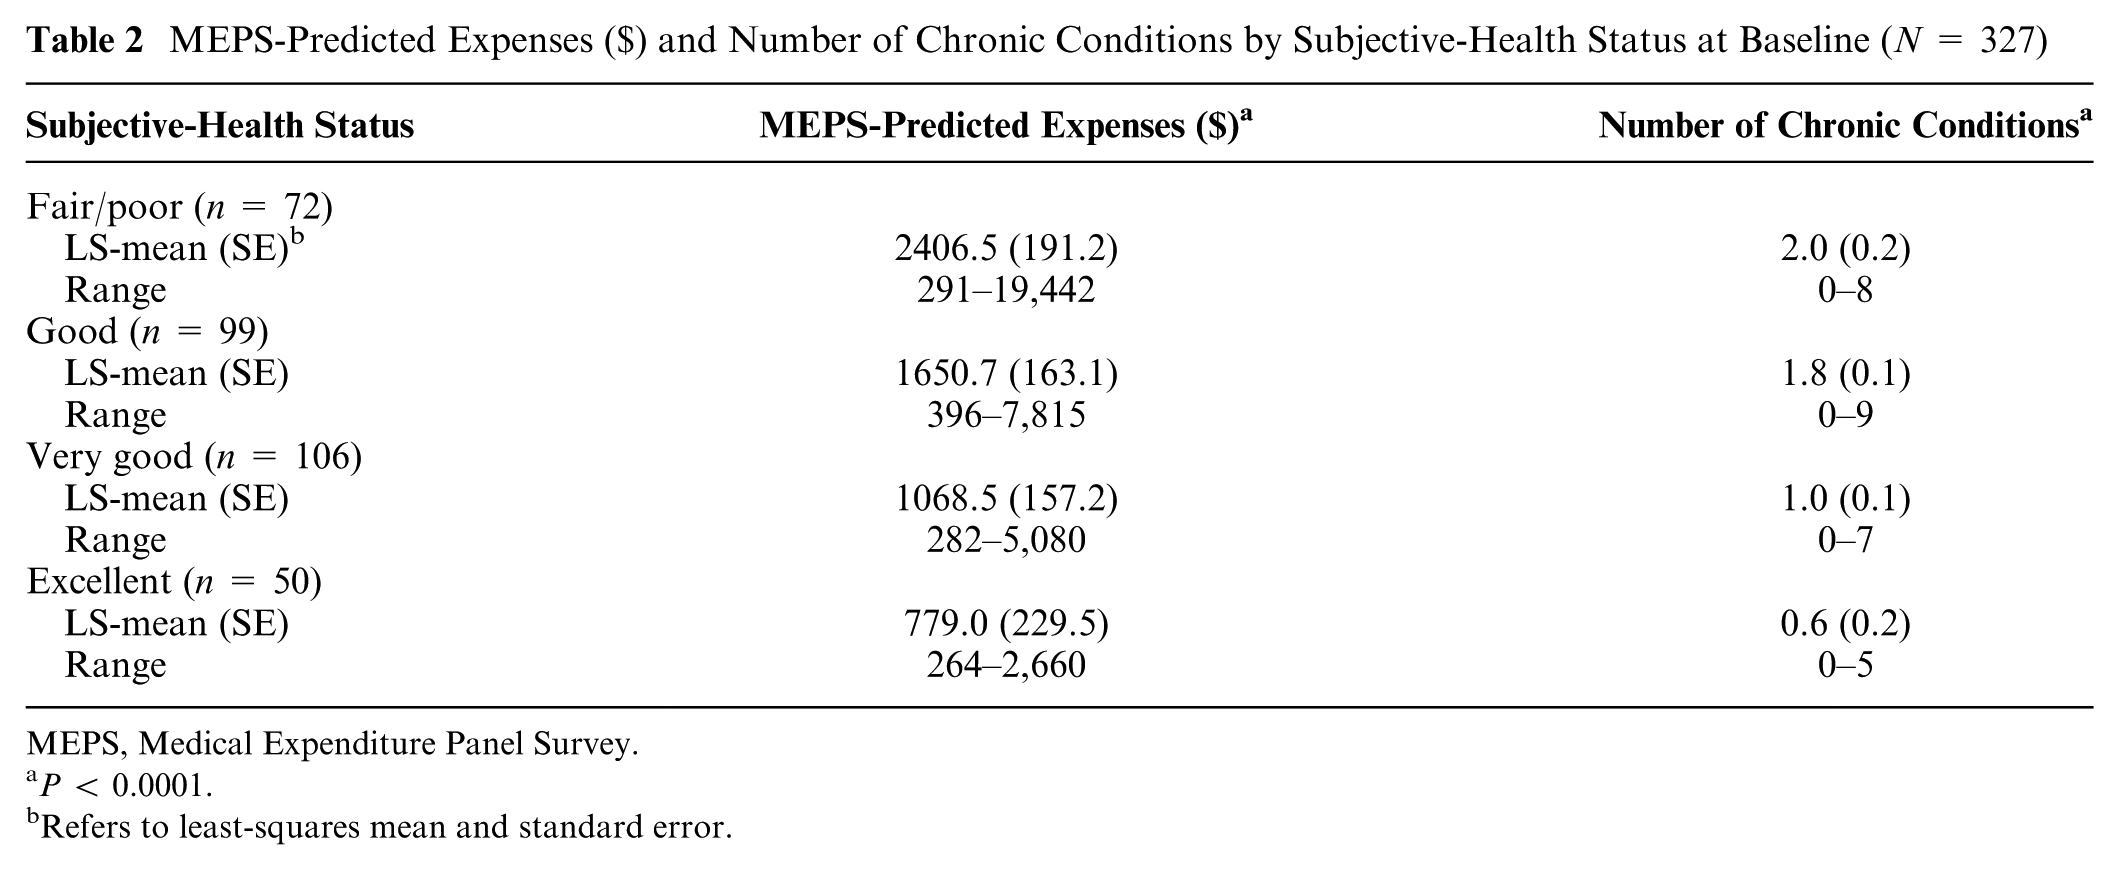
The majority of the sample at baseline reported that their health was good (30.3%; n = 99) or very good (32.4%; n = 106). Predicted expenses provided by the MEPS-based algorithm and self-reported health status were significantly related (P < 0.0001). For example, those who stated they had poor health status were expected to spend an average of $3921.40 (5549.7 SD) in predicted expenses for the year, whereas those who reported excellent health status were only expected to spend an average of $779.00 (474.0 SD) per year (Table 2). However, the ranges were quite large and overlapped across health-status categories. Online Appendix A shows some examples of those who were “outliers” with regard to subjective-health status and MEPS-based predictions of expenses. As expected, a greater number of chronic conditions was associated with poorer self-reported health status (P < 0.0001). For instance, those who indicated they were in poor or fair health had a mean of 2.0 chronic conditions, compared to those who indicated they were in excellent health, who had a mean of 0.6 chronic conditions (Table 2).
MEPS-Predicted Expenses ($) and Number of Chronic Conditions by Subjective-Health Status at Baseline (N = 327)
MEPS, Medical Expenditure Panel Survey.
P < 0.0001.
Refers to least-squares mean and standard error.
We examined self-reported health status compared to MEPS-based predicted expenses by age (Table 3). Although the expected mean differences existed between those who reported poorer and better health, the predicted expenses still included a large range of values across all age groups. Among older adults, we observed wide variability and no clear trend by self-reported health status (Table 3 displays results by age categories). Not only did older adults report poorer subjective health, but a significant interaction existed between age and subjective-health status on MEPS-based predicted expenses (P = 0.04) such that subjective-health status was a less reliable correlate of MEPS-based predicted expenses among older adults.
Subjective-Health Status and MEPS-Predicted Expenses ($) by Age Group at Baseline (N = 327) a

MEPS, Medical Expenditure Panel Survey.
Age was treated as a continuous variable in analyses but is displayed here in categories to view patterns and trends.
Follow-Up Health Care Utilization and Predicted Expenses
We analyzed the 120 participants (67.5% female; mean age = 42.3) from the initial sample of 327 who participated in the follow-up survey to assess whether MEPS-predicted expenses or self-reported health status related more to subsequent health care utilization during the 12 months after the initial survey. The mean MEPS-predicted expenses were higher for those who subsequently reported higher levels of health care utilization over 12 months, though results were not statistically significant (P = 0.18). Table 4 displays MEPS-predicted expenses by reported number of health care visits.
MEPS-Predicted Expenses ($) and Subjective-Health Status by Health Care Utilization (Number of Health Care visits) at 12-Month Follow-Up (n = 120) a

MEPS, Medical Expenditure Panel Survey.
Data were analyzed using number of visits as a continuous outcome variable, but are displayed here in categories to view patterns and trends.
Includes visits to any doctor, emergency room, urgent care, or hospital stay.
Additionally, when comparing self-reported health status and subsequent health care utilization, individuals who indicated that they had poor health all had one or more health care visits (Table 4). However, there were some individuals who reported very good or excellent health who still had more than 11 health care visits during the past 12 months. The relationship between self-reported health status and health care utilization was not statistically significant (P = 0.92).
Discussion
These study findings suggest that using a more precise predictor of health care utilization through quantitative estimates may be beneficial in personalizing health insurance decision support, particularly among older adults. However, neither the objective nor subjective method was statistically significantly related to health care utilization at a 1-year follow-up in this sample of individuals considering enrollment in the ACA marketplace. This result may indicate the difficulty in predicting unexpected events such as new diagnoses of chronic illnesses or emergencies that arise. It may also suggest that individuals who have not had regular care before or were previously uninsured used care differently than those familiar with the health care system. It is also important to note that neither tool is designed to predict utilization per se, but rather to estimate out-of-pocket costs incurred under different plans.
There were very wide ranges of MEPS-based predictions of expenses and self-reported health care utilization within subjective-health categories. Given the complexities of health insurance and health insurance literacy, tools that can add methodologically rigorous quantitative prediction of utilization may better support health insurance plan selection than those relying on subjective-health reports alone. Although MEPS-based predictions of expenses may only approximate health care utilization and resulted in some mismatches, many more instances existed in which a mismatch occurred between self-reported health status and subsequent health care utilization. This mismatch could result from the difficulty of anticipating emergency care or unexpected care needs. Quantitative MEPS-based predictions can also miss unexpected care needs. However, they are based on nationally representative data and may circumvent subjective biases about how one is feeling and inaccurate estimates about average care needed to manage particular conditions.
For example, in some cases, individuals subjectively rated their health as very good or excellent, yet they used frequent care, including costly care such as emergency room (ER) visits and hospital stays. It is possible that these individuals felt healthy and felt they managed their chronic conditions well, but needed to use care to continue to do so. Alternatively, participants in this group might be overusers of the health care system, worried about illness and frequently seeking care, but without diagnosed health conditions. Future studies can explore perceptions of health as they relate to the presence or absence of health conditions. It is also possible that these individuals were uninsured and used the ER for issues that could have been addressed in an outpatient office visit. We explored whether insurance status affected our results, but the findings were consistent whether or not individuals were insured. Age may also play a role in this trend in misprediction. Older adults reported poorer subjective health, and subjective-health status was a less reliable correlate of MEPS-based predicted expenses among older adults. Older adults might feel healthy compared to their age-consistent peers, but they may still use more care than younger adults. MEPS-based predictions factor in the effect of age without this potential bias.
Other individuals reported no or few chronic conditions yet poor or fair subjective health. In these cases, it is possible that these individuals are considering health insurance for the first time and may have undiagnosed chronic conditions. They could have obesity or chronic alcohol use or could just be feeling ill on the day they answered the question. One individual was a tobacco user, which could have affected the participant’s low subjective health compared to his/her relatively lower MEPS-based prediction of utilization. It is also possible that they did not report an ongoing health issue. Responses to subjective-health status may be influenced by these factors. Future research could explore how individuals define good or poor health.
This study’s findings should be considered within the context of some methodological limitations. A larger sample size may have been useful, particularly for the follow-up data, given the ranges of variables discussed above. Our results indicate how one particular quantitative tool that uses MEPS data and other risk-adjusted algorithmic predictions of health care expenditures compares to a method using one subjective-health status question. Although both methods are commonly used, there are many other tools available to help individuals select health insurance plans and they may combine quantitative and subjective data. Future studies may consider other ways to assess subjective-health status using more than one item, such as asking users how their subjective health may have changed over time. We assessed common and costly health conditions, but others might have been missing from our prediction, underestimating the potential for some individuals to incur high costs. We recruited individuals who were considering enrolling in insurance, many of whom were enrolling for the first time in many years with the passage of the ACA. These individuals might differ in terms of their health care utilization compared to others who have been insured for many years. Finally, we assessed number of health care visits and hospital stays, but did not ask about medication use or other potentially costly services such as medical imaging and did not attempt to scale our utilization data by cost. Nonetheless, the study provides useful insights into ways to support health insurance plan selection and avenues for future exploration of these issues.
Overall, results suggest that developers of health insurance decision support tools may want to contextualize subjective-health status within quantitative approaches to estimate health care utilization and, in turn, out-of-pocket health insurance costs to consumers. For example, using an algorithm that varies by age is likely important. Most marketplaces attempt to provide global cost estimators to consumers, yet their quality varies.24,25 Numerous private companies also provide health insurance decision support with varying amounts of detail depending on user input.26–28 Using quantitative tools that incorporate more precise predictors of health care utilization may better serve individuals’ needs in the rapidly changing health insurance landscape, especially as regulation setting standards for marketplace plans becomes less consumer-friendly. 24 More research should explore ways to accurately personalize health insurance plan recommendations in this challenging environment.
Supplemental Material
DS_10.1177_2381468318781093 – Supplemental material for A Comparison Between Subjective and Objective Methods of Predicting Health Care Expenses to Support Consumers’ Health Insurance Plan Choice
Supplemental material, DS_10.1177_2381468318781093 for A Comparison Between Subjective and Objective Methods of Predicting Health Care Expenses to Support Consumers’ Health Insurance Plan Choice by Mary C. Politi, Enbal Shacham, Abigail R. Barker, Nerissa George, Nageen Mir, Sydney Philpott, Jingxia Esther Liu and Ellen Peters in MDM Policy & Practice
Footnotes
Acknowledgements
The authors would like to thank the following individuals for their contributions to the study design and data interpretation: Matthew W. Kreuter, PhD, MPH, and Timothy McBride, PhD, Brown School of Social Work, Washington University in St. Louis.
Authors Nerissa George, Nageen Mir, and Sydney Philpott contributed equally. MCP has a research contract (2017-2019) from Merck & Co, on a topic unrelated to the content of this manuscript.
This research was supported by the National Institute on Minority Health and Health Disparities (NIMHD) of the National Institutes of Health (NIH) under Award Number R01MD008808. The funding agreement ensured the authors’ independence in designing the study, interpreting the data, writing, and publishing the report.
Authors’ Note
The data sets used and/or analyzed during the current study are available from the corresponding author on request.
Author Contributions
MP conceived the study and led interpretation of the study findings. MP, ES, AB, and EP contributed to writing the manuscript and interpreting the study findings. EL and NM conducted data analysis, with EL providing additional guidance when needed. SP and NG provided additional data support. All authors reviewed and approved the final manuscript.
Supplemental Material
References
Supplementary Material
Please find the following supplemental material available below.
For Open Access articles published under a Creative Commons License, all supplemental material carries the same license as the article it is associated with.
For non-Open Access articles published, all supplemental material carries a non-exclusive license, and permission requests for re-use of supplemental material or any part of supplemental material shall be sent directly to the copyright owner as specified in the copyright notice associated with the article.