
Abstract
We use health care claims data from the Health Care Cost Institute to estimate the share of geographic variation in health care spending attributable to person-specific (demand) and place-specific (supply) factors. We exploit patient migration across 112 metropolitan areas between 2012 and 2016. Using an event study approach, we find that moving to an area with 10% higher (lower) spending leads to a 4.2% increase (decrease) in individual medical spending. Our estimate implies that 42% of variation in health care spending among the commercially insured is attributable to place-specific factors. We show that variation in both price and utilization jointly determine the place-specific impact on individual spending. All else equal, we find that moving to an area with 10% higher (lower) prices, on average leads to a 5% increase (decrease) in spending, while moving to an area with 10% higher (lower) utilization leads to a 3.6% increase (decrease).
Keywords
Introduction
Health care spending for individuals with commercial insurance1 varies widely across different geographic areas. In 2016, per-capita medical spending in the commercial market ranged from $3,823 in Missouri to $5,173 in West Virginia—a difference of $1,350 per-capita (Health Care Cost Institute [HCCI], 2019). 2 This mirrors variation in the Medicare population. 3 However, while spending patterns among Medicare beneficiaries have been thoroughly examined, less is known about the commercially insured who comprise more than half of people living in the United States with health insurance coverage. 4 Additionally, in contrast with the Medicare population, variation in commercial health care spending may be driven by variation in both price and utilization. As the continued rise in per-capita spending puts increasing pressure on the budgets of governments, businesses, and households, understanding the sources of geographic variation among the commercially insured is crucial to inform proposals to reduce spending growth.
In this article, we examine the extent to which geographic variation in commercial health care spending is due to person-specific demand factors, such as population characteristics and preferences, or place-specific supply factors, such as provider capacity and practice patterns. To the extent supply factors affect health care spending, we assess whether they are driven by variation in prices, utilization, or both. We use claims data from the HCCI, covering approximately one quarter of the commercially insured population in the United States between 2012 and 2016. Our empirical strategy exploits individuals’ moves across metropolitan areas following the approach in Finkelstein et al. (2016). The intuition behind this approach is that if person-specific demand factors drive differences in spending across geographic areas, then on moving to an area with higher (lower) spending, an individual’s own spending will not change. However, if place-specific supply factors are responsible for the variation observed across areas, then the individual’s spending would immediately increase (decrease) to match the spending of their new location. If both demand and supply factors are at work, then we expect to see changes that fall between these two extremes.
Several previous studies have exploited patient or provider migration to identify person- and place-specific effects on a variety of outcomes. The approach was first pioneered in the health care literature to examine how the number of diagnoses for a patient changed on moving to regions of higher or lower practice intensity (Song et al., 2010). It has since been used to separate the role of demand- and supply-side factors in driving utilization differences among Medicare beneficiaries in different geographic areas (Finkelstein et al., 2016). More recently, it was used to assess how a physician’s practice environment is related to treatment decisions for heart attack patients, by examining physician behavior before and after a move between hospital referral regions with different rates of cardiac catherization (Molitor, 2018). In addition, one study analyzed the effect of moving to an area with greater care fragmentation on Medicare beneficiaries’ use of specialists and primary care physicians (Agha et al., 2019). Finally, closely related to questions examined in this article, a recent report measured spending by members of the military before and after they were relocated between different regions of the country (Luan et al., 2019).
The literature on geographic variation in health care spending and utilization dates back nearly a century, beginning with the documentation of widely varying rates of tonsillectomies across England in 1938 (Glover, 1938). In 1973, large variations across Vermont were found in age-adjusted utilization rates of health services as well as input resources and expenditures (Wennberg & Gittelsohn, 1973). This work continued to evolve in sophistication in the following decades. In the early 20th century, researchers used an end-of-life expenditure index to categorize 306 hospital referral regions into spending quintiles (arguing this reflects differences in spending exogenous to health status and regional prices) and found that higher spending regions did not have sufficiently better outcomes to justify the greater expenditures (Fisher et al., 2003a, 2003b). Several additional studies have examined geographic variation in health care spending, prices, and utilization, but have been mostly limited to observational analyses documenting correlations across regions. 5
There have been fewer studies assessing the causal relationship between systemic factors and spending variation, and the role prices and utilization patterns play. Furthermore, existing research is focused on the Medicare or near-elderly commercial markets or Medicaid. A thorough examination of this topic using Medicare data found that roughly 50% to 60% of price-adjusted spending variation was driven by place-specific factors (Finkelstein et al., 2016). 6 Abraham (2018) found qualitatively similar results within the near-elderly, commercially insured population. In both cases, these previous studies were performed in contexts where spending variation was solely due to variation in utilization. Analysis of the relationship between spending and prices and utilization in Medicaid has found that both prices and utilization contribute to geographic variation in spending for this population (Ganduglia Cazaban et al., 2019; Gilmer & Kronick, 2011).
Additionally, there is reason to believe that drivers of health care spending among the Medicare population may affect the commercial population differently. Previous literature has documented different spending patterns among the Medicare and commercially insured populations. Chernew et al. (2010) 7 found that Medicare and commercial spending are uncorrelated across areas, and more recent work has confirmed these patterns (Cooper et al., 2018). This divergence in spending patterns across the Medicare and commercial markets could be driven by differences in practice patterns for Medicare and commercial patients, or by differences between administered Medicare prices and the commercial prices negotiated between providers and insurers.
Conceptual Framework
Differences across geographic regions in spending and utilization could stem from either person- or place-specific factors. Person-specific factors include characteristics and preferences of the individuals living in each of the different geographic regions that affect demand for care. For example, underlying differences in health status, previous health care use, risk aversion or tolerance, or willingness to pay. Place-specific factors include features of the local health care system that affect the supply and cost of care. These could include the number and type of clinicians, insurer and provider market structure, or provider practice patterns.
The commercially insured population, which accounts for more than half of the U.S. population, presents a compelling context in which to study whether variation in health care spending is attributable to person- or place-specific effects. Within the commercially insured population, variation in spending levels is driven jointly by variation in area price and utilization levels, with at least half of the variation in spending across geographic regions attributable to differences in prices paid by insurers to providers (Cooper et al., 2018; Newhouse et al., 2013). Compared with Medicare, where prices are administratively set, understanding whether the role of place-specific factors is explained by health care prices versus patterns of health care utilization within the commercial population would help differentiate between potential policy solutions to address health care spending.
New Contributions
Our research adds to the literature on geographic variation in health care spending by quantifying the degree to which place-specific factors influence variation in health care spending among the commercially insured. This context provides a novel setting to study the causal drivers of geographic variation in health care spending. First, we study whether person- or place-specific factors influence health care spending among a population known to have different patterns of spending from the Medicare population. Second, we study the degree to which place-specific factors influence health care spending in a context where there is variation in both systemic price and utilization levels. This approach enables us to demonstrate the role of prices as well as utilization, in determining place-specific impacts on individuals’ spending.
We find that an individual moving to a metro area with 10% higher (lower) spending relative to their origin is predicted to have a 4.2% increase (decrease) in their medical spending. As discussed in Finkelstein et al. (2016), this finding implies that 42% of variation in medical spending across metro areas is due to place-specific factors and the remaining 58% is due to person-specific factors. Furthermore, we find evidence of separate, causal effects of place-specific price and utilization levels. In other words, both price and utilization levels play a role in determining geographic variation in health care spending among the commercially insured.
Study Data
Data Source
We used data from the HCCI commercial claims database, a large, geographically diverse data set containing information from the health care claims of approximately 40 million individuals annually. The HCCI data include the place of service, procedure and diagnosis codes, and actual payments made by the insurer and/or patient. We examined medical claims for individuals living in one of 112 metro areas between 2012 and 2016. We defined metro areas as core-based statistical areas (CBSAs). Our sample included a set of metro areas in which there was a sufficient density of HCCI data to both reliably measure spending, utilization, and prices in the commercial market and allow reporting at the metro area level. 8 We restricted our analysis to individuals below the age of 65 years who were enrolled in small or large group coverage through an employer with one of the following plan types: health maintenance organization, preferred provider organization, point of service plan, or exclusive provider organization. This left us with claims from 129.9 million member years, which we used to compute measures of metro area health care spending, price, and utilization levels.
Defining Metro Area Spending, Price, and Utilization Measures
For each metro area we calculated spending, utilization, and price indices for a common basket of services. 9 For our sample of movers, we then used these measures to calculate changes in an individual’s metro area’s spending, price, and utilization levels on moving.
Spending, Utilization, and Price Indices
We computed spending indices based on a basket of common services for each of the 112 metro areas in each year from 2012 to 2016, following a methodology laid out in Johnson and Kennedy (2020).
10
To compute the indices, we first calculated per-person spending for each service in each metro area. We then took the weighted average across services in each metro area.
11
We subsequently computed a spending index by comparing the service-weighted spending for each metro area to national service-weighted spending in 2012. Similar to Finkelstein et al. (2016), we then calculated the 5-year geometric average of the spending index for each metro area.
12
We define the 5-year average of each metro’s spending index values as a metro’s spending level, (
We next computed analogous utilization and price indices, which allow us to separately examine the relationship between spending and utilization and spending and price. Per-person utilization in a metro area is defined as the count of claims for each service divided by the total member years. We defined the average price of each service by dividing per-person spending on a given service by per-person utilization of that service. Utilization and price indices were constructed for each metro in each year by computing the weighted average across services of per-person utilization and average price measures. The 5-year geometric average in each metro area of these indices is our metro-level utilization index,
Changes in Metro Area Spending, Price and Use Levels
To measure the difference in the relative spending level between the metro area a person moves to (destination), compared with where they move from (origin),
Analytic Sample and Outcome Measure
Our analytic sample includes individuals with at least 4 years of continuous enrollment between 2012 and 2016 to provide a balanced panel of observations before and after individuals’ moves. 13 This restriction potentially biases our sample toward the particular spending patterns of individuals who are able to maintain stable insurance coverage through an employer. Such individuals are more likely to be healthier and therefore have lower health care spending than the average individual. It is important to note, though, that observing an individual within the HCCI data over time does not require the individual to maintain coverage through the same insurance plan—whether or not an individual moves. That is, an individual we observe over time could change employers and therefore plans or maintain the same employer, but switch from an Health Maintenance Organization plan to a Preferred Provider Organization, for example. As described later, our empirical model accounts for changes in individuals’ plan enrollment over time.
Using monthly enrollment information from the HCCI data, we constructed samples of movers and nonmovers. We identified individuals defined as “movers” who feature exactly one change in their residence five-digit zip code reported in our monthly enrollment data. We denoted the calendar year in which this change occurred as an individual’s move year. We subsequently mapped each individual’s five-digit zip code to the relevant metro area and limited our sample of movers to individuals who moved from one of our sample metro areas to a different sample metro area. For example, we excluded individuals who had a change in their residence zip codes but stayed within the same metro area or moved to or from a metro area outside of our sample set of metro areas. We further restricted our sample of movers to individuals for whom we observe at least 2 years of coverage prior to their move and 1 year following their move. This implied two cohorts of individuals who moved in either 2014 or 2015.
For our nonmover sample, we kept all individuals who featured no change in the residence five-digit zip code reported in their enrollment file. We then compiled a 5% random sample of individuals who remained in the same metro area throughout the duration of their coverage. We then separated our sample of nonmovers into two cohorts corresponding to our mover cohorts of individuals who moved in either 2014 or 2015. 14
We calculated total annual medical spending for individuals in our analytic sample by summing the allowed amounts (which included both payer and individual out-of-pocket spending) on each claim across all service categories (inpatient, outpatient, and professional services) in each calendar year. We exclude prescription drug spending because we lack data on manufacturer rebates, coupons, and other out-of-pocket assistance, which reduce spending, but by an unknown amount. We use the natural logarithm of total annual medical spending as our outcome variable.
Empirical Strategy: Identifying Place-Specific Effects on Health Care Spending Using a Movers Design
We isolate the place-specific effect on individuals’ medical spending among individuals who move across geographic areas over time. We study the degree to which an individual’s medical spending increases (or decreases) if they move to a relatively higher (or lower) spending area.
Our research design relies on the assumption that when individuals move their decisions of where to move are not motivated by any anticipated changes in their medical spending. More formally, we assume that conditional on moving, an individual’s decision of where to move is uncorrelated with changes in unobserved factors (such as health) that would affect their medical spending over time.
Estimating the Effect of Changes in Metro Area Spending Level on Individual Spending
We followed a discrete event study specification derived by Finkelstein et al. (2016) to estimate the effect of a change in the relative spending level of an individual’s metro area due to a move
Here,
Our coefficient of interest is captured by
Estimating the Effect of Changes in Metro Area Metro Area Price, Utilization Levels
Additionally, we study the degree to which the place-specific effect on individuals’ medical spending is driven by place-specific price and utilization levels. We modify Equation (1) to separately assess the causal effects of moving to a metro area with relatively higher (or lower) prices and utilization:
17
Here the coefficients of interest are
Results
Summary Statistics
Characterizing Movers: Demographics, Plan Characteristics, Health Care Spending
Table 1 includes summary statistics for movers and nonmovers, reflecting the sample averages 2 years prior to their “move.” 18 Our sample of movers included 71,101 individuals and the sample of nonmovers included 518,242 individuals. Within our analysis sample, movers and nonmovers had broadly similar levels of spending (prior to their moves) and resided in metro areas with similar health care spending, utilization, and price levels. 19 Our movers and nonmovers were composed of different demographic groups though and tended to be enrolled in plans with slightly different characteristics. In particular, movers tended to be younger. Just over one fifth of movers in each cohort were between 25 and 34 years old, while only about 10% of nonmovers were the same age. In contrast, a larger share of nonmovers were between 45 and 64 years old, just over one third, compared with movers, about one quarter. Additionally, enrollment in a high-deductible health plan was more common among movers, while nonmovers were more frequently enrolled in self-funded plans. We also find that the majority of movers (65%) experience changes in their plan enrollment over the course of our sample time period, which is only slightly higher than nonmovers (61%). 20
Descriptive Statistics Comparing Nonmovers, Movers.
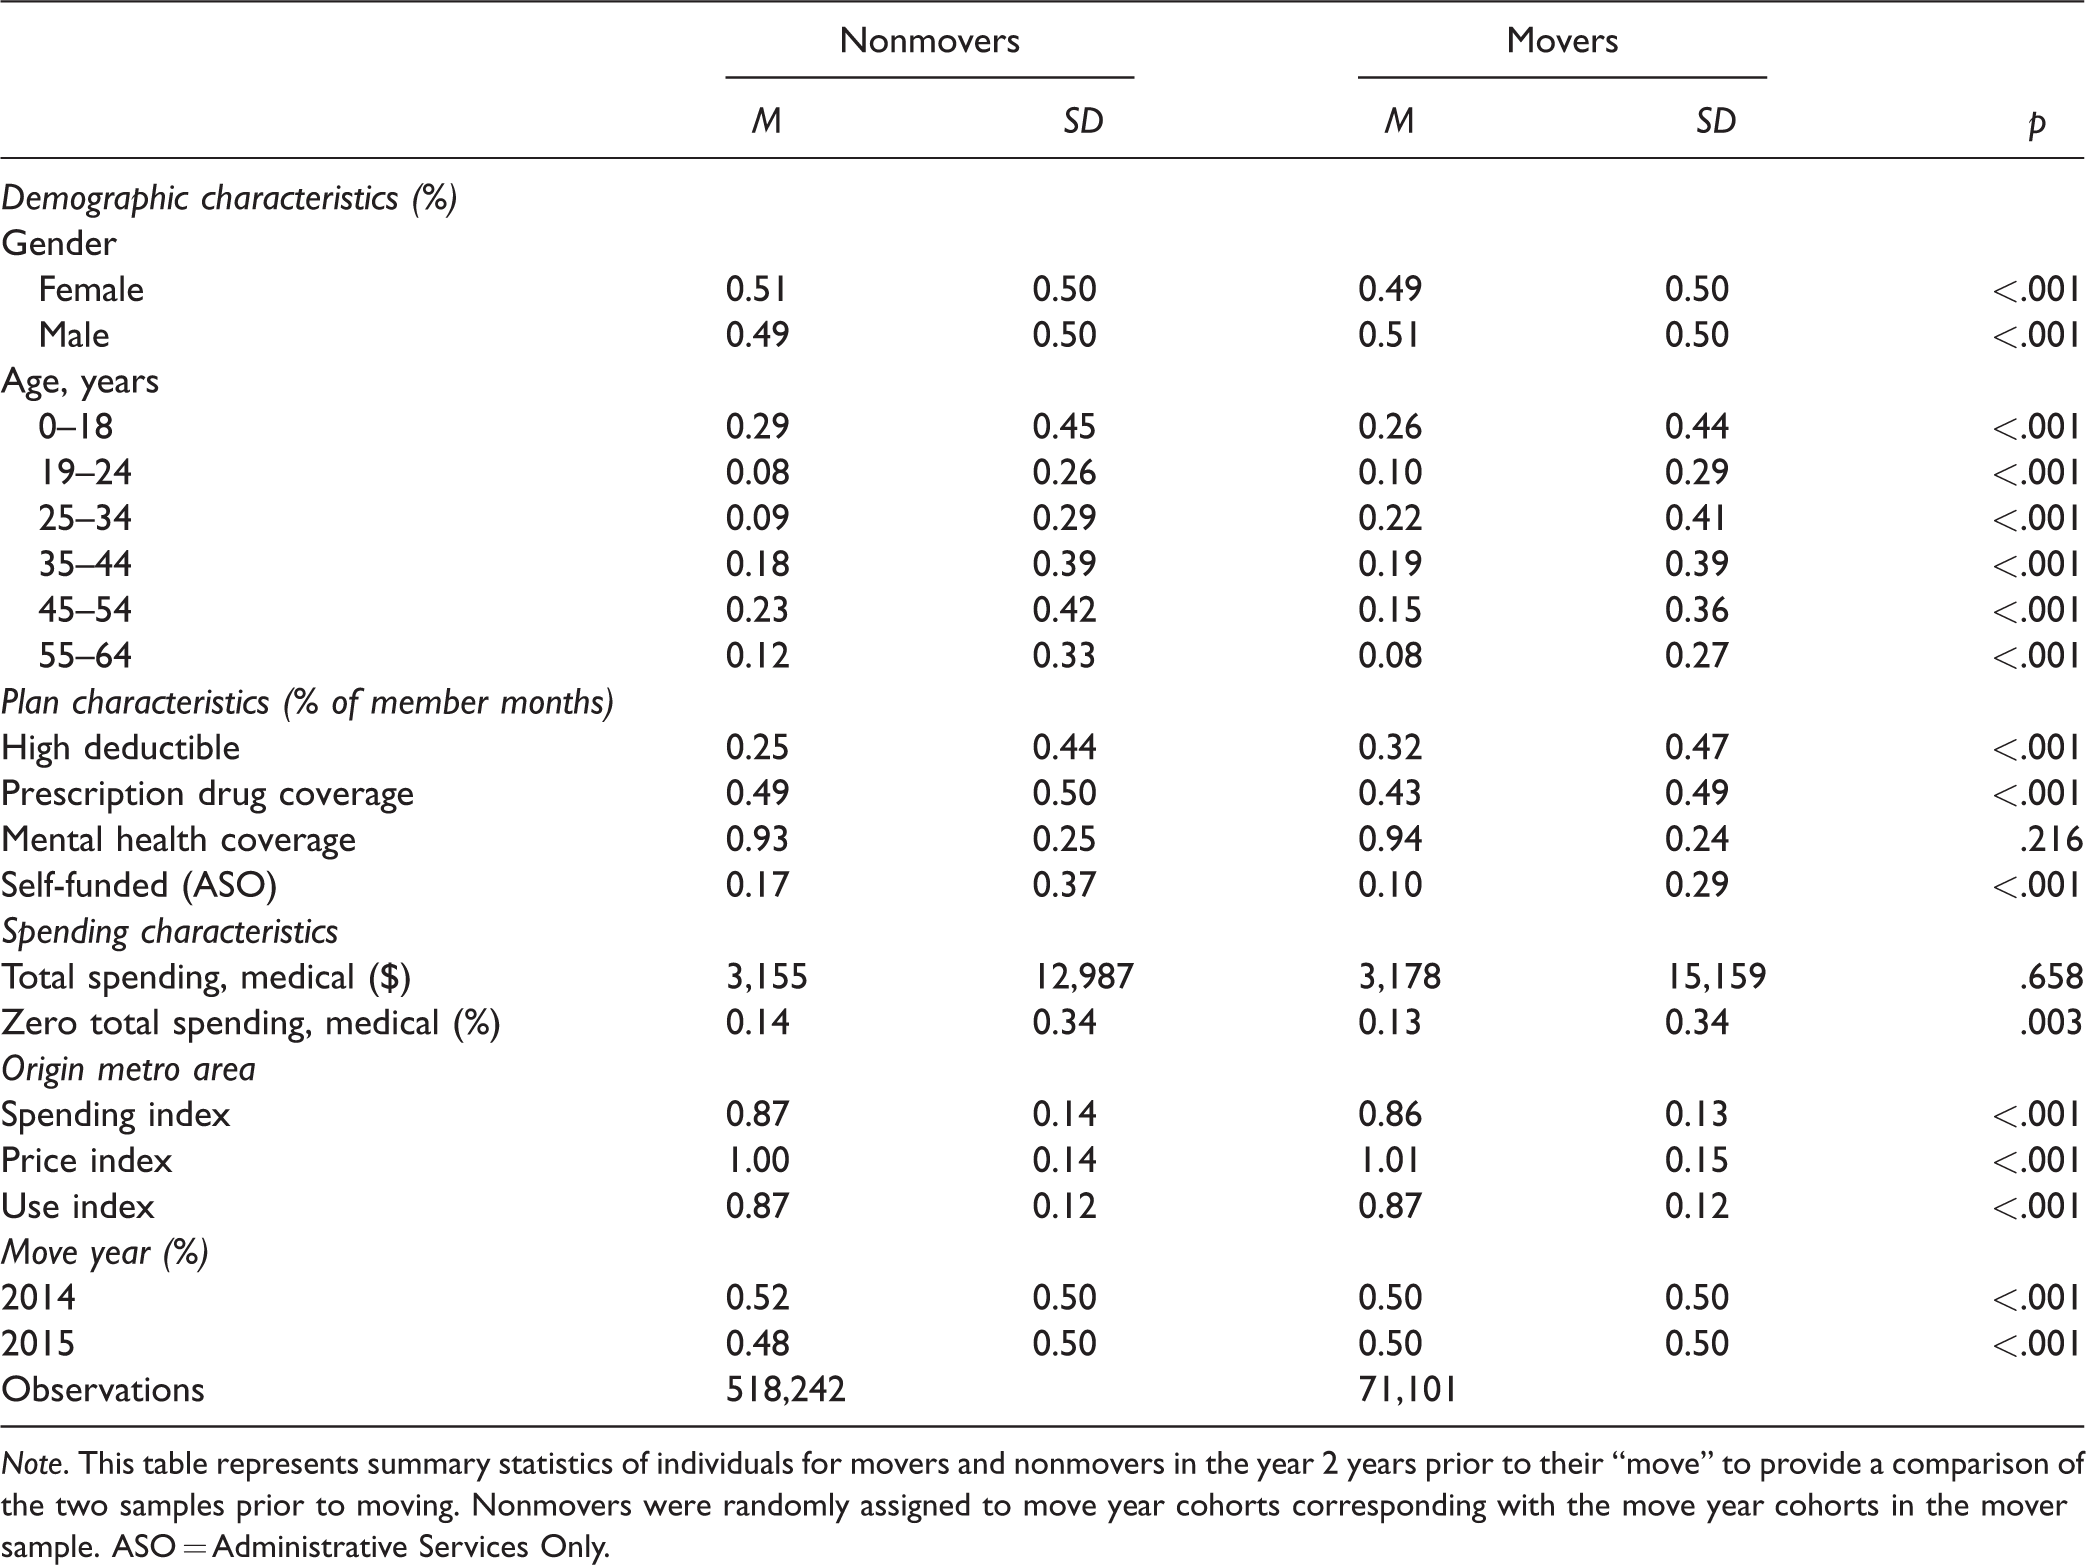
Note. This table represents summary statistics of individuals for movers and nonmovers in the year 2 years prior to their “move” to provide a comparison of the two samples prior to moving. Nonmovers were randomly assigned to move year cohorts corresponding with the move year cohorts in the mover sample. ASO = Administrative Services Only.
Identifying Variation: Difference Between Movers’ Origin and Destination Areas’ Relative Spending Levels
In general, differences in relative spending between movers’ destination and origin metro areas were relatively large. Figure 1 presents the distribution of percentage changes in individuals’ metro area spending index for our sample due to moves. The differences between movers’ destination and origin metro area spending levels appear to be relatively balanced around zero, meaning that individuals moved to both higher and lower spending areas, and did so at similar rates. The majority of our movers’ sample, across cohorts, experienced at least a 10% change in their metro area spending level on their move.
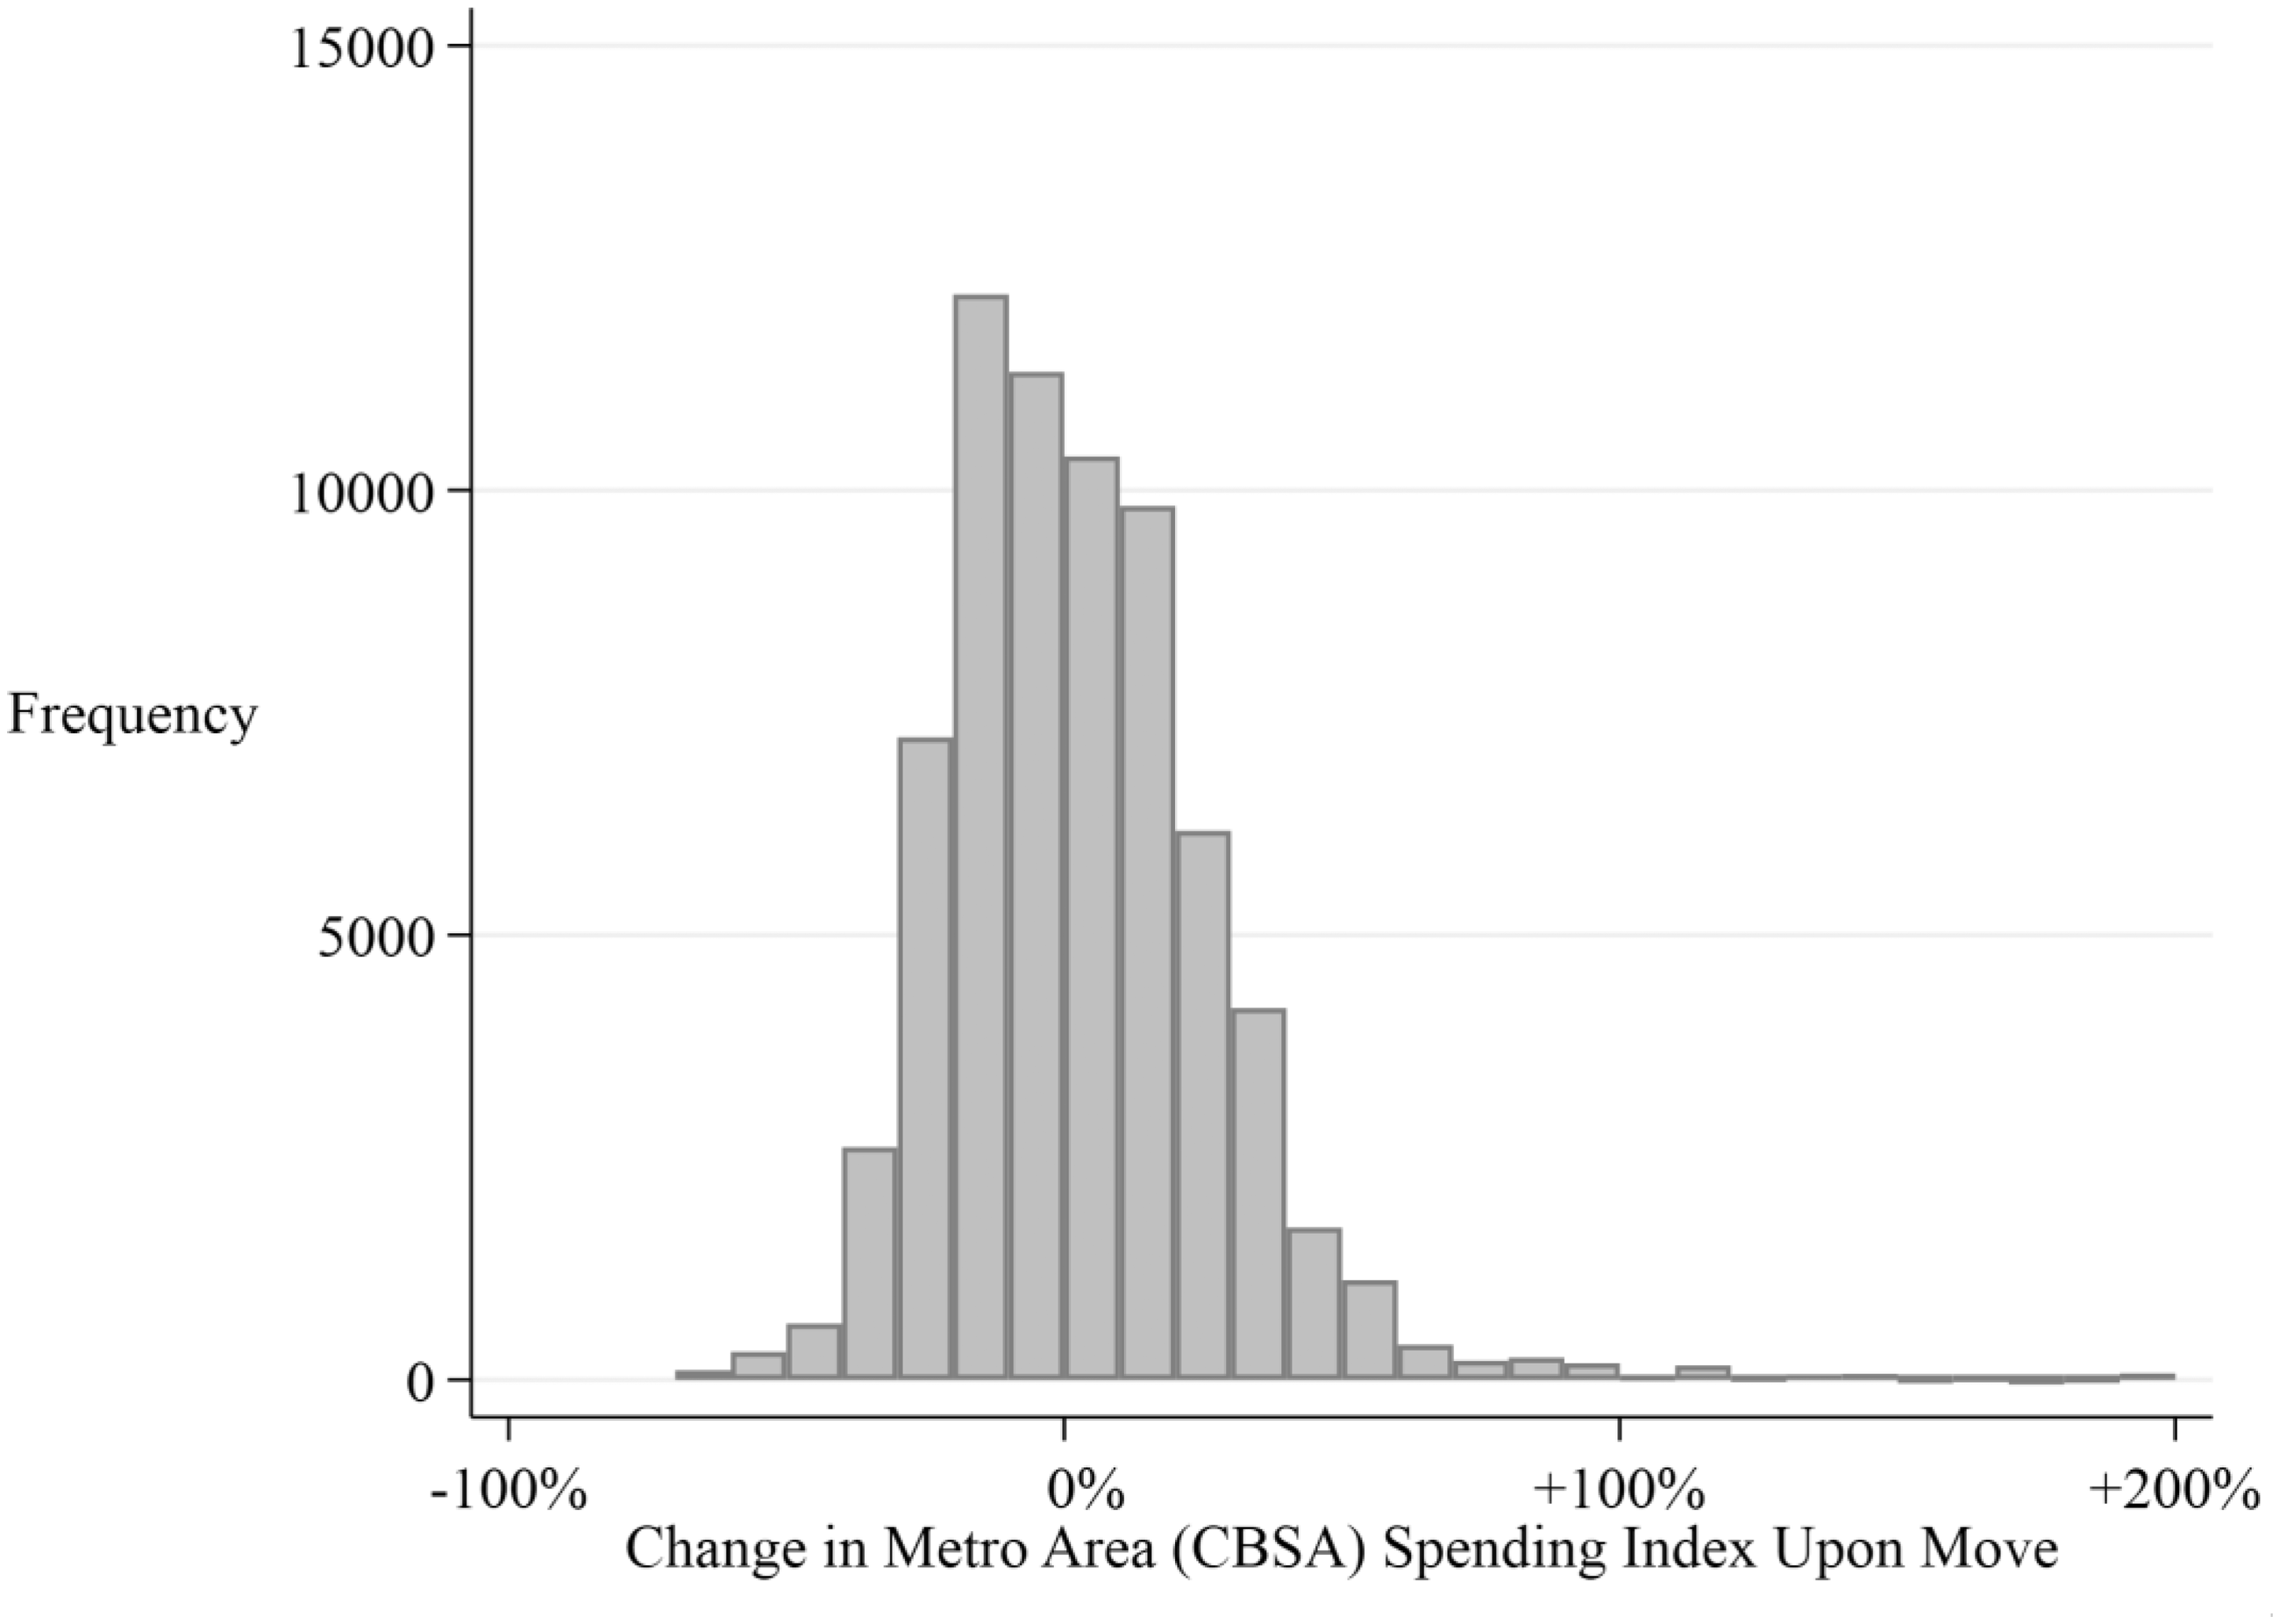
Distribution of percentage changes in metro area 5-year average spending index on move.
Support for Our Empirical Approach
As seen in Table 2, movers in our sample whose destination metro had relatively higher spending appear very similar to those whose destination metro has relatively lower spending—with nearly identical demographic and plan characteristics. 21 The one difference is that those who moved to relatively higher spending areas tended to have lower health care spending on average than those who move to relatively lower spending areas. This discrepancy, though, is mechanical: if one moves to an area with relatively lower (higher) health care spending their origin is likely an area with higher (lower) than average health care spending.
Descriptive Statistics Comparing Movers by Destination Metro Areas.
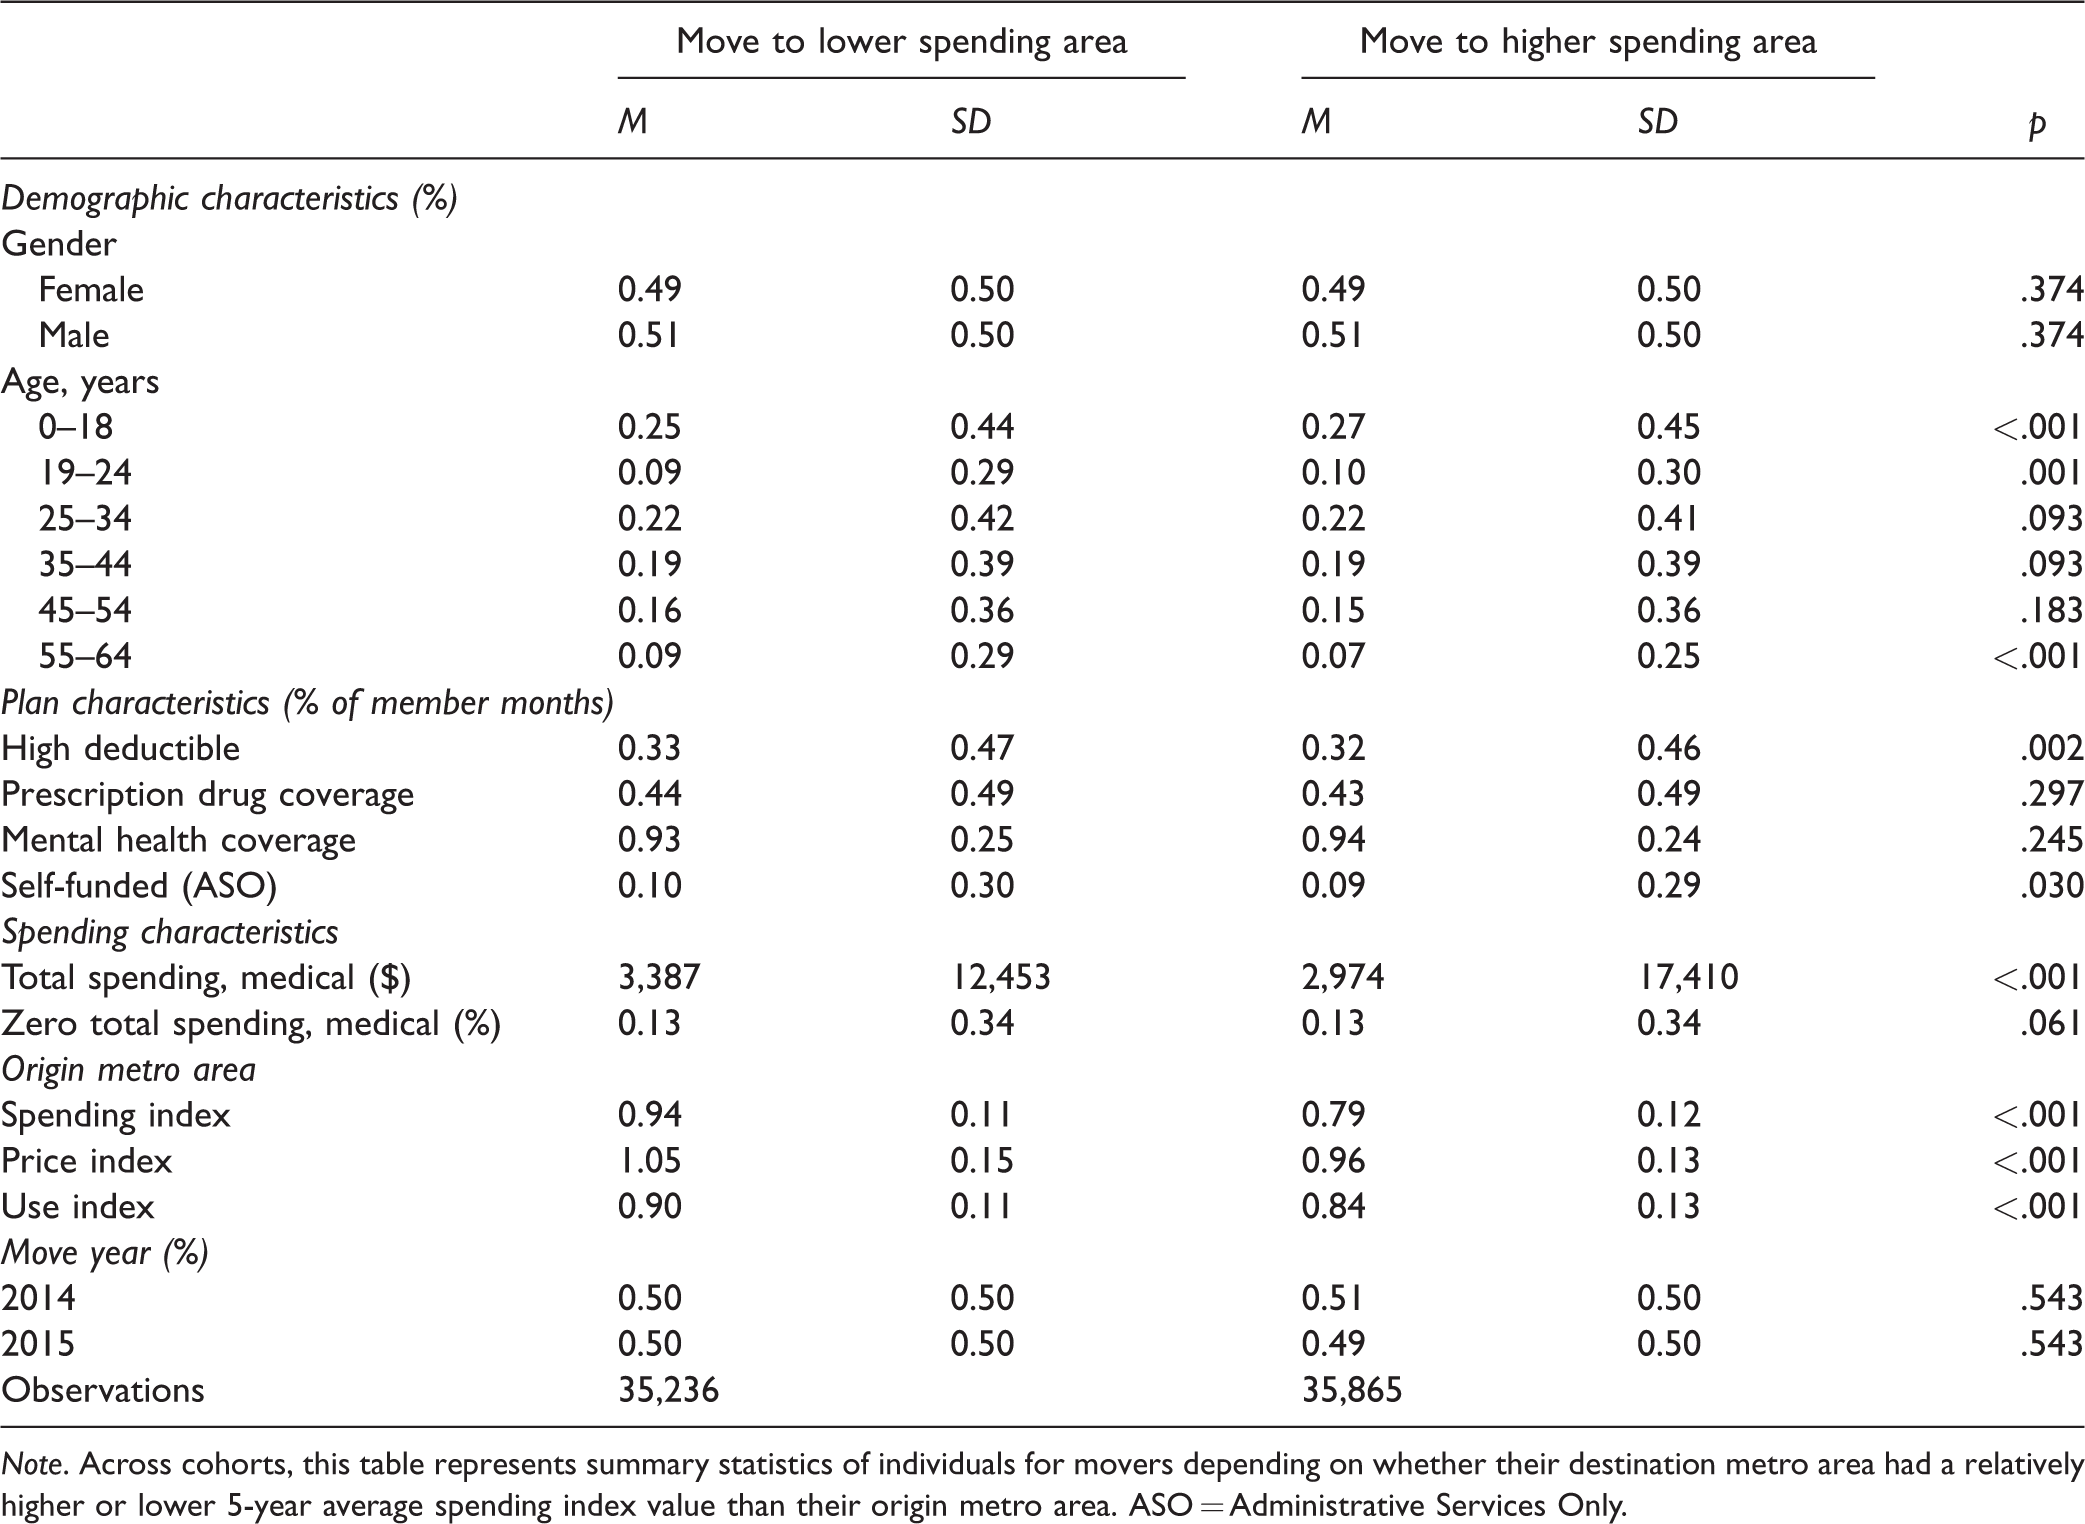
Note. Across cohorts, this table represents summary statistics of individuals for movers depending on whether their destination metro area had a relatively higher or lower 5-year average spending index value than their origin metro area. ASO = Administrative Services Only.
If individuals were moving disproportionately to areas with relatively higher or lower spending, we would expect a skewed distribution of changes between movers’ origin and destination spending levels. However, the distribution of changes in metro area spending levels on moving were balanced around a median of zero (Figure 1). As individuals may change plan characteristics over time, one potential concern is that individuals who change their plan enrollment may differentially move to relatively higher or lower spending metro areas. However, we find that this is not the case. The distributions of changes in metro area spending levels on moving were remarkably similar, whether we stratified our sample of movers by whether individuals maintained coverage through the same insurance plan or had any changes in their insurance plan characteristics over time (See Appendix Figure A1, available online). 22
Descriptive Evidence: Medical Spending Trends Before and After a Move
To provide intuition about the effect of moving on spending, we plotted per-person medical spending for movers over time. We split our sample of movers into those who moved to higher and lower spending areas to visualize whether they followed different trends in annual medical spending on moving (Figure 2). 23 For context, we also plotted per-person medical spending for nonmovers. As discussed previously, individuals who moved to relatively lower spending areas had higher spending on average prior to their move than those who moved to relatively higher spending areas. 24 This difference in spending prior to moving is consistent with the fact that it is more likely that one moves to a lower spending area if they were in a relatively higher spending area to start, and vice versa. Following their moves, though, there was no significant difference in medical spending between individuals who moved to relatively higher or lower spending areas. This suggests that individuals who moved to higher spending areas experienced relatively higher spending growth over time than those who moved to lower spending areas. While not causal, these figures provide some evidence of a relationship between moving to relatively higher (lower) spending areas and an increase (decrease) in an individual’s medical spending.
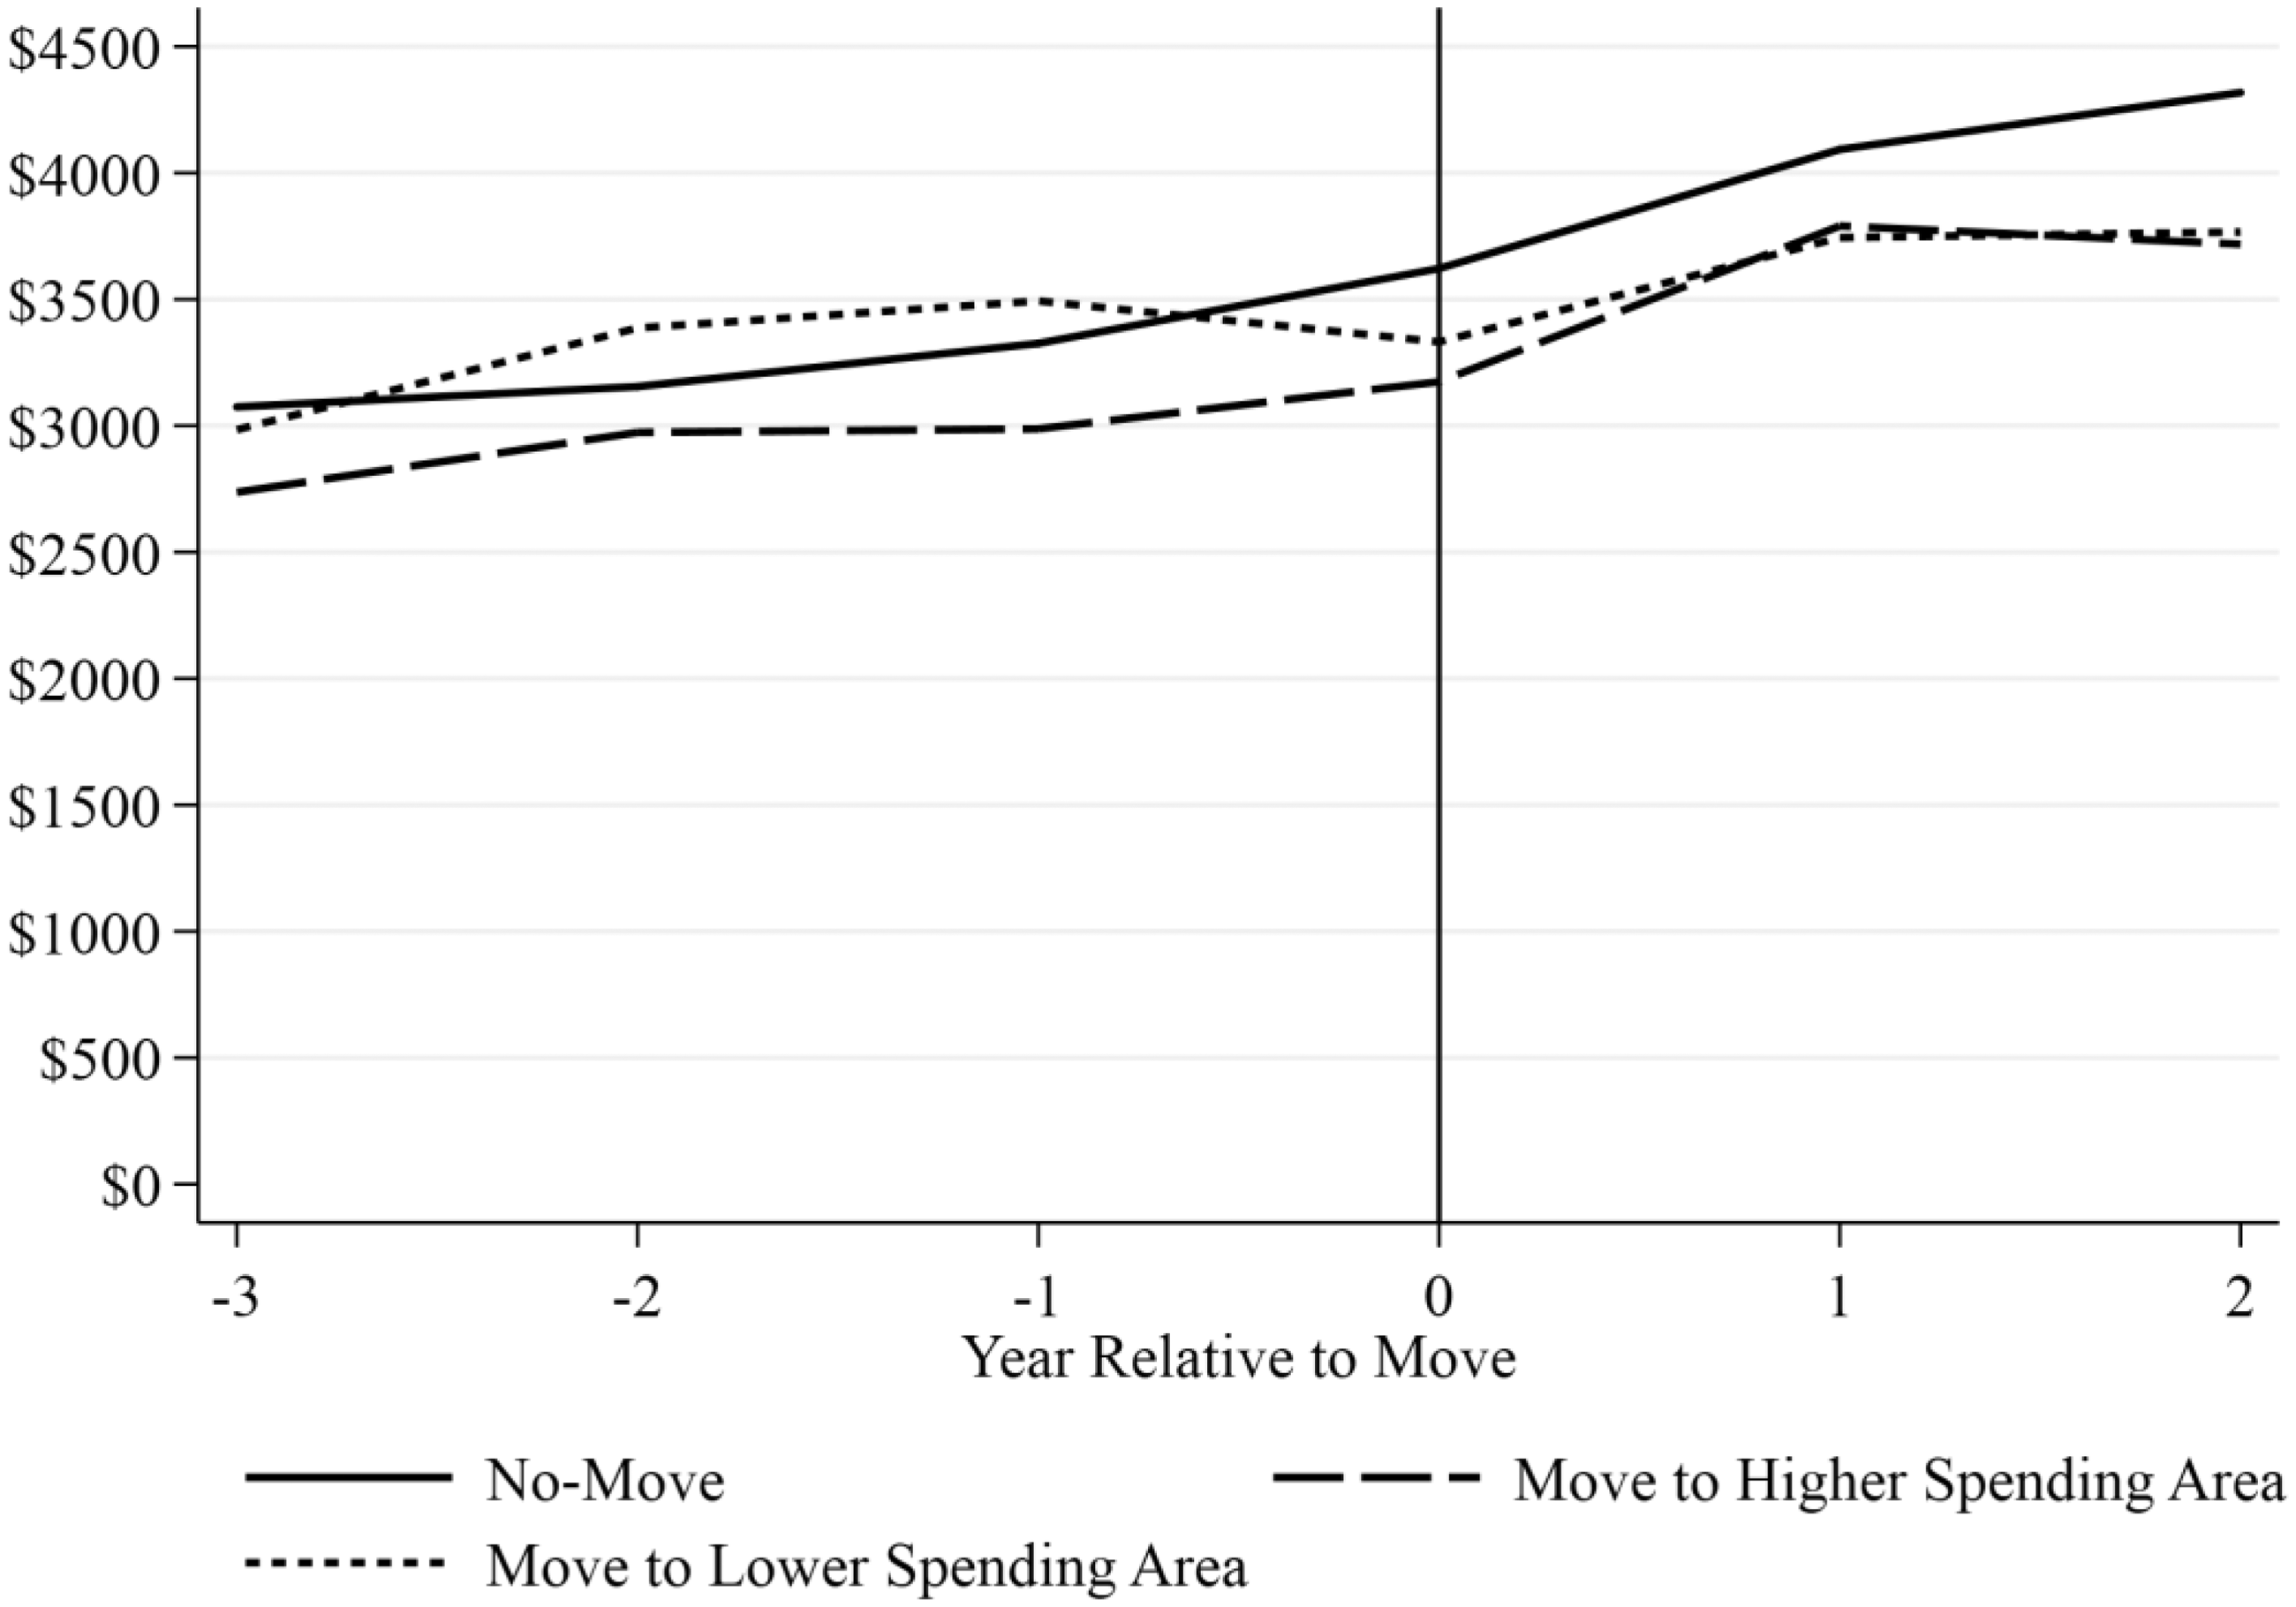
Per-person spending by year relative to move for individuals moving to relatively higher, lower spending metro areas.
The Causal Effect of Changes in Metro Area Spending Level on Individual Spending
We find a significant positive effect of moving to an area with higher (lower) spending on an individual’s medical spending (Table 3). Our coefficient estimate implies that an individual who moves to an area with 10% higher (lower) spending would experience a 4.2% increase (decrease) in their own spending on moving. 25 An alternative interpretation of our coefficient estimate, as discussed in Finkelstein et al. (2016), is that 42% of variation in health care spending among the commercially insured is attributable to variation in place-specific factors (with the remaining variation due to person-specific factors).
Discrete Event Study Analysis.
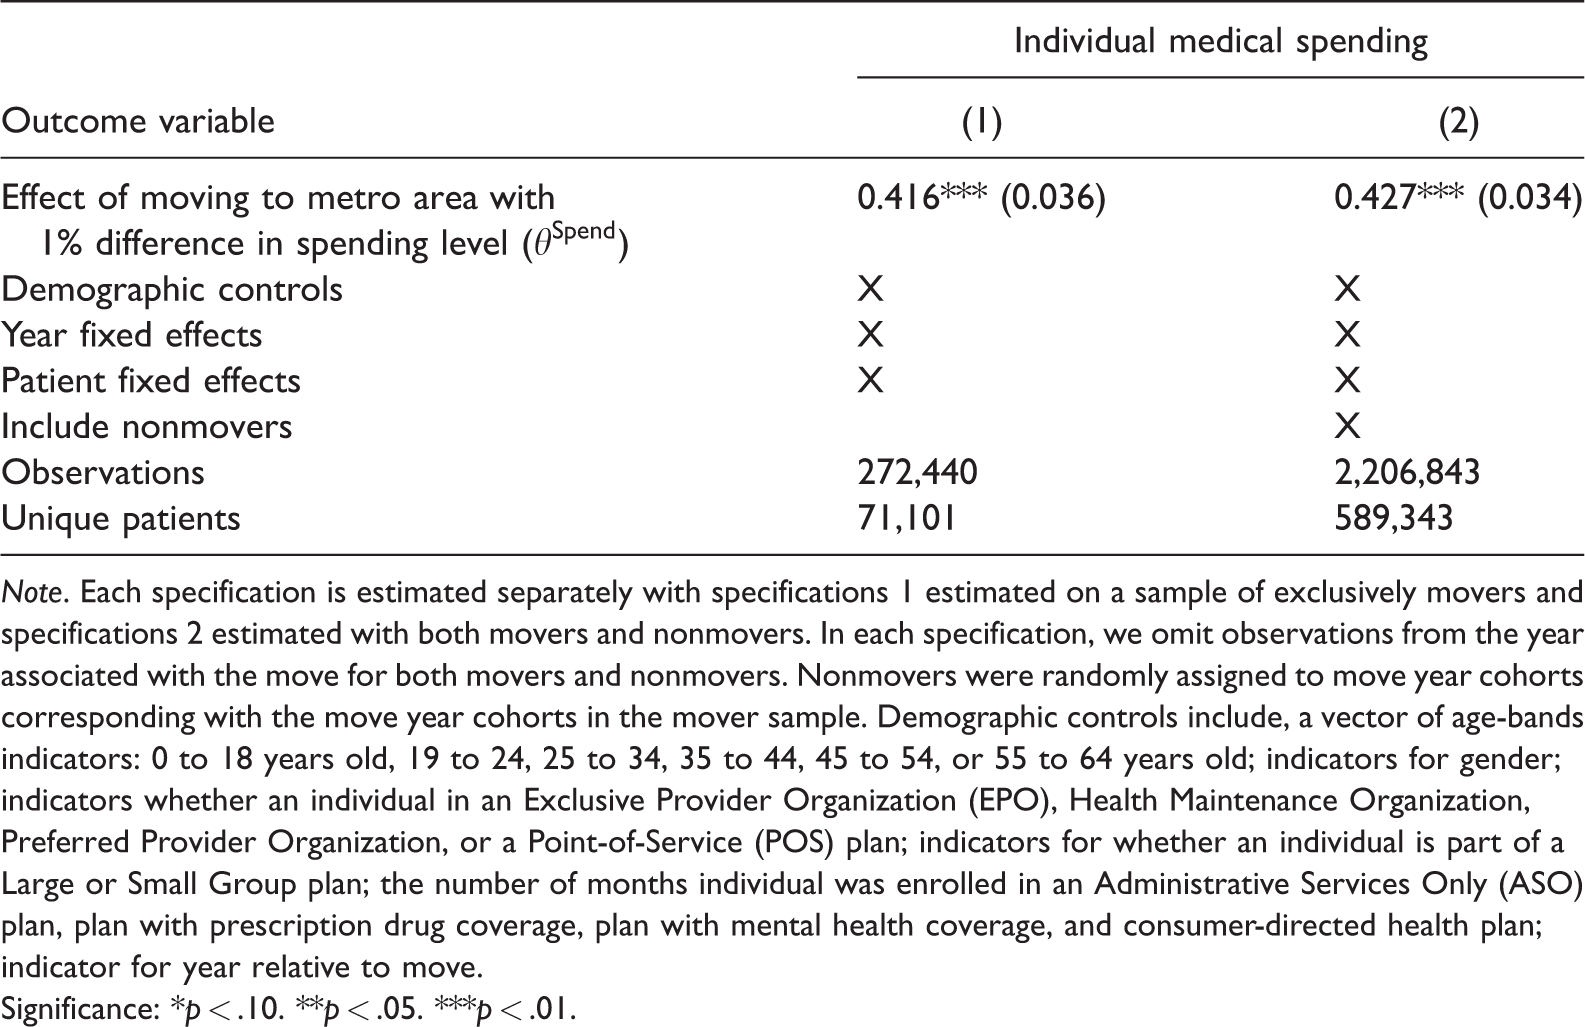
Note. Each specification is estimated separately with specifications 1 estimated on a sample of exclusively movers and specifications 2 estimated with both movers and nonmovers. In each specification, we omit observations from the year associated with the move for both movers and nonmovers. Nonmovers were randomly assigned to move year cohorts corresponding with the move year cohorts in the mover sample. Demographic controls include, a vector of age-bands indicators: 0 to 18 years old, 19 to 24, 25 to 34, 35 to 44, 45 to 54, or 55 to 64 years old; indicators for gender; indicators whether an individual in an Exclusive Provider Organization (EPO), Health Maintenance Organization, Preferred Provider Organization, or a Point-of-Service (POS) plan; indicators for whether an individual is part of a Large or Small Group plan; the number of months individual was enrolled in an Administrative Services Only (ASO) plan, plan with prescription drug coverage, plan with mental health coverage, and consumer-directed health plan; indicator for year relative to move.
Significance: *p < .10. **p < .05. ***p < .01.
Our estimate of the place-specific impact on spending is robust to alternatively specifying our event study to allow our coefficient on moving to vary by year relative to the move. In particular, we find coefficients that are not statistically different than those estimated using Equation (1), and we do not find a differential effect between either of the years following a move providing support for our discrete event study design. 26 To address the potential concern that our coefficient estimates may be biased by including movers who concurrently experience changes in their plan enrollment, we reestimate our primary specification on subsamples where we restrict to movers who maintain insurance coverage in the same plan through the duration of the sample. We find that our coefficient estimates are not statistically different from our baseline specification. We also find that our coefficient estimates are robust to restricting our sample to only male movers, and to restricting to movers in whose destination and origin metro areas the HCCI data set captures at least 25% of the commercial insurance market (Appendix Table A2, available online). Finally, our estimate of the place-specific impact on spending is similar if we measure differences in spending levels across metro areas using per-person spending (as in Finkelstein et al. 2016) rather than our spending index (Appendix Table A3, available online).
The Causal Effects of Changes in Metro Area Price and Use Levels on Individual Spending
We find a significant, positive (negative) effect of moving to an area with higher (lower) prices on an individual’s medical spending, and a separate significant, positive (negative) effect of moving to an area with higher (lower) health care utilization (Table 4). Our results suggest that an individual who moves to an area with 10% higher (lower) prices would experience a 5.1% increase (decrease) in their spending, all else equal. Similarly, our results imply that an individual who moves to an area with 10% higher (lower) utilization levels would experience a 3.6% spending increase (decrease), all else equal. While our coefficient estimates of the effect of changes in metro area price levels on move on individual spending is larger than the effect of changes in metro area utilization levels, the 95% confidence intervals for these estimates overlap. In other words, we cannot necessarily conclude that changes in metro area price levels on moving have a larger effect on medical spending than do changes in metro area use levels. These coefficient estimates were stable depending on whether we estimated our specification including nonmovers.
Place-Specific Effect of Metro Area Price and Use Levels.
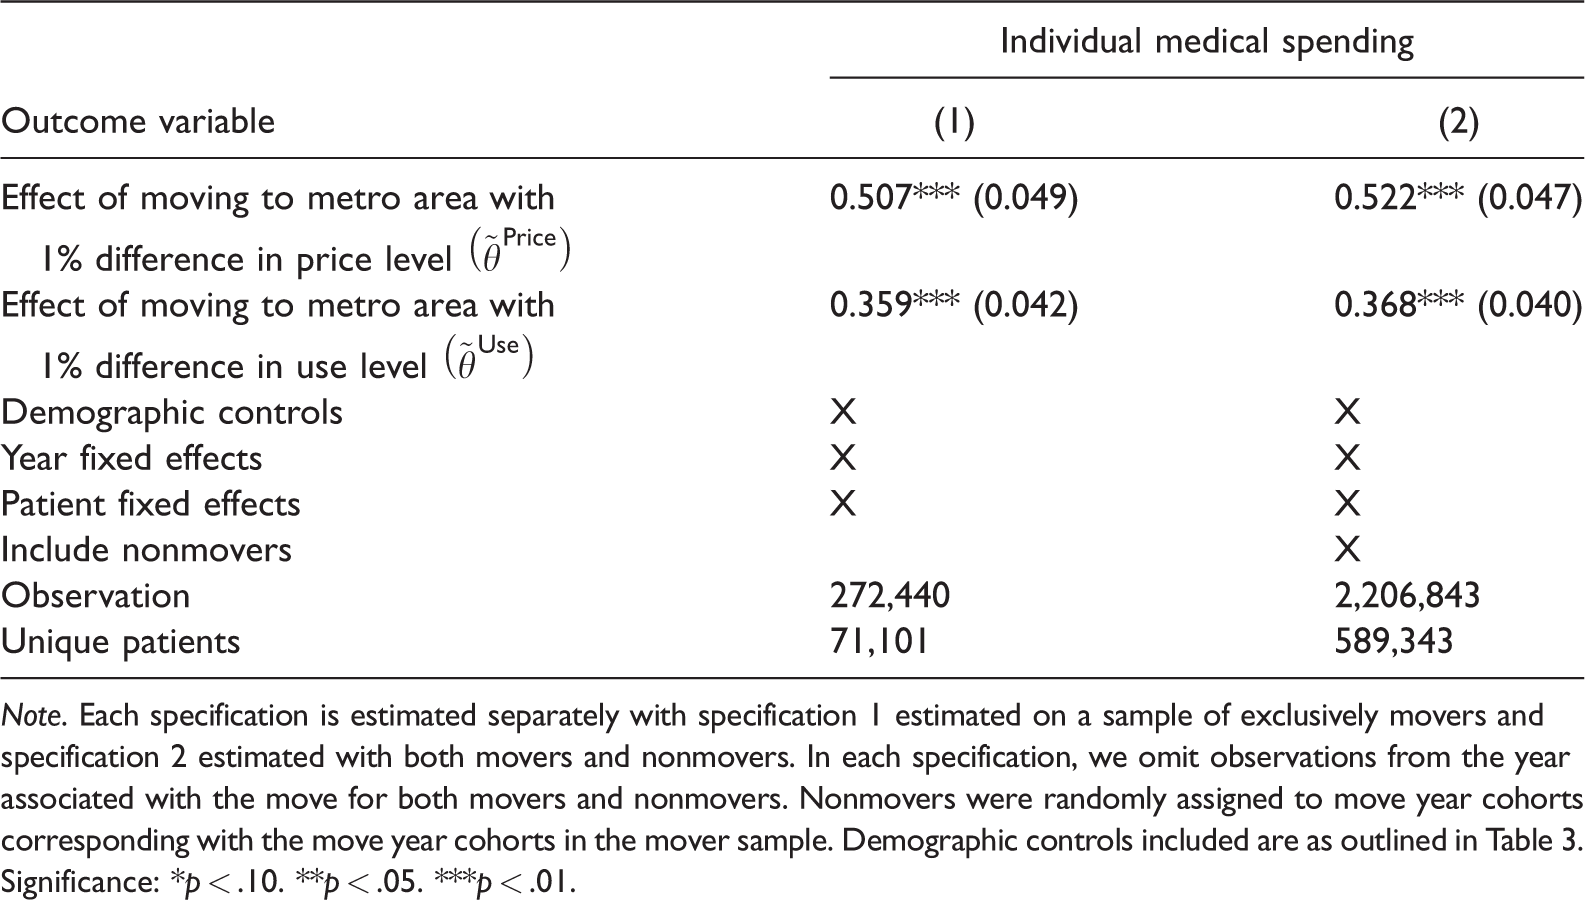
Note. Each specification is estimated separately with specification 1 estimated on a sample of exclusively movers and specification 2 estimated with both movers and nonmovers. In each specification, we omit observations from the year associated with the move for both movers and nonmovers. Nonmovers were randomly assigned to move year cohorts corresponding with the move year cohorts in the mover sample. Demographic controls included are as outlined in Table 3.
Significance: *p < .10. **p < .05. ***p < .01.
Discussion
We provide evidence that moving to an area with relatively higher (lower) health care spending causes an increase (decrease) in individual medical spending. Our results imply that almost half (42%) of variation in health care spending among the commercially insured across the United States is attributable to local, systemic factors. Our results replicate and extend previous findings in the Medicare (Finkelstein et al., 2016), near-elderly commercial populations (Abraham, 2018), and military (Luan et al., 2019) to the commercially insured population. Specifically, we show that place-specific impacts on spending are attributable to both price and utilization. In other words, we provide evidence that both price and utilization play a role in determining the place-specific impact on spending variation among the commercially insured population.
Compared with previous studies, our estimates imply that a smaller share of spending variation among the commercially insured is attributable to variation in place-specific factors than, for example, in the Medicare population (holding price variation constant). This is likely because our study is in the context of the commercially insured, where price, in addition to utilization, varies across geographic areas. As we show, the place-specific impact on individual spending is driven by both variation in place-specific price and utilization levels. Our findings also provide evidence that among the commercially insured population in some metro areas, there may be countervailing place-specific price and use effects on individual medical spending which somewhat attenuates the overall place-specific impact on spending (relative to, e.g., the Medicare context).
While outside the scope of this article, future work could build on our results to quantify the place-specific effects of different metro areas and further study the mechanisms through which the place-specific price and utilization levels impact spending in the spirit of Finkelstein et al. (2016) and Abraham (2018). For example, prices for the commercially insured are known to be influenced by local market characteristics, such as provider market power and resource capacity. Whether these have similar effects on spending, transmitted through their effect on prices, would be relevant for identifying policy levers to affect spending.
While this study extends previous efforts to identify the drivers of geographic variation in health care to the commercially insured population, there are some limits on the external validity of our findings. We rely on a sample of health care claims from three large national insurers that represents approximately one quarter of those covered by employer-sponsored health insurance. To the extent that utilization and prices, and by extension spending, is systematically different for individuals covered by these plans, our findings may not apply more generally, particularly in geographic areas that were not represented by our sample. Furthermore, these findings may not extend to those enrolled in individual market plans.
Additionally, we restrict our sample to individuals who were continuously enrolled over at least 4 years. Individuals who are able to maintain stable insurance coverage for this length of time are more likely to be healthier and have lower health care spending on average. It is possible that they may be differentially affected by place-specific factors driving health care spending than individuals who experience lapses in insurance coverage.
Another limitation is the exclusion of prescription drug spending from our outcome measure. This could be concerning if variation in prescription drug spending and utilization across geographic regions was directly or inversely correlated with variation in medical spending. However, analysis of these patterns among Medicare beneficiaries finds only a weak relationship between medical and prescription drug spending after accounting for patient characteristics (Zhang et al., 2010). Given the lack of data on manufacturer rebates, coupons, and other out-of-pocket assistance for prescription drugs and the inability to accurately measure drug spending as a result, we decided that excluding prescription drug spending was justified.
Despite potential limitations to the generalizability of the results, these findings improve our understanding of the drivers of geographic variation in health care spending and utilization. This is important to developing policy solutions aimed at reducing health care spending growth. Variation that arises from differences in patient preferences across regions illustrate the role of patient demand, while place-level characteristics suggest the influence of supply-side factors. Each have a different locus of control and so point to different sets of policy levers. For example, in locations where place-specific factors related to health care spending are primarily driven by an area’s health care prices, policy approaches such as more tightly regulating provider consolidation may have more potential to reduce health care spending growth. Alternatively, where place-specific factors related to health care spending are primarily driven by an area’s health care use patterns, it suggests policy levers such as those aimed at reducing unnecessary or duplicative care, may have more promise.
Supplemental Material
sj-pdf-1-mcr-10.1177_1077558720926095 - Supplemental material for Sources of Geographic Variation in Health Care Spending Among Individuals With Employer Sponsored Insurance
Supplemental material, sj-pdf-1-mcr-10.1177_1077558720926095 for Sources of Geographic Variation in Health Care Spending Among Individuals With Employer Sponsored Insurance by William C. Johnson and Jean Fuglesten Biniek in Medical Care Research and Review
Footnotes
Author’s Note
Both authors are thankful to their employer, the Health Care Cost Institute (HCCI), for providing the data necessary for this study.
Acknowledgments
We are grateful for helpful comments and suggestions from Caitlin Carroll, Elliot Isaac, Sayeh Nikpay, and other participants at the ASHEcon 8th Annual Conference (Washington, DC, 2019) as well as our Health Care Cost Institute (HCCI) colleagues. We acknowledge assistance from HCCI and its data contributors in providing the data analyzed. All opinions, findings, and conclusions expressed are those of the authors. All remaining errors are our own.
Declaration of Conflicting Interests
The author(s) declared the following potential conflicts of interest with respect to the research, authorship, and/or publication of this article: The Health Care Cost Institute has received funding and data from Aetna, Humana, Kaiser Permanente, and UnitedHealth Group (UHG). Those entities had no input into the design or implementation of this analysis.
Funding
The author(s) disclosed receipt of the following financial support for the research, authorship, and/or publication of this article: This research received partial financial support from the Robert Wood Johnson Foundation (Continuing the Healthy Market Place Index, #75321).
Supplemental Material
Supplemental material for this article is available online.
Notes
References
Supplementary Material
Please find the following supplemental material available below.
For Open Access articles published under a Creative Commons License, all supplemental material carries the same license as the article it is associated with.
For non-Open Access articles published, all supplemental material carries a non-exclusive license, and permission requests for re-use of supplemental material or any part of supplemental material shall be sent directly to the copyright owner as specified in the copyright notice associated with the article.