
Abstract
Use of the term people of color has grown. What factors do Americans weigh to classify others as people of color (PoC)? An original, preregistered conjoint experiment with two samples reveals that ancestry is the strongest predictor of classification as PoC. Self-identified race/ethnicity and phenotype also matter, though not as strongly. The results also refute the notion that all non-White Americans count equally as PoC: profiles with Black parents are most likely to be classified as PoC, and those with Asian parents are least likely. Classification works similarly across respondents of different ethnoracial backgrounds, with one exception: Asian American respondents are equally likely to classify profiles with Black, Asian, Latino and Middle Eastern or North African parents as PoC. The results indicate a general consensus around who counts as a “person of color.”
Fast growing Latino and Asian American populations are reconfiguring U.S. racial and ethnic demographics. Against this backdrop, a growing number of Americans identify as people of color (PoC) (Pérez 2021), a term that has reemerged in academic and everyday discourse (Starr 2022). Today, about 95 percent of Black Americans identify as PoC, as do sizable shares of Asian and Latino Americans (Starr and Freeland 2024).
How do people decide whom to classify as a person of color? Research suggests that some non-White Americans, especially Black Americans, are seen as more prototypical PoC than others (Pérez 2021; Starr and Freeland 2024); further, skin color seems to be an important qualification for membership in the PoC category (Pérez 2021). When it comes to deciding who is a PoC, how do ethnoracial background and skin color stack up against each other and against other attributes, such as religion? Furthermore, what matters more for PoC classification, 1 someone’s ancestry or how they themselves identify? Finally, are people from some non-White backgrounds—for example, those who have Black parents—more likely to be viewed as PoC than people from other non-White backgrounds—for example, those who have Asian parents?
The answer to this last question in particular may hint at the future of the U.S. racial hierarchy. Will the boundaries of Whiteness expand to include Latino Americans, Asian Americans, and other non-White and non-Black Americans (e.g., Yancey 2003)? Or will “new Americans” come to occupy an intermediate position in a new, triracial hierarchy (Bonilla-Silva 2002)? The future hierarchy depends not only on non-White and non-Black Americans’ individual attitudes and achievements but on how they are seen and classified by others. “People of color,” an identity category with ethnoracial and political undertones (Pérez 2021), is a valuable site for exploring these questions.
In this article, we report the results of a preregistered conjoint experiment with two race-stratified samples (total n = 2,735) of White-, Black-, Latino-, and Asian-identified respondents. Each respondent saw 10 profiles; for each, they reported how strongly they agreed that the profile was a person of color. Profile attributes encompass factors that have been theorized or shown to affect ethnoracial classification, including ancestry, phenotype (specifically skin color), self-identification, socioeconomic background, religion, and language.
Not all of these attributes have been examined empirically. Most notably, and despite theoretical work on the multiple dimensions of race (Roth 2016) and the reciprocal relationship between them (Jenkins 2008), prior empirical work has largely overlooked the effect of a person’s own identification on how others classify them. Nor has it compared the effect of self-identification to the effects of other important factors, like ancestry or skin color (for recent exceptions, see Ghoshal 2025; Abascal et al., 2025a).
To anticipate our findings, ancestry, as signaled by parents’ background, matters most for classification as a person of color. Skin color and self-identification also matter, but less so than ancestry. We also find that profiles with Black ancestry are more likely to be classified as PoC than those with Latino or Middle Eastern and North African (MENA) ancestry, which are more likely still to be classified as PoC than those with Asian ancestry. These results are consistent with the interview findings of Pérez (2021). They also imply that Americans may view the racial hierarchy as being more nuanced than even Bonilla-Silva’s (2002) triracial pigmentocracy. White Americans are at one end and Black Americans at another. But between them, Latino and MENA Americans are seen to occupy a different position, one closer to Black Americans, than do Asian Americans.
Finally, and contrary to the expectation implicit in our race-stratified sampling design, we do not find large disagreements between White-, Black-, Latino-, and Asian-identified Americans in terms of which factors they use to classify others either as PoC. This is despite documented gaps by race on related issues like affirmative action in college admissions (Gramlich 2023) and diversity, equity, and inclusion initiatives in the workplace (Minkin 2024). Americans may disagree about the politics of PoC identity, but they largely agree on who belongs in the category.
Together, our questions and findings contribute in key ways to research on PoC identity specifically and on ethnoracial classification broadly. First, whereas prior research has focused on the political correlates of self-identifying as PoC (Matos, Greene, and Sanbonmatsu 2023; Pérez 2021; Starr and Freeland 2024), we identify which factors predict whether someone is seen as PoC by others. These factors overlap considerably with those used to classify people as members of specific ethnoracial groups. In particular, our findings underscore the importance of ancestry, followed by phenotype and self-identification for classification. In so doing, they add to a growing consensus regarding the interdependence of the multiple dimensions of race.
We start by reviewing the rise of PoC identity before turning to the broader literature on ethnoracial classification.
“People of Color”: The Rise of a New Ethnoracial Identity
The meaning of people of color has shifted over time. The term emerged during slavery to describe an intermediate social category of free, mixed-race people and was replaced by the term colored at the end of slavery (Starr 2022). “People of color” reemerged as a category in the 1970s, when progressive and feminist Black social movements sought to build interracial coalitions that included Latinos, Asian Americans, and indigenous people (Matos et al. 2023; Starr 2022). Today, people of color is widely used in the United States and largely understood to describe non-Whites. The use of people of color in American news media has been especially high since 2020, the year of George Floyd’s murder and Black Lives Matter protests. In that year, 15 of every 1,000 news articles about people included either people of color or person of color. 2 Books also increasingly use people of color and person of color, as Figure A1 in the Appendix illustrates. The terms even appear in public-facing documents from federal agencies, including the Centers for Disease Control and Prevention and the National Institutes of Health (NIH; e.g., see the NIH Style Guide in reference to race and national origin terminology; NIH 2025).
Although people of color is widely used, questions remain about its boundaries as a source of personal identification and external classification. Pérez (2021) argued that “people of color” is a salient and meaningful identity category, distinct from yet related to other ethnoracial categories. Pérez found that people who identify as PoC express greater support for their ethnoracial in-group (e.g., other White Americans, Black Americans), particularly if they believe that their in-group faces discrimination (also see Matos et al. 2023). Furthermore, people who report that being PoC is more important to them are also more likely to favor social and political proposals that improve the wellbeing of ethnoracial minorities (Pérez 2021). At the same time, PoC identity is not salient in all settings or at all times: for example, Pérez found that solidarity with other PoC wanes when respondents are prompted to think about their own ethnoracial group’s unique struggles.
Scholars have only recently begun to consider what qualifies one as a PoC, and research suggests that membership is not equally available to all Americans who identify as not White. Results from an implicit association test with undergraduate students indicates, on one hand, that the term people of color is associated with African Americans, Latinos, and Asian Americans (Pérez 2021). On the other hand, African Americans are perceived as more central to the PoC category, whereas Asian Americans are seen as more peripheral.
Starr and Freeland (2024) asked respondents to rate how welcome different kinds of people (e.g., a Black person, a Black Puerto Rican person, a Chinese person) would be at a workplace meeting called for PoC. In general, respondents reported that Black, Black Puerto Rican, and Navajo employees would be the most welcome (in that order). However, Asian Americans had the most expansive understanding of the PoC category, and they were the mostly likely to report that non-Black minorities would be welcome at the meeting. Black respondents, by contrast, had the most restrictive understanding: they were the least likely to report that non-Black minorities would be welcome.
Patterns of PoC self-identification mirror these results. For example, the vast majority of non-Latino Black Americans (95 percent) identify as PoC, compared with just 61 percent of Asian American and Pacific Islanders and 45 percent of Latinos (Starr and Freeland 2024). 3 Notably, among Latinos, PoC identification is correlated with racial identification: Black-identifying Latinos are more likely than White-identifying Latinos to identify as PoC (Matos et al. 2023; Starr and Freeland 2024).
Like non-White identification, skin color appears to be an important qualification for membership in the PoC category. Pérez’s (2021) interview respondents reported that darker skin tones and phenotypes associated with non-Whiteness are key markers that determine whether one is a “typical PoC” or instead “fits less well within its borders” (p. 36). In addition, respondents consider a sense of solidarity with other PoC and a sense of being discriminated against or excluded, particularly with respect to Whites.
Starr and Freeland (2024) further examined mismatches between PoC self-identification and reflected appraisals (how people think others classify them). Among Black Americans who identify as PoC, approximately one in eight report that others do not or might not see them as PoC. This number is larger among Asian and Latino Americans who identify as PoC. Most of these respondents report that whether others see them as PoC “depends on circumstances and how I present myself,” which, Starr and Freeland contend, suggests that people “see themselves as having a degree of agency” when it comes to PoC classification (p. 12).
Our study builds in key ways on the growing line of work on PoC identity. First, we consider whether specific dimensions of ethnoracial identity—specifically, ancestry and self-identification—independently affect the likelihood that someone is classified as PoC. Is it enough, for example, for someone to say that they are Black in order to be counted as PoC? Second, we compare the effects of ancestry and self-identification to those of skin color and other traits, like religion. A conjoint experimental design allows us to isolate the causal effect of each attribute from those of other attributes that are correlated in the real world, such as socioeconomic background. Finally, we compare the attributes that Americans of various ethnoracial backgrounds themselves use to classify others as PoC.
Earlier work leads us to expect that people will classify as PoC those who are identified as non-White: Black, Latino, Asian, or MENA, whether through ancestry or self-identification (Pérez 2021; Starr and Freeland 2024). However, among non-Whites, people will be most likely to classify as PoC people who have Black ancestry; they will be least likely to classify as PoC people who have Asian ancestry. Furthermore, Starr and Freeland’s (2024) results predict that Black Americans will define the PoC category more narrowly than Asian Americans. Finally, Pérez’s (2021) undergraduate interviewees suggest that phenotype, specifically skin color, will affect PoC classification.
The Changing U.S. Racial Hierarchy
Although our primary goal is to understand PoC classification given widespread usage of the term, our analyses also shed light on how Americans view the U.S. racial hierarchy, seen through the lens of how they classify others. Scholars have speculated about the future of the U.S. racial hierarchy given the growing number of Americans who identify as non-White and non-Black or as multiracial (Bonilla-Silva 2002; Gans 2019; Lee and Bean 2010; Sanjek 1994; Yancey 2003). Three general theses have been proposed.
First, scholars such as Sanjek (1994) argued that White/non-White will become the most consequential line of division as Black Americans and other non-White Americans coalesce around shared experiences of discrimination and exclusion. Research by Craig and Richeson (2012), for example, shows that Latino and Asian Americans primed to think about discrimination toward their own groups express more positive attitudes toward Black Americans. This thesis has been termed the “PoC hypothesis,” because it predicts that “discrimination should produce strong ethnic group consciousness and group-interested political preferences among all ‘people of color’” (Sears and Savalei 2006:898).
By contrast, other scholars argue that Black/non-Black is and will remain the principal dividing line. Yancey (2003) and Gans (2019) made this point most directly, invoking the historic expansion of the White category to include Southern European and Eastern European immigrants in the first half of the twentieth century (though see Fox and Guglielmo 2012). This thesis, and especially Yancey’s formulation, assumes that most Latino and Asian Americans have light phenotypes that will allow them to assimilate into Whiteness (Golash-Boza 2003).
Finally, Bonilla-Silva (2002) argued that the United States will move beyond a two-tiered racial hierarchy to a triracial pigmentocracy resembling Latin America. According to the so-called Latin Americanization thesis (Bonilla-Silva 2002:3), light-skinned Latinos and Americans of East Asian or Middle Eastern origin will permanently occupy an in-between position as “honorary Whites” (Bonilla-Silva 2002:4).
Empirically, the question of which setup the United States is converging on has been explored in two ways. The first approach looks at behavioral traces of boundary-crossing, including intermarriage and residential integration (Lee and Bean 2010; Yancey 2003). The second approach looks at the identities and attitudes expressed by Latino and Asian Americans themselves (Craig and Richeson 2012; Forman, Goar, and Lewis 2002; Sears and Savalei 2006). Analyzing attitudes toward Black Americans among White, Black and Latino respondents, for example, Forman et al. (2002) concluded in favor of the three-tiered Latin Americanization thesis, with qualifications.
Racial attitudes and behavioral achievements, like residential integration, are no doubt valuable windows into the U.S. racial hierarchy. Another one, however, is how Americans themselves view this hierarchy, and classification as “people of color” is one lens. To what extent do Americans of different racial backgrounds think that people with Black, Latino, Asian, or MENA credentials (whether ancestry or self-identification) should count as PoC, that is, as members of an identity category that implies shared experiences with political implications (Pérez 2021)? Our findings can begin to shed light on this question.
Determinants of Ethnoracial Classification
A rich literature explores the determinants of ethnoracial classification. Although this literature focuses on classification into specific ethnoracial categories (e.g., White or Black), rather than as a person of color, its insights may be generally applicable. Overall, this work demonstrates that ethnoracial classification depends on characteristics of the person being classified (the target), characteristics of the person classifying them (the observer), and characteristics of the situation in which classification is taking place.
Target Characteristics
Research in the United States has documented the important role of ancestry for racial classification. Historically, classification as White or Black followed the principle of hypodescent or the “one-drop rule,” which dictates that people of mixed Black and White ancestry are categorized as Black (Davis 1991). Americans today are still more likely to classify people with White and Black ancestry as Black (Chen et al. 2018; Ho, Kteily, and Chen 2017; Ho et al. 2011; though see Schachter, Flores, and Maghbouleh 2021). Black Americans themselves draw on Black ancestry to decide whether someone is Black (Roberts, Bareket-Shavit, and Wang 2021). Ancestry also matters for classification beyond the Black–White binary, including for classification as Asian (Ho et al. 2011), as MENA (Maghbouleh, Schachter, and Flores 2022), and as Latino (Huang 2023).
Racial classification also draws on physical appearance and skin color in particular (Chen et al. 2018; Feliciano 2016; Stepanova and Strube 2012). People can learn at very young ages to pay attention to skin color; when asked to classify strangers as Black or White, American children rely on skin color more than they rely on other facial features (Dunham et al. 2015). Notably, when asked to classify strangers as Asian or White, American children rely on both skin color and facial features (Dunham et al. 2016). More broadly, Schachter et al. (2021) found that skin tone is a strong predictor of White and Black classification but a weaker predictor of Asian, Native, or Hispanic classification.
Other research points to the importance of race-stereotyped traits, such as socioeconomic status (Freeman et al. 2011), aggressiveness (Miller, Maner, and Becker 2010), and even cause of death (Noymer, Penner, and Saperstein 2011) for racial classification. Racial classification may also be affected by target religion and language (Schachter et al. 2021). Research has yet to investigate whether or how external classification is affected by self-identification (for recent exceptions, see Ghoshal 2025; Abascal et al., 2025a). Nevertheless, sociologists have repeatedly theorized a reciprocal relationship between the “multiple dimensions of race,” including between how others classify you and how you identify yourself (Roth 2016; also see Jenkins 2008). As Jenkins (2008) explained, “Individual identity is located within a two-way social process, an interaction between ‘ego’ and ‘other,’ inside and outside. It is in the meeting of internal and external definition that identity, whether collective or individual, is created” (p. 60).
Indeed, prior research shows that multiracial Americans invoke how others classify them—or, more accurately, how they think others classify them—to explain how they themselves identify racially (Khanna 2004, 2010; Rockquemore and Brunsma 2002). Their work draws on the social psychology of reflected appraisals, that is how others think they are seen by others (Cooley [1902] 1922; Mead [1934] 1962). This study explores how target self-identification, along with ancestry, skin color, socioeconomic background, language, and religion affect classification as a “person of color.”
Observer and Situation Characteristics
Hypodescent is understood to reinforce existing status hierarchies (Ho et al. 2013; Krosch et al. 2013), as does the more general tendency to classify ambiguous people with lower status outgroups, a phenomenon known as the “ingroup overexclusion effect” (Castano et al. 2002). As a result, certain kinds of people (e.g., prejudiced people) facing certain kinds of situations (e.g., those that induce status threats) should be more likely to classify ambiguous others as outgroup members. As Castano et al. (2002) explained, “Highly prejudiced and highly identified individuals may share the same motivation, namely to avoid ‘contaminating’ the in-group with out-group members” (p. 316).
Supporting this thesis, research finds that White Americans who identify strongly as White are relatively more likely to classify ambiguous faces as Black (Castano et al. 2002; Knowles and Peng 2005). So are politically conservative Americans and Americans who report antiegalitarian attitudes (Krosch et al. 2013). Relatedly, Americans are relatively more likely to classify ambiguous people as non-White, whether Black or Latino, if they are first primed to think about economic scarcity or demographic shifts that pose a threat to their group’s status (Abascal 2020; Gaither et al. 2016; Ho et al. 2013; Krosch and Amodio 2014; Rodeheffer, Hill and Lord 2013; also see Cooley et al. 2018). These effects are strongest among Republicans (Abascal 2020) and, again, Americans who report antiegalitarian attitudes (Chen et al. 2018; Ho et al. 2013).
Most studies of racial classification involve all-White (e.g., Schachter et al. 2021) or majority-White samples (e.g., Chen et al. 2018). The few studies that deliberately look at racial classification by non-Whites identify some differences between them and Whites. For example, unlike White Americans, Black Americans who report antiegalitarian attitudes are more, not less, likely to classify ambiguous people as White (Ho et al. 2017). Also, non-White Americans who are exposed to information about demographic shifts are no less likely to classify ambiguous people as White (Abascal 2020). Other studies identify differences between how different non-White groups, like Asians and Blacks, classify multiracial people (Chen, Kteily and Ho 2019).
To this end, we examine what traits White, Black, Latino and Asian Americans use to classify others as PoC. One possibility suggested by prior work is that Americans police the boundaries around their own group more vigorously than those around other groups (e.g., Abascal 2020; Maghbouleh et al. 2022; Roberts et al. 2021); for example, Black Americans may use different, stricter criteria to classify someone as a PoC than do White Americans. Also, in line with previous findings regarding conservatism and inegalitarian motivations, we examine how Republicans and other Americans racially classify others.
Data and Methods
To understand how Americans who identify with different ethnoracial groups classify others, we require sizable samples of non-Whites. We partnered with the Race, Ethnicity, and Politics Lab at UCLA to administer a conjoint experiment to two separate samples. The first is a sample of 1,016 undergraduates drawn from three universities (conducted between April 22 and June 4, 2022). The second is a separate, population-based sample of 1,719 online, opt-in survey respondents collected by Dynata, a survey firm (conducted between May 24 and July 8, 2022). The student sample was drawn from universities with large non-White undergraduate student bodies: the University of California-Irvine, the University of California-Riverside, and Howard University. The Dynata dataset includes oversamples of Black (n = 545), Asian American (n = 318), and Latino respondents (n = 316).
For efficiency, the analyses reported in the main text pool the student and Dynata samples. Pooling also makes it possible for us to conduct adequately powered subgroup analyses by respondent race/ethnicity. We note, however, that a joint F test indicates that the coefficients in the student and Dynata samples are significantly different (p < .001). A closer look, however, reveals that coefficient sizes are different (in general, coefficients are stronger in the student sample), but their ordering and significance are largely consistent. Where results differ, the difference is stated in the text. Tables A3 and A4 report average marginal component effects (AMCEs) and marginal means separately for the student and Dynata samples.
Table 1 reports descriptive statistics for respondents in the student and Dynata samples separately. Respondents were asked to evaluate 10 profiles. Because of a programming error, however, we had to drop 1 of the 10 profiles from the Dynata data. We preregistered our analyses on Open Science Framework.
Descriptive Statistics for Student and National Samples.

Experimental Design
Which attributes do people use to classify others as PoC? To compare the impacts of various attributes, we used a conjoint experiment. Conjoint survey experiments allow researchers to estimate and compare the causal effects of multiple factors simultaneously (Hainmueller, Hopkins, and Yamamoto 2014). They involve showing respondents profiles that are characterized by multiple attributes (the factors), the values or “levels” of which are randomized. In our conjoint experiment, respondents were asked to ethnoracially classify profiles, and each profile was defined by seven independently randomized attributes.
Table 2 summarizes the attributes and their levels. As a result of randomization, respondents occasionally evaluate profiles with incongruous attributes (e.g., a person with White parents who identifies as Black). These profiles are needed to estimate how respondents weigh competing attributes. By blurring the photos used to signal skin color and limiting the levels of several attributes, our design nevertheless minimizes the number of incongruous combinations.
Profile Attributes and Levels.

Prior conjoint experiments signal skin color verbally (e.g., “dark-skinned”; Jefferson 2022) or by showing respondents hands with different skin tones (Schachter et al. 2021). For the sake of ecological validity, we presented respondents with faces. We drew images from the Chicago Face Database, a publicly available database with high-quality, standardized images of self-identified White, Black, Latino, and Asian Americans (Ma, Correll, and Wittenbrink 2015). We manipulated the skin color of 10 ethnoracially ambiguous faces (five men, five women) 4 to create three versions of each face: a light-skinned version, a medium-skinned version, and a dark-skinned version. Skin tone was benchmarked to the 3rd, 6th, and 9th points on an 11-point skin color palette from L’Oréal. By blurring the images, we ensured that color was their main discernible feature.
Ancestry was signaled by parents’ ethnoracial background. Profiles read, “This person was raised by their birth parents, who are,” with one of the following levels shown: “White,” “Black/African American,” “Latino/Latino(a/x),” “Asian/Asian American,” or “Middle Eastern or North African.” We made it clear that these were the person’s biological and social parents to avoid respondents reinterpreting the ancestry signal when faced with incongruous information. For example, a respondent who learns that a profile with White parents identifies as Asian may, if the term parents is left unspecified, assume that the person profiled was adopted. Schachter et al. (2021) addressed this by using genetic ancestry test results to signal ancestry, but people are less likely to know others’ genetic ancestry test results than to know something about their parents.
Parents’ occupations signal socioeconomic background. Both parents work in high-status occupations (doctor, lawyer, sales manager), medium-status occupations (real estate agent, food service manager, paralegal), or low-status occupations (fast food cook, cashier, home health aide).
Respondents learned that profiles were Christian or Muslim or that their religion was “not available.” In terms of language, respondents learned whether profiles spoke English at home. We relied on the results reported by Schachter et al. (2021) to limit the levels of religion and language to those that showed robust effects on ethnoracial classification. This strategy conserves statistical power and avoids some incongruous combinations (e.g., a Jewish profile with Asian parents who speaks Navajo).
Respondents learned how profiles self-identified, as “White,” “Black/African American,” “Latino/Latino(a/x),” “Asian/Asian American,” or “Middle Eastern or North African.” Half of all respondents learned that profiles identified their race/ethnicity on an anonymous survey; half learned that profiles identified their race on a scholarship application. The results of this manipulation are described in other work (Abascal et al. 2025b). Here, we pool results across experimental conditions.
Finally, profiles could be between 17 and 21 years old, although we did not have hypotheses regarding age.
Outcomes
Respondents saw and answered questions for one profile at a time. Our outcome is based on responses to the following question: “Please indicate whether you agree or disagree . . . This person is a person of color.” 5 Respondents could choose one of five options from “strongly disagree” (1) to “strongly agree” (5).
Analysis
Our analyses are based on 23,834 respondent-profile observations. In the main text, we report both AMCEs and marginal means. AMCEs are estimated using ordinary least squares with standard errors clustered by respondent (Hainmueller et al. 2014). AMCEs represent the average difference in the outcome rating scale between profiles at a specific attribute level, relative to those at the reference level for that attribute. Marginal means report the average outcome rating for profiles at a specific attribute level (Leeper, Hobolt and Tilley 2020). Our models condition on several respondent-level characteristics, including whether respondents were drawn from the student or Dynata samples, gender, race/ethnicity, income, nativity, age, educational attainment, and partisanship.
Results
Table 3 reports AMCEs for agreement that a profile is a person of color; Table 4 reports marginal means. Ancestry has the largest effect on classification as PoC (Table 3). Compared with profiles with White parents, on average, profiles with Black parents score 1.04 points higher on agreement that the profile is a person of color (p < .001). Again compared with a profile with White parents, on average, profiles with Latino or MENA parents score 0.82 points higher (p < 0.001). Finally, profiles with Asian parents score 0.68 points higher on agreement that the profile is a person of color (p < 0.001).
Average Marginal Component Effects for Agreement That a Profile Is a Person of Color, Pooled Samples (n = 23,834).

Note: CFD = Chicago Face Database; MENA = Middle Eastern or North African.
Marginal Means for Agreement That a Profile Is a Person of Color, Pooled Samples. N = 23,834.
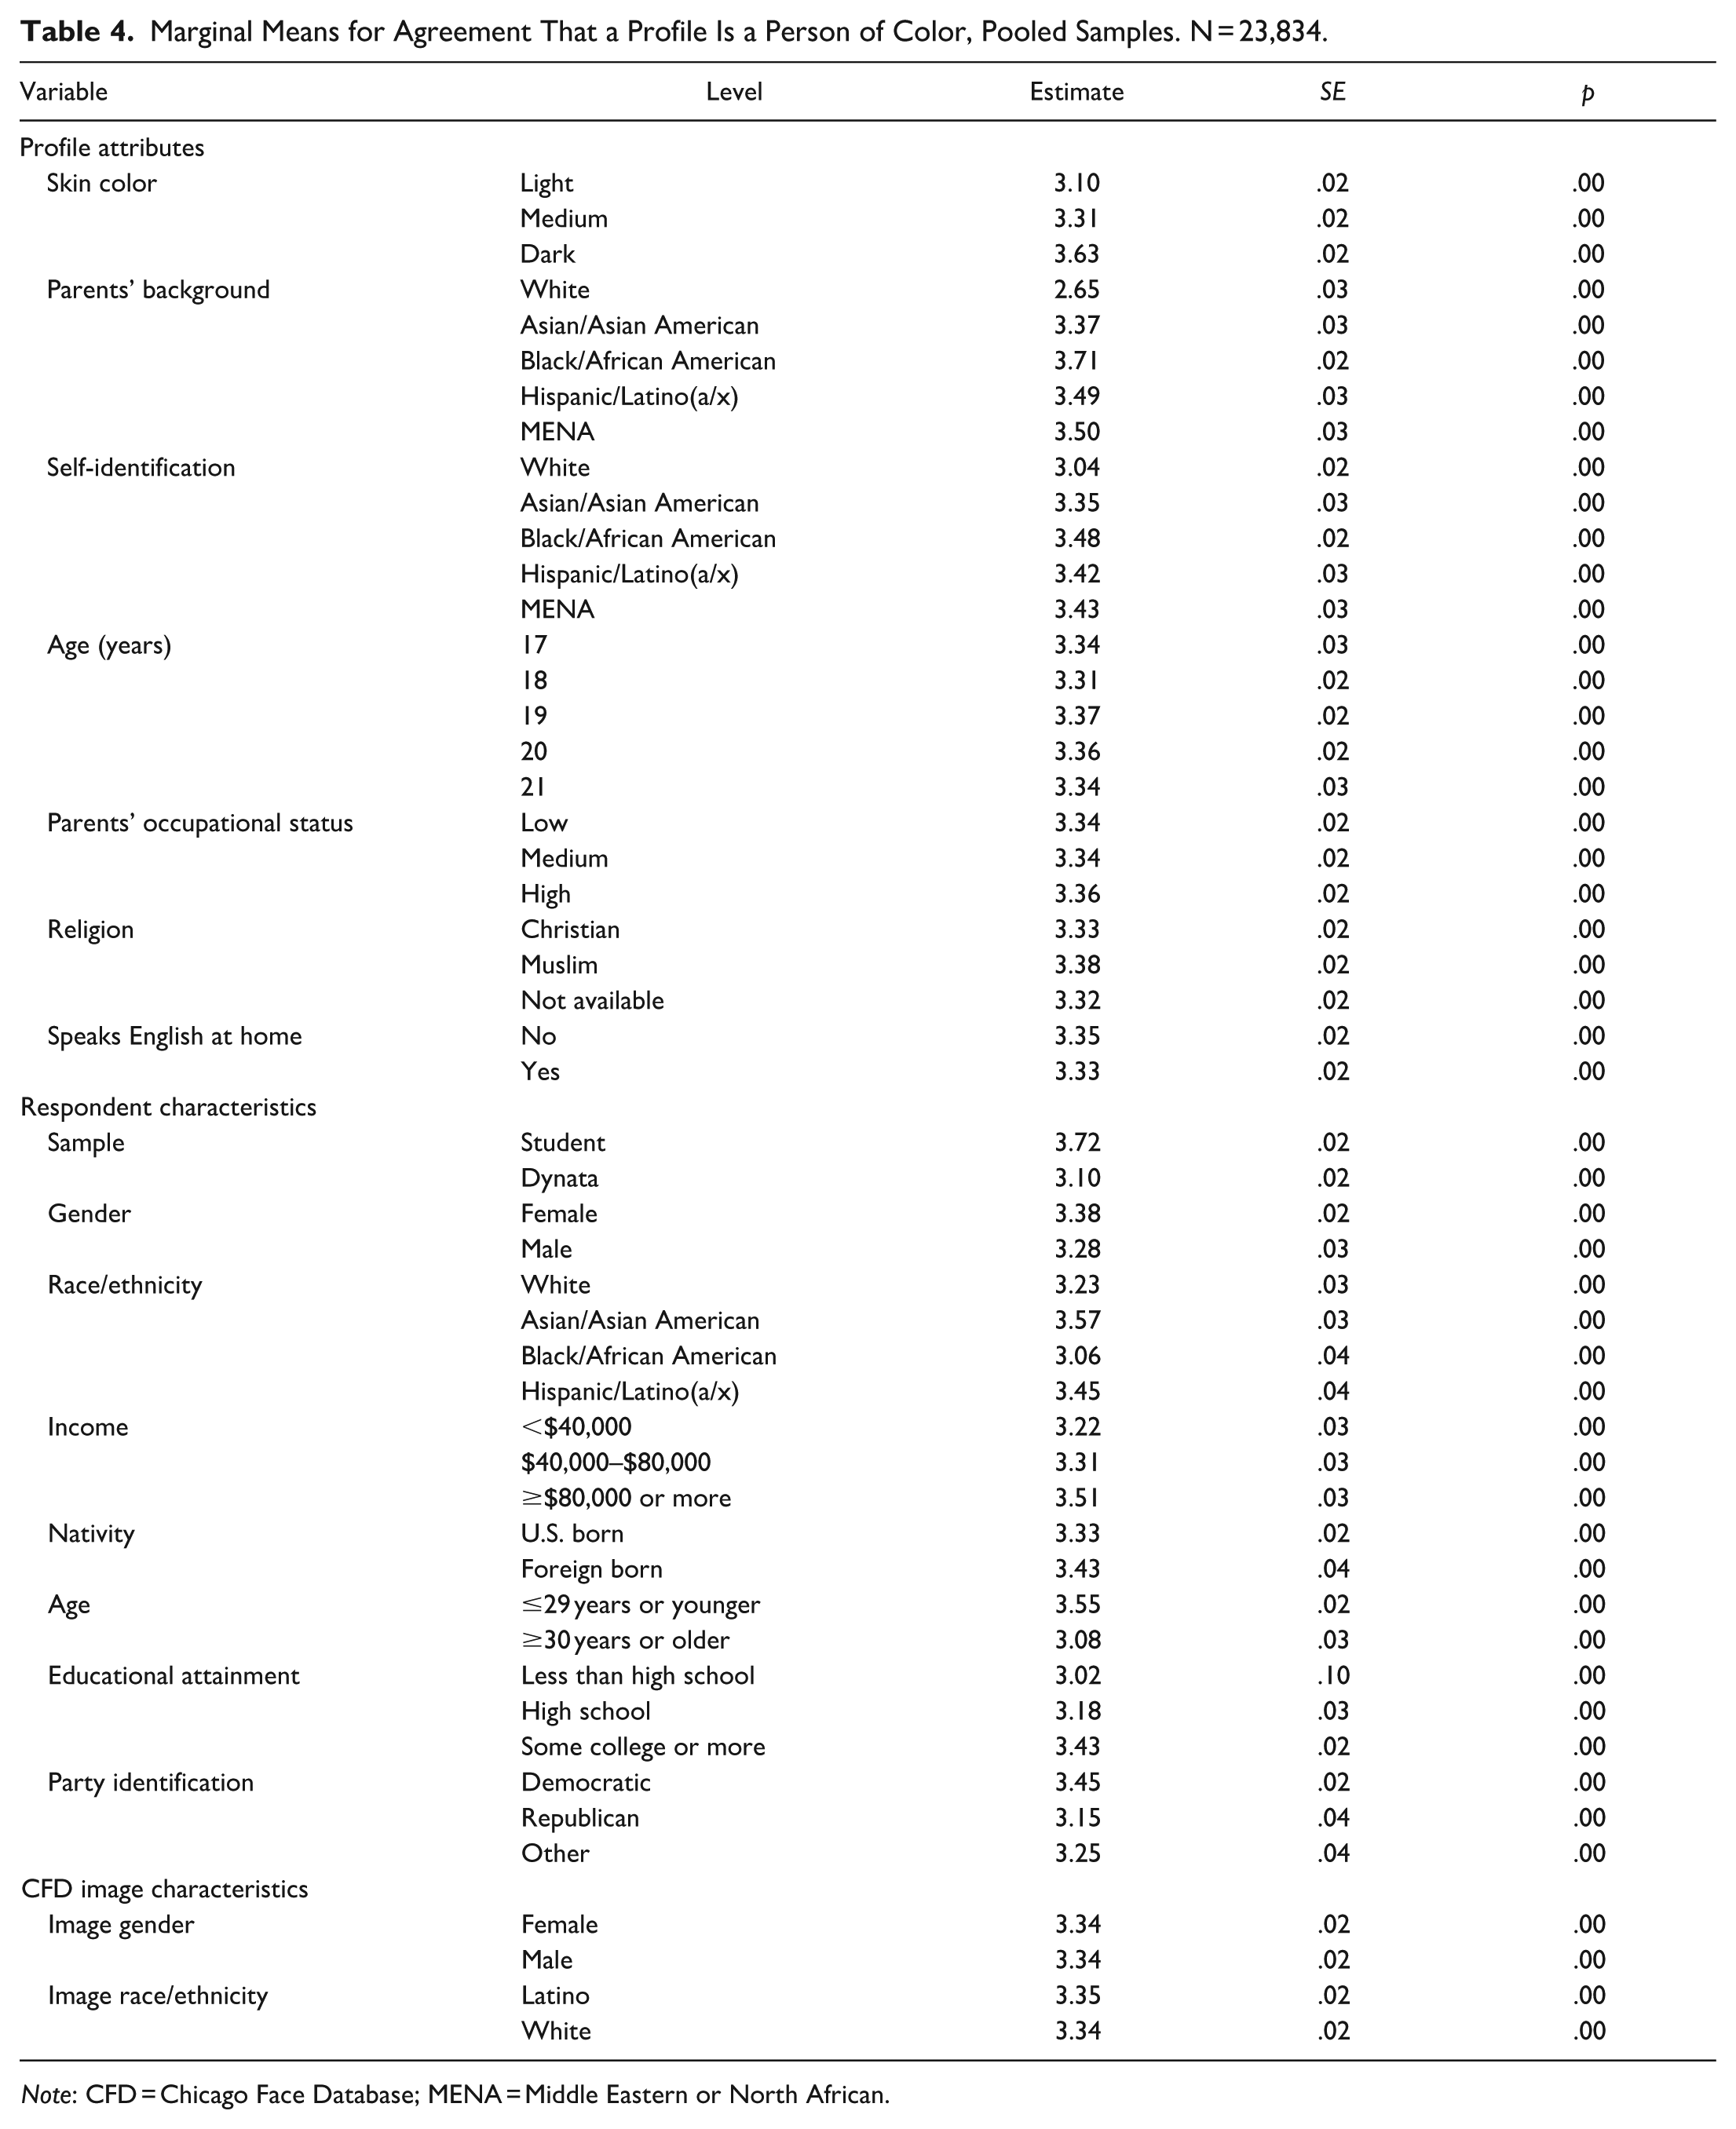
Note: CFD = Chicago Face Database; MENA = Middle Eastern or North African.
After ancestry, skin color and self-identification have the next strongest effects on classification as PoC (Table 3). Their effects are comparable. Compared with profiles with light skin tone, those with medium skin tone score 0.19 points higher (p < .001) and those with dark skin tone score 0.51 points higher (p < .001) on agreement that the profile is a person of color. Compared with profiles who self-identify as White, on average, profiles who self-identify as Black score 0.45 points higher (p < .001) on agreement that the profile is a person of color. By comparison, profiles who self-identify as Latino or MENA score 0.38 points higher (p < .001). Finally, profiles who self-identify as Asian American score 0.31 points higher on agreement that the profile is a person of color (p < .001).
A closer look at ancestry, the strongest predictor of classification, reveals that not everyone with non-White parents is equally likely to be seen as PoC (Table 4). Profiles with Black parents are most likely to be classified as PoC. Next are profiles with Latino or MENA parents. Among those profiles with non-White parents, the ones with Asian parents are the least likely to be classified as PoC.
Tests of adjusted marginal means confirm that profiles with Black parents elicit significantly higher agreement that the profile is PoC than those with Latino or MENA parents (p < .001 for both the Black–Latino and Black–MENA contrasts, with corrections for multiple comparisons). In addition, profiles with Latino or MENA parents elicit significantly higher agreement that the profile is PoC than those with Asian parents (p < .001 for both the Latino–Asian and MENA–Asian contrasts, with corrections for multiple comparisons). The marginal means for profiles with Latino and MENA parents are not significantly different.
These findings confirm those from Pérez’s (2021) interviews: Black Americans are viewed as “prototypical” PoC (p. 52), whereas Asians are “peripheral” to the category (p. 56). They also suggest that even a three-tiered hierarchy may not capture the nuanced gradations Americans perceive between non-White Americans. Indeed, profiles with Latino or MENA ancestry generally fall between those with Asian ancestry and those with Black ancestry.
Other profile attributes have much weaker effects on classification as PoC (Table 3). Muslim profiles are slightly more likely to be classified as PoC than Christian profiles (AMCE = 0.05, p = .015), but this effect is significant only in the student sample (Table A3). Profiles who do not speak English at home are also slightly more likely to be classified as PoC than those who do (AMCE = −0.04, p = .036). 6 However, socioeconomic background, as proxied by parents’ occupations, does not affect classification as PoC.
Finally, we turn to respondent attributes, which were not randomized (Table 3). Respondents in the Dynata sample are less likely than those in the student sample to classify profiles as PoC on average (AMCE = −0.46, p < .001), holding constant other respondent characteristics and profile attributes. Similarly, older respondents (≥30 years) are on average less likely than younger ones (≤29 years) to classify profiles as PoC (AMCE = −0.11, p = .038), although age is not a significant predictor in the more age-constrained student sample. The sample and age effects lend credence to an intuition in Pérez (2021) as well as Matos et al. (2023): young people are more familiar (or possibly comfortable) with the term person of color. Ironically, Asian American respondents are more likely than White respondents to classify profiles as PoC (AMCE = 0.27, p < .001) on average, although profiles with Asian ancestry are the least likely, of those with non-White ancestry, to be classified as PoC themselves.
Results by Respondent Race/Ethnicity
Overall averages may conceal variability across respondents from different ethnoracial backgrounds in terms of how they classify others. Figures 1 and 2 report AMCEs and marginal means for agreement that a profile is a person of color separately for White, Black, Latino, and Asian American respondents. Model estimates are reported in Tables A1 and A2.

Average marginal component effects for agreement a profile is a person of color, by respondent race.
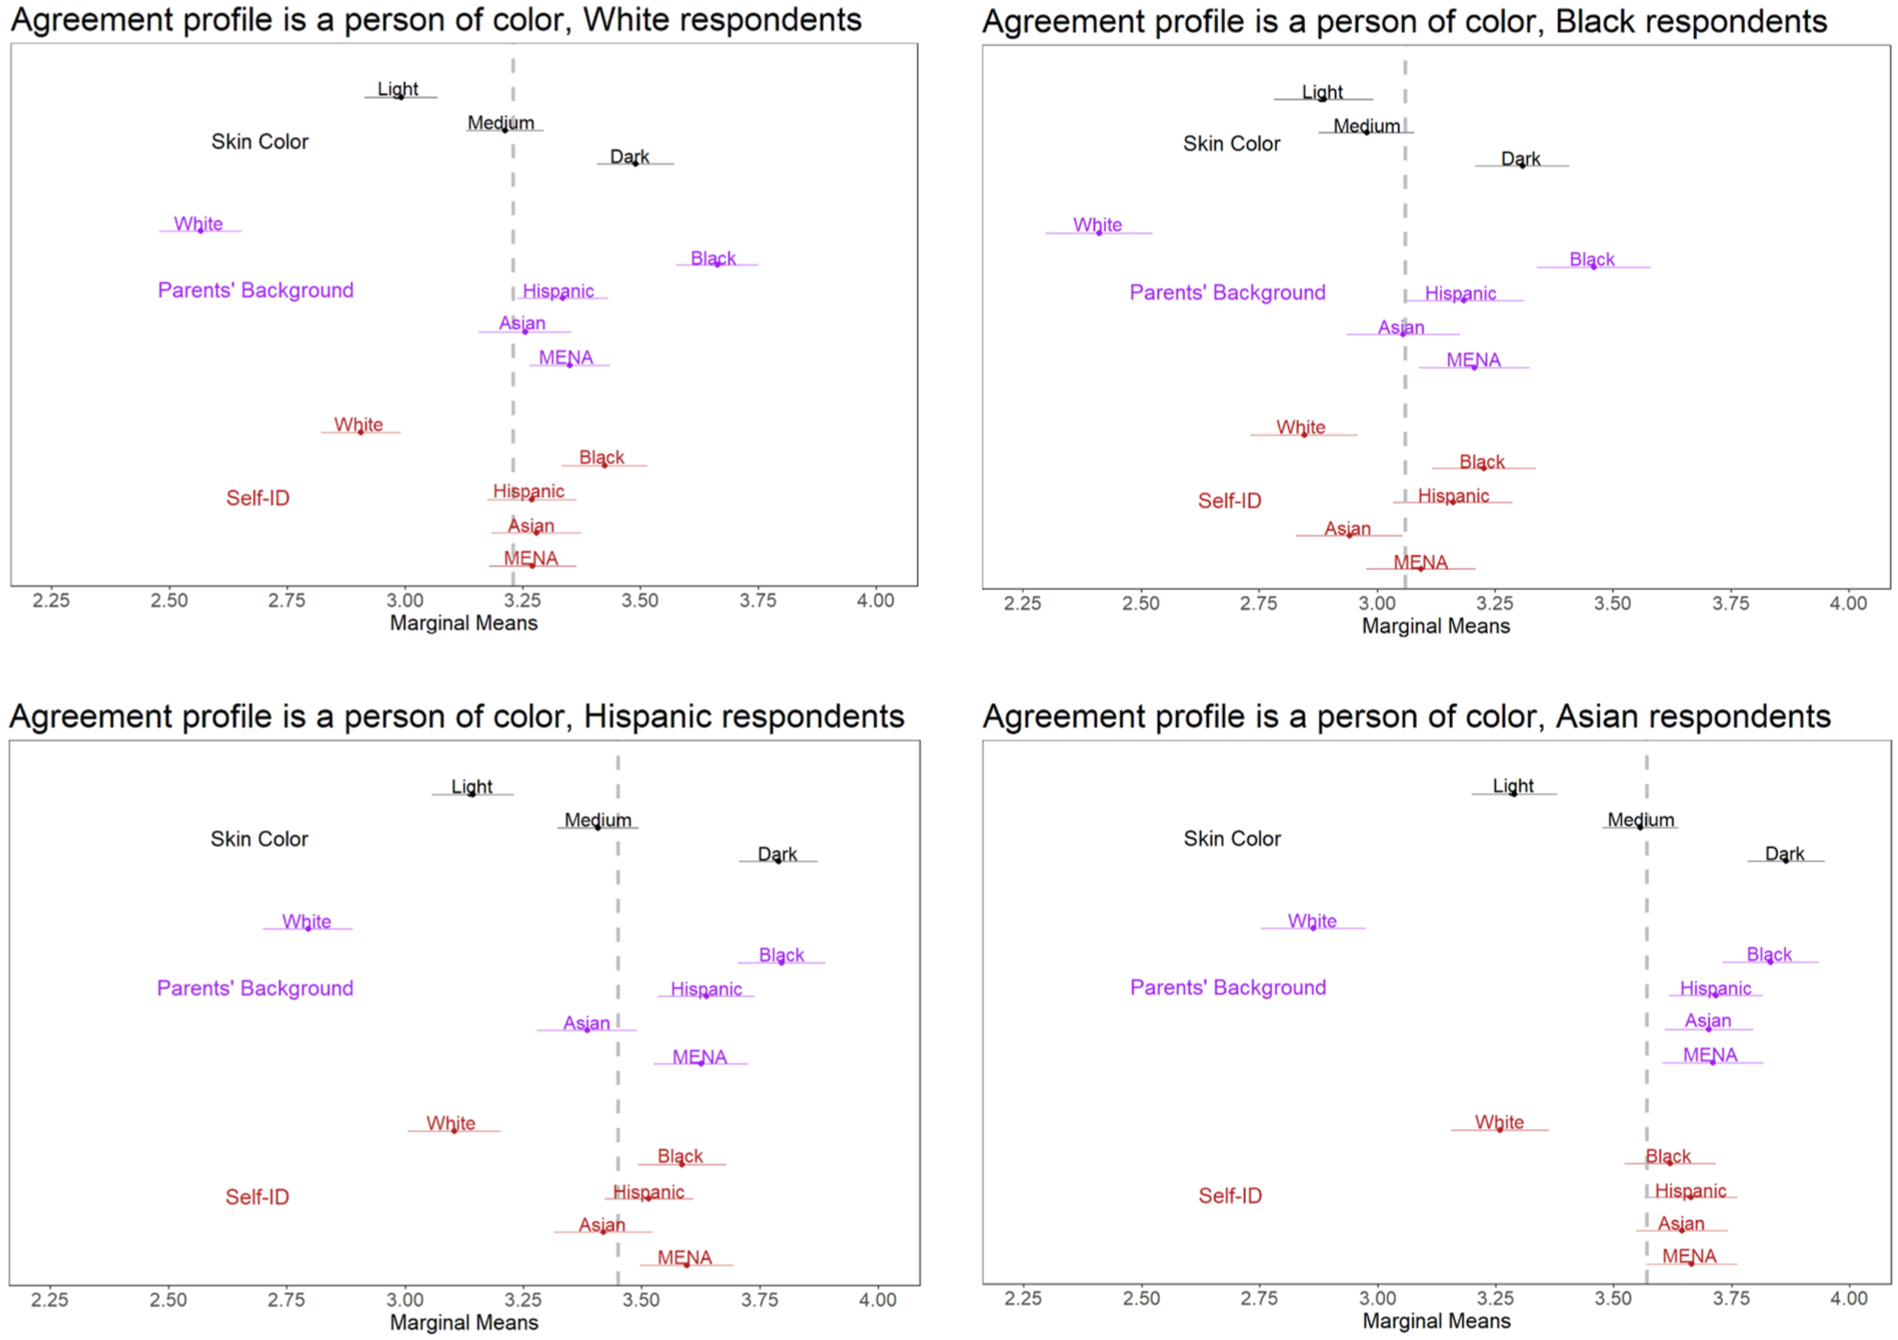
Marginal means for agreement a profile is a person of color, by respondent race.
Two results are consistent across respondent race/ethnicity: (1) ancestry has the strongest effects on PoC classification, and (2) self-identification and skin color have the next strongest effects (Figure 1). Regarding ancestry, compared with profiles with White parents, profiles with Black parents score between 0.99 and 1.11 points higher on agreement that the profile is PoC among White, Black, Latino and Asian respondents (Table A1).
Furthermore, among White, Black, and Latino respondents, profiles with Asian versus White parents elicit significantly lower agreement that the profile is PoC than those with Black parents (p < .001 for the Black–Asian contrast in the White, Black, and Latino subsamples, corrected for multiple comparisons). In addition, White, Black, and Latino respondents generally rate profiles with Black parents as significantly more PoC than those with Latino or MENA parents and profiles with Latino or MENA parents as more PoC than those with Asian parents. 7 Asian respondents, by contrast, rate all profiles with non-White parents similarly, whether they have Black, Latino, MENA, or Asian parents (p > .05 for all contrasts, corrected for multiple comparisons). 8
Self-identification and skin color also matter for classification as PoC, regardless of respondent race/ethnicity (Table A1). Regarding self-identification, compared with profiles who identify as White, those who identify as Black, Latino, MENA, or Asian elicit stronger agreement that the profile is PoC. And, compared with profiles with the lightest skin tone, profiles with the darkest skin tone score between 0.39 and 0.62 points higher on agreement that the profile is PoC.
Discussion
Ancestry, captured by parents’ race/ethnicity, has the strongest effects on classification as PoC; it is followed by self-identification and then phenotype, specifically, skin color. Not all profiles with non-White parents are seen as equally likely to be PoC. Profiles with Black parents elicit the highest agreement that they are PoC, whereas those with Asian parents elicit the lowest (among profiles with non-White parents).
Analyses by respondent race/ethnicity reveal that White, Black, Latino and Asian respondents agree on the importance of ancestry for PoC classification, followed by skin color and self-identification. Broadly, this suggests that Americans of different ethnoracial backgrounds agree on who counts as PoC. A notable exception concerns Asian respondents: by contrast with other respondents, Asian respondents rate profiles with Black, Latino, MENA or Asian parents as equally likely to be PoC.
Conclusion
Our study brings to light the factors that people weigh when classifying others as PoC, extending recent work that mainly focuses on how people choose to identify themselves as PoC (Matos et al. 2023; Pérez 2021; Starr 2022; Starr and Freeland 2024). Our experiment also lends support for an understudied driver of ethnoracial classification: self-identification. How a person identifies themselves consistently affects how strongly others are to agree that the person is a PoC. In fact, the effects of self-identification are consistently among the strongest; in some cases, they are stronger than those of skin color. Researchers have theorized a reciprocal relationship between the multiple dimensions of race (Jenkins 2008; Roth 2016). Our study is among the first to pinpoint a causal effect of self-identification on external classification.
More broadly, our findings build on a growing body of work that treats classification as “a flexible social outcome” rather than “a fixed and self-evident determinant of social status” (Telles and Flores 2013). We focus on external classification because how others see and classify us affects how they treat us in consequential encounters, from reaching out to a loan officer (Hanson et al. 2016), to applying for a job (Pager, Bonikowski and Western 2009), to being stopped by the police (Pierson et al. 2020). How people view a group more generally—for example, whether they think Asian Americans are fellow PoC—can also affect the movement coalitions they work to form (Pérez 2021).
Although we did not design our experiment with the aim of speculating about the future U.S. racial hierarchy—as debated by Bonilla-Silva (2002), Yancey (2003), Gans (2019), and others—we came to realize that our data could shed light on Americans’ own perspectives on the so-called PoC hypothesis (Sears and Savalei 2006). In broad strokes, this hypothesis predicts that non-White Americans will coalesce around shared experiences of exclusion. It contrasts with the thesis that Black/non-Black will become the principal dividing line (e.g., Yancey 2003) as well as with Bonilla-Silva’s (2002) Latin Americanization thesis. Our findings provide some support for both the White/non-White thesis and the Latin Americanization thesis. Regarding the first, by and large, the effects of Asian, Latino, MENA, and Black ancestry or identification on PoC classification are generally much closer to each other than to those of White ancestry or identification. However, most Americans, but especially Black Americans, view Blacks profiles as the most prototypical PoC, Asian profiles as more peripheral, and Latino and MENA profiles as falling in between. (Asian respondents are an exception, and they classify profiles with Black, Latino, Asian, and MENA parents similarly.)
This ethnoracial gradient—with White and Black profiles on opposite poles and Latino, Asian and MENA profiles in between—resembles the Latin Americanization thesis. However, our findings diverge from Bonilla-Silva’s (2002) thesis in two ways. First, they imply more than three strata, with at least two strata (one for Asian Americans and another for Latino and MENA Americans) between the Black and White poles. Second, whereas Bonilla-Silva’s thesis hinges on phenotypic differences—for example, light-skinned Latinos as “honorary Whites” and dark-skinned Latinos in the “collective Black” (p. 4)—the gradient we uncover is net of skin color. Our findings imply, in other words, that many Americans would be more likely to count someone with Black parents as PoC than someone with Asian parents, even if they had the same skin color. By the same token, they suggest that phenotype on its own, or at least skin color, does not fully account for, say, Latinos’ status as PoC. We stress that our findings are just one lens into the future of the US racial hierarchy, which should be weighed alongside evidence on attitudes, identification choices, intermarriage, residential choices, and other outcomes.
Our experiment leaves unanswered interesting questions for further research. First, although our results do not reveal substantial differences between respondents from different ethnoracial backgrounds in terms of how they classify others, it remains to be seen whether respondents who themselves identify as PoC differ from those who do not. Unfortunately, our survey did not solicit PoC self-identification. It is more plausible that Americans who identify as PoC are most likely to recognize a gradient in terms of which non-Whites count as PoC, with Black Americans most likely to count and Asian Americans least. This was the most pronounced difference by respondent race/ethnicity we identified, with Asian American respondents not recognizing a gradient in PoC classification. Identifying as PoC might account for some of this difference.
Our experiment also did not examine the role of a person’s political views on whether that same person is likely to be classified as PoC. Pérez’s (2021) interviewees, however, suggest that people with conservative political views are less likely to be viewed as PoC. Relatedly, Agadjanian and Lacy (2021) found that switching one’s vote from a non-Republican candidate to the Republican presidential candidate between 2012 and 2016 significantly predicts switching one’s racial self-identity from non-White to White, with those who initially identify as mixed race or Latino driving this relationship. Research on the role of political identification on ethnoracial classification could also explore whether liberal Americans have become more likely than their conservative counterparts to self-identify as PoC over time, holding race/ethnicity and other differences constant.
These and other questions merit additional research. The main contribution of the present study lies in revealing a general consensus in terms of who counts as PoC, even as Americans disagree on the political implications of belonging to that category.
Footnotes
Appendix
Marginal Means for Agreement That a Profile Is a Person of Color, by Sample (n = 23,834).

| Sample | ||||||
|---|---|---|---|---|---|---|
| Dynata | Student | |||||
| Variable | Estimate | SE | p | Estimate | SE | p |
| Profile attributes | ||||||
| Skin color | ||||||
| Light | 2.89 | .03 | .00 | 3.42 | .03 | .00 |
| Medium | 3.04 | .03 | .00 | 3.71 | .03 | .00 |
| Dark | 3.37 | .03 | .00 | 4.05 | .03 | .00 |
| Parents’ background | ||||||
| White | 2.58 | .03 | .00 | 2.78 | .04 | .00 |
| Asian/Asian American | 3.07 | .03 | .00 | 3.84 | .04 | .00 |
| Black/African American | 3.48 | .03 | .00 | 4.07 | .03 | .00 |
| Hispanic/Latino(a/x) | 3.18 | .04 | .00 | 3.98 | .03 | .00 |
| MENA | 3.20 | .03 | .00 | 3.94 | .04 | .00 |
| Age (years) | ||||||
| 17 | 3.10 | .03 | .00 | 3.70 | .03 | .00 |
| 18 | 3.05 | .03 | .00 | 3.72 | .03 | .00 |
| 19 | 3.12 | .03 | .00 | 3.75 | .03 | .00 |
| 20 | 3.12 | .03 | .00 | 3.72 | .03 | .00 |
| 21 | 3.11 | .03 | .00 | 3.72 | .04 | .00 |
| Parents’ occupational status | ||||||
| Low | 3.09 | .03 | .00 | 3.71 | .03 | .00 |
| Medium | 3.09 | .03 | .00 | 3.71 | .03 | .00 |
| High | 3.12 | .03 | .00 | 3.74 | .03 | .00 |
| Religion | ||||||
| Christian | 3.10 | .03 | .00 | 3.68 | .03 | .00 |
| Muslim | 3.11 | .03 | .00 | 3.80 | .03 | .00 |
| Not available | 3.09 | .03 | .00 | 3.69 | .03 | .00 |
| Speaks English at home | ||||||
| No | 3.11 | .03 | .00 | 3.74 | .03 | .00 |
| Yes | 3.09 | .03 | .00 | 3.71 | .03 | .00 |
| Self-identification | ||||||
| White (self) | 2.89 | .03 | .00 | 3.27 | .04 | .00 |
| Asian/Asian American | 3.04 | .03 | .00 | 3.82 | .04 | .00 |
| Black/African American | 3.27 | .03 | .00 | 3.83 | .03 | .00 |
| Hispanic/Latino(a/x) | 3.15 | .03 | .00 | 3.82 | .03 | .00 |
| MENA | 3.14 | .03 | .00 | 3.89 | .03 | .00 |
| Respondent characteristics | ||||||
| Condition | ||||||
| Anonymous survey | 3.08 | .03 | .00 | 3.75 | .03 | .00 |
| Scholarship application | 3.12 | .03 | .00 | 3.69 | .03 | .00 |
| Gender | ||||||
| Female | 3.09 | .03 | .00 | 3.78 | .03 | .00 |
| Male | 3.11 | .04 | .00 | 3.63 | .04 | .00 |
| Race/ethnicity | ||||||
| White | 3.02 | .04 | .00 | 3.67 | .04 | .00 |
| Asian/Asian American | 3.38 | .05 | .00 | 3.77 | .04 | .00 |
| Black/African American | 3.01 | .04 | .00 | 3.47 | .11 | .00 |
| Hispanic/Latino(a/x) | 3.11 | .05 | .00 | 3.75 | .04 | .00 |
| Income | ||||||
| <$40,000 | 3.02 | .03 | .00 | 3.73 | .04 | .00 |
| $40,000–$80,000 | 3.12 | .04 | .00 | 3.70 | .05 | .00 |
| ≥$80,000 | 3.23 | .05 | .00 | 3.73 | .03 | .00 |
| Nativity | ||||||
| U.S. born | 3.08 | .03 | .00 | 3.75 | .02 | .00 |
| Foreign born | 3.26 | .07 | .00 | 3.60 | .06 | .00 |
| Age | ||||||
| ≤29 years | 3.19 | .04 | .00 | 3.72 | .02 | .00 |
| ≥30 years | 3.07 | .03 | .00 | 3.80 | .13 | .00 |
| Educational attainment | ||||||
| Less than high school | 3.02 | .10 | .00 | |||
| High school | 2.96 | .04 | .00 | 3.73 | .05 | .00 |
| Some college or more | 3.18 | .03 | .00 | 3.72 | .03 | .00 |
| Party identification | ||||||
| Democratic | 3.17 | .04 | .00 | 3.79 | .03 | .00 |
| Republican | 3.07 | .05 | .00 | 3.54 | .10 | .00 |
| Other | 3.02 | .05 | .00 | 3.65 | .05 | .00 |
| CFD image characteristics | ||||||
| Image gender | ||||||
| Female | 3.09 | .03 | .00 | 3.69 | .03 | .00 |
| Male | 3.10 | .02 | .00 | 3.76 | .02 | .00 |
| Image race/ethnicity | ||||||
| Latino | 3.10 | .02 | .00 | 3.70 | .03 | .00 |
| White | 3.10 | .03 | .00 | 3.75 | .03 | .00 |
Note: CFD = Chicago Face Database; MENA = Middle Eastern or North African.
Acknowledgements
Tori Gorton provided research assistance. Daniel J. Hopkins provided helpful feedback at every stage. We also thank Paul DiMaggio, Gall Sigler, and participants of New York University’s Race and Ethnicity Workshop for their comments and suggestions. The authors also gratefully acknowledge the Russell Sage Foundation, where MA, AA, and DH conceived of and designed this project as visiting scholars.
Funding
The authors disclosed receipt of the following financial support for the research, authorship, and/or publication of this article: This research was partially supported by the University of California-Los Angeles Race, Ethnicity, Politics, & Society Lab.
Ethical Approval
This study was approved by the University of California-Los Angeles institutional review board (#22-000744).
1
2
Authors’ calculations according to Factiva search data.
4
5
Separately, respondents were asked to indicate whether they agreed or disagreed that “This person is White,” “This person is Black/African American,” “This person is Latino/Latino(a/x),” “This person is Asian/Asian American,” or “This person is Middle Eastern or North African.” These results are the subject of other work (Abascal et al. 2025a; ![]() ), and our PoC classification outcome is based on responses to the PoC item and not these items.
), and our PoC classification outcome is based on responses to the PoC item and not these items.
7
The exceptions are as follows: Black respondents and the Asian–Latino contrast (p = 0.17), Latino respondents and the Black–Hispanic Latino (p = 0.06), and White respondents and the Asian–Latino (p = 0.09) and Asian–MENA (p = 0.29) contrasts. All of these contrasts trend in the expected directions and are significant before correcting for multiple comparisons.
8
Exploratory analyses by respondent nativity suggest that foreign-born Asian respondents perceive no differences between profiles with Black, Latino, MENA or Asian parents, whereas U.S.-born Asian respondents rate profiles with Black parents as more likely to be PoC than those with Latino, MENA, or Asian parents. U.S.-born Asian respondents rate profiles with Latino, MENA, and Asian parents similarly, however, consistent with a flatter PoC hierarchy among Asian respondents generally.