
Abstract
Tents are a familiar sight across many U.S. cities, especially West Coast cities. In Seattle, given the high visibility of tents, public perceptions of a widespread problem, the uncertainty surrounding the city’s number of tents, and national data showing a rise in unsheltered homelessness, the authors decided to count tents. They conducted a tent census to obtain a full count of the number of tents in the city of Seattle as well as two resamples of highly populated areas of tents. In the tent census, and in the two resamples, the authors find support for three general expectations: the census revealed a greater number of tents than official counts, there were clear spatial patterns to the locations of tents, and the total number of tents in Seattle increased during the coronavirus disease 2019 pandemic. The data reveal some surprises regarding the size and change of tent clusters, the proportion of solo tents versus tent camps, and the “amenability” or proximity of tents to infrastructure and social services. To conclude, the authors discuss the policy implications of this research.
Keywords
Tents are popping up in public places, becoming semipermanent fixtures of urban spaces. The high visibility of tents increasingly garners media coverage, often reflecting the worst stereotypes of homelessness that characterize people living in tent camps as violent, drug addicted, mentally ill, and dangerous. 1 Concerns about homelessness, especially the rapid rise of tent-based homelessness, are politically polarizing and are increasingly emphasized within contemporary urban public policy. Given the visibility and public concern surrounding tent-based homelessness, local politicians are being pressured to address the issue (Herring 2019). Yet there are currently no reliable systems in place to document the extent of the problem. Comprehensive data on the number of tents within cities is needed to guide policy. Data on tent-based homelessness are often lacking, as many cities fail to collect data that would accurately define the scope of the problem, analyze trends over time, and inform effective policy responses.
In many ways, tents have become the public face of homelessness and can easily be pointed to as an illustration of all that has gone wrong with local social policy. This study is driven by the importance of gathering systematic data on tents to better understand the scope of tent-based homelessness. The data that exist on tent-based homelessness are limited, focusing on point-in-time (PIT) estimates and undocumented claims. Our tent census serves an important comparison, not only to assess other methods of data collection, but to also document the number, type, location, and size of tent clusters.
National Data on Unsheltered Homelessness
Data on homelessness, including tent counts, largely come from the U.S. Department of Housing and Urban Development’s (HUD) PIT counts. PIT counts are usually conducted annually on a single night in January. 2 This nationwide effort documents sheltered and unsheltered homelessness, providing a snapshot of homelessness across the country. PIT counts enumerate those living in sheltered locations, including emergency shelters and transitional housing, as well as those living unsheltered—on the streets, in abandoned buildings, in public spaces like parks, in cars and recreational vehicles, and in tents. HUD’s 2023 national data show that approximately 653,100 people, or about 20 of every 10,000 people, in the United States were experiencing homelessness, representing a 12 percent increase in homelessness year over year. This increase is driven largely by increases in unsheltered homelessness in urban centers along the West Coast of the United States, which have a high incidence of tents (de Sousa et al. 2023; Patrick 2023). The 2024 HUD data document a similar trend, reporting 770,000 people experiencing homelessness, with an 18 percent overall increase in homelessness from the previous year, including a 7 percent rise in unsheltered homelessness (de Sousa and Henry 2024). 3
Although useful for a broad understanding of the scope of homelessness, PIT counts have some limitations. One limitation is that PIT counts do not focus on tent-based homelessness as a distinctive type of unsheltered homelessness. In 2020, prior to the onset of coronavirus disease 2019 (COVID-19), nationwide, nearly 4 in 10 (39 percent) people experiencing homelessness were unsheltered (Henry et al. 2020). In the urban centers of California, Oregon, and Washington, however, these percentages were much higher, with unsheltered homelessness in Oakland at 78 percent, in Los Angeles at 72 percent, in San Francisco at 64 percent, in Portland at 49 percent, and in Seattle at 47 percent (Henry et al. 2020). In 2021, HUD permitted cities and counties to forgo the annual PIT counts of homeless populations in light of the COVID-19 pandemic, leaving the unsheltered homeless largely un- or undercounted. This gap in the data makes it impossible to compare unsheltered populations with previous years’ data or to generalize national patterns of unsheltered homelessness. 4 Data from 2023 and 2024 show unsheltered homelessness driving part of a national increase, making a case for more comprehensive data collection on unsheltered homelessness, especially for tent-based homelessness, the fastest growing type of unsheltered homelessness.
Tent-Based homelessness
Before 2010, few studies on tent-based homelessness existed. More recent reports and academic research show clear regional variations in the growth of tent camps, with West Coast cities experiencing higher rates of tent-based homelessness (de Sousa et al. 2023; Heben 2014; Herring 2014; Herring and Lutz 2015; National Coalition for the Homeless 2010). Reports and research further differentiate between sanctioned (legal “tent cities”) and unsanctioned (illegal “tent encampments”) tent camps (Heben 2014; National Coalition for the Homeless 2010). For clarity, we use “tent camps” to denote all types of tent-based homelessness. More recently, however, the growth of unsanctioned tent encampments has far outpaced the growth of sanctioned tent cities.
A 2014 report from the National Law Center on Homelessness and Poverty (NLCHP) documented the rising number of homeless tent camps in the United States between 2008 and 2013, placing the number at more than 100 tent communities in 46 states and the District of Columbia (Hunter et al. 2014). In a subsequent report, “Tent City, USA: The Growth of America’s Homeless Encampments and How Communities Are Responding,” the NLCHP (2017b) analyzed media reports of tent camps to document the “rapid growth” of tent camps across the United States, as well as the resulting legal and policy responses. One of the report’s major findings was the sharp increase in homeless tent camps. The report noted the number of unique homeless camps rising from 19 in 2007 to 274 by 2016. According to the report, only 4 percent of the tent camps were sanctioned, with the vast majority (75 percent) unsanctioned, and approximately 20 percent of camps a hybrid (semilegal) or “tacitly sanctioned.”
A 2018 shift in reporting moved away from simply documenting types of tent camps toward integrating academic literature to better understand tent-based homelessness (Cohen, Yetvin, and Khadduri 2018). This new HUD report sought to understand the rise in tent camps describing their variations and exploring community-level responses. Seeking to explain increases in the unsheltered population, especially concentrations in West coast cities, the report highlights a lack of shelter availability, as well as the draw of tents for safety, community, autonomy, and privacy.
In addition to regional concentrations of homelessness across the United States, clustered within West Coast states and cities (Herring 2014), there are also spatial patterns at the city level (NLCHP 2017b). Long-standing research notes homeless individuals, including those in tent camps, often migrate to “marginal spaces” (Herring and Lutz 2015; Snow and Mulcahy 2001) or “peripheral areas” (Gowan 2010) in industrial zones or along rivers (Parker 2020). The spatial clustering within cities seems to be related to factors such as visibility, lower levels of surveillance (Herring and Lutz 2015), access to transportation lines, and social infrastructure including location of homeless services (Gowan 2010; Snow and Anderson 1993; Sutton et al. 2024; Wasserman and Clair 2010), which are often concentrated in downtown areas. Consistent with concentrations of unsheltered homeless populations in, or near, a city center and shelters, Shin (2023) also found clusters in neighborhoods with lower socioeconomic status.
These city-level concentrations of tent-based homelessness spurred neighborhood focused counts in select cities such as Los Angeles. The Los Angeles Longitudinal Enumeration and Demographic Survey (LA LEADS) project has been conducting counts of tents (and other forms of unsheltered homelessness) approximately twice a month in three “hot-spot neighborhoods” since September 2021. These reports show an 18 percent increase in unsheltered homelessness between 2021 and 2022, with no growth between 2022 and 2023 (Ward, Garvey, and Hunter 2023, 2024).
The visible rise in tent-based homelessness has also led to more academic research. What is not well known, however, is how many tents are in cities and the proportions of isolated tents, small clusters, or larger camps. A notable exception comes from Finnigan (2021), who conducted a comprehensive count of tents in west and central Oakland, using Google Street Views to examine the spatial dynamics of tent camps between 2008 and 2019. 5 Finnigan reported that the spatial distribution of tent camps correlated with highway underpasses, industrial areas, large homeless services organizations, and census tracts with low median incomes and signs of gentrification. Analyzing 22 census tracts, including a “substantial fraction” of Oakland’s unsheltered homeless population and comparing his data with the city’s 2019 PIT count, Finnigan reported a 130 percent increase in Oakland’s tent camps between 2017 and 2019, a striking increase of tents in a city already experiencing high rates of homelessness. Finnigan’s study represents an innovative approach to counting tent camps in a single city. As Finnigan noted, however, it is hard to know how well this method captures tents: “This strategy may not be viable in areas with infrequent [Google] Street Views, like rural areas, or areas with obstructed visibility, like the wooded Oakland hills” (p. 289). A similar analysis for other cities with high rates of reported tent-based homelessness would provide more comprehensive and useful data for scholars, policy makers, and outreach service providers.
Homelessness in Seattle, Washington
Although the nation as a whole saw a 2 percent increase in homelessness from 2019 to 2020, Washington state reported a 6.2 percent increase (Henry et al. 2020). HUD’s 2024 data show that Washington has the third highest rate of homelessness after New York and California (Westneat 2025). Seattle, the state’s largest city, also claims the third highest rate of homelessness in the nation (Coleman 2017), but also the third largest increase between 2007 and 2022 (de Sousa et al. 2023).
The King County Regional Homelessness Authority (KCRHA), the agency responsible for the PIT count in Seattle and the larger metropolitan area, chose to forgo the 2021 count. In 2022, questioning the traditional methodology of PIT counts, KCRHA modified its methodology, implementing a respondent-driven sampling design in lieu of the regular count. Replicating its 2022 collection procedure, KCRHA’s 2024 count showed a 23 percent rise (from 2022) in the number of people experiencing homelessness in Seattle and King County, with 16,385 people who were homeless: 9,810 unsheltered and 6,575 sheltered. The unsheltered population grew from 31 percent of the total homeless population in 2010 to 47 percent in 2020 and from 52 percent in 2022 to 60 percent in 2024. 6 The most recent PIT data by location type come from 2020, showing 1,207 homeless individuals living in unsanctioned tent camps, representing approximately 22 percent of the unsheltered population, with 156 homeless individuals living in sanctioned tent cities or tiny house villages.
In addition to the city’s high rates of homelessness, Seattle provides a useful case study because of the city’s growing inequality, with an increasingly educated and wealthy population concentrated in high-tech and medical industries. In 2022, for example, Amazon, which is headquartered in Seattle, raised its maximum base salary cap from $160,000 to $350,000 (Soper 2022). In the same year, the median single-family home price in Seattle neared $1 million ($927,000) (Groover 2024). Between 2019 and 2022, the number of people employed by the technology sector in Seattle outpaced other West Coast cities, reaching nearly 15 percent of all Seattle workers (Balk 2023). Seattle is at the center of rising income inequality and a lack of housing affordability, both of which are root causes of homelessness (Colburn and Aldern 2022; Lee, Tyler, and Wright 2010; O’Regan, Ellen, and House 2021). Loftus-Farren (2011) noted the spatial concentrations of tent camps in areas with high housing costs and limited shelter space, which is true for Seattle. This illustrates the paradox that is Seattle: on one hand, it is a thriving urban area with a technology-driven economic base, and on the other hand, it is an urban area with one of the nation’s highest proportions of people who are homeless.
Despite a citywide declaration of a state of emergency around homelessness in 2015, Seattle continues to lack systematic data to guide policy, especially regarding tents. The first (and for a time only) estimate of the number of tents in the city came from 2017 in the form of a memo from then interim mayor Tim Burgess, which stated that the city had an “estimated 400 unauthorized encampments.” Unfortunately, no documentation was made available to explain how this number was derived or what exactly it described (e.g., how many tents define an “encampment”), rendering these counts unreliable. This number, however, has been widely cited.
Given the uncertainty surrounding the city’s number of tent camps, the high visibility of tents, public perceptions of a widespread problem, as well as national data on the rise in unsheltered homelessness, we decided to count tents. 7 Reliable and valid data are necessary for understanding the scope of, and policy responses to, tent-based homelessness. In light of these concerns, we took an alternate route to Finnigan (2021). Between 2019 and 2020, we conducted a tent census to obtain a full count of the number of tents in the city of Seattle, as well as two resamples of areas highly populated by tents from the full census. 8 Not only does our tent census allow us to get a full count of tents, but we are also able to see the impact of COVID-19 on tent-based homelessness in Seattle. Our research is grounded in prior research on the sociospatial patterns of homelessness (Snow and Mulcahy 2001) and adds to a growing use of “alternative data sources” to contribute to an understanding of unsheltered homelessness to inform effective interventions (Chien et al. 2024; Ward, Garvey, and Hunter 2022). On the basis of previous research, we have several expectations:
First, the tent census will find a greater number of tents than official city estimates. Historically scholars have underscored the problems with counting homeless populations (see, e.g., Jencks 1995), and advocates have long bemoaned the underestimation of standard PIT count data (NLCHP 2017a). Weaknesses of PIT counts are well known and were illuminated during the COVID-19 pandemic, when they were made optional. Researchers link concerns to methodological design—reliability, validity and accuracy—and limitations to the January data collection time frame, resulting in low counts (Mosites et al. 2021; Schneider, Brisson, and Burnes 2016; Tsai and Alarcón 2022). Temporal limitations linked to variation are not captured in PIT counts, especially seasonal clusters of unsheltered homelessness (Chien et al. 2024). When the weather gets cold, people who are sleeping outside are more willing to deal with shelters despite preferred avoidance because of well-known criticisms of shelter rules and staff members.
Apart from Seattle’s PIT counts, the nebulous methodology for the city’s count of 400 encampments, means we cannot directly compare our tent count with their estimates. Not only do we expect the tent census to find a greater number of tents, but we also expect to find a majority of these tents to be in unsanctioned encampments. Although most reports, media accounts, and research articles focus on large tent encampments, the NLCHP (2017a) report noted that 17 percent of camps were “large,” defined as having 100 or more residents, with many more camps “medium” sized, defined as having 11 to 50 residents. We therefore expect to find a higher proportion of medium-sized and large camps.
Second, there will be spatial patterns where tents are located. Different types of urban spaces relate to how individuals who are homeless negotiate and respond to spatial constraints (Snow and Mulcahy 2001). Research on unsheltered homelessness highlights a spatial process with clustering (Chien et al. 2024; Marr et al. 2009). We do not expect to find tents equally or randomly distributed throughout the city but concentrated in certain areas, in line with previous research findings (Gowan 2010; Herring and Lutz 2015; NLCHP 2017b), including in downtown spaces, in industrial zones, under or near freeways, and in or near green spaces. Finally, we expect more tents to be located near homeless and other social services (see, e.g., Finnigan 2021; Parker 2020).
Third, there will be an increase in the number of tents during the COVID-19 pandemic. In 2020, estimates of increased homelessness due to the pandemic predicted the tent population almost doubling the numbers of unsheltered homelessness (Flaming, Pickens, and Burns 2022; ). Tents likely increased during COVID-19 for several reasons. First, some people became homeless as a direct result of the pandemic through job loss (e.g., layoffs) or illness. 9 Second, cities such as Seattle honored “shelter in place” orders for those living in tents to reduce the spread of infection even though most tents were in violation of existing laws. Seattle’s restrictive health policy response and permissive camping allowance also may have resulted in a greater number of tents than other less politically liberal cities. Thus, we expect to find that during COVID-19, we will see an increase in the number of tents in Seattle. As data from the NLCHP (2017b) show almost two thirds of reported camps existing for more than one year, and in almost one quarter (or more) of cases more than five years, we further expect to find a high concentration of tents and tent clusters within the same geographic areas over time.
Given the ambiguity of the number of tents in Seattle, we conducted a tent census. Our census adds to the growing use of geospatial data to better assess the spatial dynamics of unsheltered homelessness (Chien et al. 2024; Semborksi et al. 2022; Shin 2023). We were initially guided by two questions: how many tents are in Seattle, and where are they located? By early 2020, however, as Seattle and King County became “ground zero” in the United States for the first stage of the COVID-19 pandemic, we added a third question: did the COVID-19 pandemic increase the number (or change the location) of tents in Seattle?
Data and Methods
Data Collection: Counting Tents
We conducted a full tent census between April and August of 2019. On the basis of the initial census, we identified areas with high populations of tent clusters that were subsequently resampled in October to December 2019 (resample 1) and July 2020 (resample 2) for comparisons over time. Our research team organized the data collection by geographic location, breaking areas down into neighborhoods with meaningful boundaries. 10 To conduct the census, we used printed paper maps as our guide for the project’s data collection. Relying on multiple means of transportation including cars, buses, bikes, and walking, our research team went street by street within the city of Seattle to find and count tents. As our research team encountered tents, we (1) recorded the location and a general description of the tent(s), (2) took pictures of the tent(s) or general area, and (3) recorded the geolocation (dropping a pin on Google Maps) with a label. 11 We logged the dates, times, locations, and number of tents seen for each specific geolocation pin for cross-referencing. We also recorded the number of tents by size of cluster, collecting data on all tent camps, sanctioned and unsanctioned.
For this project, we used traditional data collection methods, emphasizing time in the field and the fundamentals of “shoe leather,” as described by ethnographer Mitch Duneier (2004). 12 To our knowledge, this is the first systematic tent census in Seattle and one of only a few tent inventories for any major U.S. city. 13 Given the novelty of our project, we faced several challenges in accurately establishing the number of tents in Seattle. In some cases, we had to estimate the number of tents in clusters (especially near and under highways) that were inaccessible. Occasionally we had to estimate the number of tents in obscured green spaces, to protect the privacy of camp residents and alleviate concerns with safety. Our estimates may also reflect inaccuracies due to displacement over the data collection period. Displacement can often be the result of homeless “sweeps,” in which government agencies remove tents and tent camps, leaving residents to find an alternative space (sheltered or unsheltered). During the COVID-19 pandemic, however, sweeps were largely curtailed. Thus, most unsanctioned encampments, the focus of sweeps, were intact in 2020. Given the city of Seattle’s hands-off policy approach during the early stages of the pandemic, concerns about repeat counting are reduced, as people living in tents did not have to relocate. 14
We largely use HUD’s PIT homeless counts as the benchmark for comparison, despite some important differences in our design and methodology. Benefits of the traditional PIT approach are that all counts are conducted on the same night in January and include the entire metropolitan area. Although PIT counts are comparable across time, the January count likely underestimates unsheltered homelessness as many seek shelter in the coldest months. The strength of our approach is in having a well-trained research team, with multiple months to scour city streets and spaces to get a comprehensive count of tents within the timespan of data collection, across multiple seasons.
Analysis Plan
To assess our first expectation—that there will be more tents than in previous official counts—we relied solely on the full tent census, as it covers the entire city of Seattle. Calculating the number of tents was straightforward. Beyond the raw number of tents counted, we also documented the number of tents in each location (e.g., solo tents or the number of tents within a cluster) and type of tent camp (sanctioned or unsanctioned).
To assess our second expectation, whether there will be spatial patterns in the distribution of tents, we used geographic information system mapping software to plot the location of tents on the basis of the latitude and longitude recorded by our team. This produced a clear visual map of size and location of tents. We added features to the maps of both the physical environment and social infrastructure of the city, including five zones: industrial, downtown, freeways, green spaces, and social service organizations (homeless services [food, hygiene, housing, and shelters], treatment services [drugs, alcohol, and mental health], libraries, grocery stores, and drugstores) to see if tents were arrayed near these features and services. Tents were considered near transit features if they were within 40 feet of their centerlines (to include both sides of up to a four-lane street) and near physical environment or infrastructure if they were inside or within 20 feet of the designated area (to include sidewalks along features but not the other side of a typical two-lane street). Tents were considered near services if they were within 200 feet of the organizations’ addresses (to include most of the typical 240-foot Seattle city block but not the next block over). We also assessed the types and locations of tents against measures of neighborhood disadvantage including census block groups with high poverty levels and the percentage of racial/ethnic minority populations.
To address our third expectation, that there will be an increase in the number of tents during the COVID-19 pandemic, we used three time points: data from the full tent census (2019) and the two resamples (2019 and 2020). As noted above, the resample areas were selected from the full tent census, representing areas with high concentrations of tent clusters. We measure change over time by comparing counts of tents across waves within this fixed resample boundary.
Results
We find support for our three general expectations: our census revealed a larger number of tents than official counts, there were clear spatial patterns to the locations of tents, and the total number of tents in Seattle increased during the COVID-19 pandemic. Although our expectations were supported, there were some surprises regarding the size of clusters, proportion of solo tents versus tent camps, as well as the “amenability” or proximity of tents to infrastructure and social services.
Number of Tents
Using the full census, we found a greater number of tents than official estimates. The tent census revealed a total of 878 tents (838 unsanctioned and 40 sanctioned tents) in 338 distinct locations, exceeding the local PIT count. To arrive at a useful comparison with the PIT count, we made a simple transformation. The 2020 PIT count for Seattle and King County reports 1,207 homeless individuals. This number was calculated using a multiplier for the number of unsanctioned tents that were counted for the 2020 PIT. 15 To compare our number of tents with the 2020 PIT count, we reversed the multiplier to arrive at a count of 805 tents for the 2020 PIT count. 16 Our tent census number included only the city of Seattle, a substantially smaller geographic area than the broader King County included in the PIT count (see Figure 1). On the basis of the 2020 PIT count, 67 percent of the total unsheltered population were in Seattle. Assuming the same percentage across tents as in the broader unsheltered population, we can reduce the PIT tent count by about one third (about 266 tents), coming to a figure of 539 tents, which is still smaller than our count of 838 tents. Alternatively, we could convert our number of tents to individuals on the basis of the same 1.5 multiplier, yielding an estimate of 1,257 people living in tents (on the basis of 838 unsanctioned tents). Comparing this with the PIT estimate of people in tents in the Seattle area, the PIT count of 1,207 would be reduced by one third to approximately 805. Once again, the estimate from the tent census (1,257) documents more people (and tents) in Seattle than the PIT count (805).

(A) King County and (B) Seattle. The shaded area inside King County is the city of Seattle, the area sampled in the full tent census. The shaded area inside Seattle is the resampled area.
Given the lack of clarity in the city’s estimate of having 400 tent encampments, comparing our number of tents is tricky, yet we try to clarify how the city may have arrived at their number (did it include any conglomeration of tents, only unsanctioned tents, etc.). If interim mayor Burgess’s number refers to tents in camps, then our count is substantially higher. Taking a broad estimate of camps (a minimum of two tents), we find 140 camps in the census with two or more tents, totaling 679 tents. Applying a more conservative definition of camps (5 or more tents), we find 49 tent camps, totaling 456 tents. If the city and news report estimates refer to any tent camp, our count of 140 is much lower. Minimally, however, our tent census exceeds the biannual PIT counts and, in most cases, the estimates quoted by the mayor.
Size and Types (Sanctioned vs. Unsanctioned and Solo vs. Clusters)
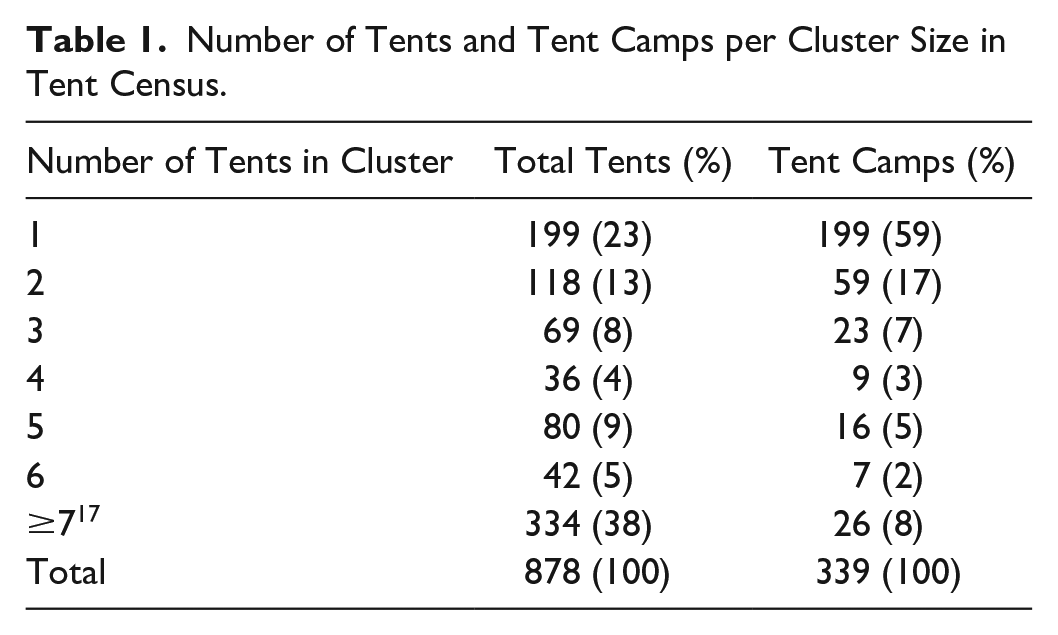
Consistent with previous research and counts, the majority of tents counted were unsanctioned (95 percent). Table 1 illustrates the number of tents we found and their distribution by size of cluster. Our expectation of finding a higher proportion of medium-sized and large tent clusters was partially supported by the data. Tent clusters ranged in size from 2 to 44 tents, averaging 5 tents (with a mode of 2 and median of 3). Tents in medium-sized and large tent clusters represent more than half (56 percent) of all tents in Seattle, but these represent only 18 percent of tent camps, as seen in Table 1. Tents in medium-sized clusters were only 18 percent of total tents and 10 percent of all tent camps. Tents in large clusters are 38 percent of all tents in Seattle, however, these large clusters represent only 8 percent of tent camps with just 11 clusters having more than 10 tents. Surprisingly, solo tents account for almost a quarter (23 percent) of all tents in Seattle, representing 59 percent of cluster sizes.
Number of Tents and Tent Camps per Cluster Size in Tent Census.
Spatial Distribution Of Tents
The spatial clustering of tents was evident in the census, leading us to conduct two resamples to track areas highly populated by tents. In accord with findings from previous research, we anticipated finding patterns where tents were located, with higher concentrations of tents in industrial zones, downtown spaces, green spaces, near social services, and in areas of disadvantage. Although the data generally support the expected spatial patterns, there were also notable differences in what we found. Figure 2 illustrates the locations of tents, infrastructure, social services, and disadvantage.

Spatial patterns of tents in the full tent census. (A) Built environment features. (B) Services and amenities. (C) Percentage of households under the poverty line. (D) Percentage racial/ethnic minority population.
Industrial Zones, Downtown Spaces, and Freeways
As illustrated by Figure 2, tents are concentrated along the Interstate 5 and State Highway 99 freeways, Seattle’s main north/south arterials. 18 The majority of clustered tents/camps are along the freeways, including under bridges. The largest tent camps are also concentrated in the downtown core which are mostly located by a freeway or in industrial zones (see Table 2). What did surprise us, however, was the number of tents in residential, single-family zones. 19 Taking a closer look at these neighborhood tents, we found them to be largely located in somewhat ambiguous spaces, including arterials, traffic circles, on sidewalks or outside of vacant storefronts. Finding tents in residential neighborhoods—not in industrial areas, or low- to medium-income census tracts—was unexpected. In fact, almost all Seattle neighborhoods had tents.
Tent and Tent Camp Size by Physical and Social Features.

Note: Totals are not column sums, as camps can be in or near multiple features.
Green Spaces
We also expected to find tents in green spaces, which was supported by the data, as we find tents on hillsides, near rivers, and in public parks. These locations allow tents to be somewhat hidden from public view and thus more amenable. Figure 2A indicates that tents are located in several of the city’s larger green spaces, including the grassy periphery of Green Lake (north Seattle), along the canal (central Seattle), and along hillsides (south Seattle). Figure 2 also shows smaller tent clusters concentrated on the western side of the city’s canal, as well as the western side of South Lake Union.
Social Service Organizations
Previous research indicates that tents are often concentrated near social service organizations to facilitate access to these services. Our tent census, however, did not support this, showing a lack of tents concentrated near these organizations. Even using multiple buffer zones (from 50 to 200 feet), we found that tents were infrequently found near social services or other amenities, as indicated by Figure 2B.
Social Disadvantage
We expected to find a large number of tents in areas with higher levels of disadvantage. We did not, however, find a clear pattern between tents and areas of high poverty or racial/ethnic minority populations. Given the lower rates of poverty and racial/ethnic minorities in Seattle this is not necessarily surprising. As shown in Figures 2C and 2D, although there are certainly clusters in some higher poverty or minority areas, such as in the east edge of downtown and along the freeway near the University of Washington, tents are also largely absent from other higher poverty or minority concentrated areas. As a result, there are only weak correlations between the counts of tents and block-group poverty (0.16) or percent minority population (0.1).
Change and Stability (before and during COVID-19)
Last, we expected to find an increase in tents because of the COVID-19 pandemic. Comparing the areas of highly concentrated tent clusters over time reveals several patterns, including change in the number of tents and degree of location stability. In assessing change during the pandemic, we look at the number of tents in the resample area for the two time points, autumn 2019 and summer 2020 (see Table 3). The data taken in the resamples reveal an increase in the number of tents during the COVID-19 pandemic. The first resample (October to December 2019) yielded 412 total tents, while the second (July 2020) yielded 633 total tents, an increase of 220 tents (or 53 percent). The difference from fall to summer is consistent with seasonal variations in homelessness, resulting in greater numbers in warmer months. Although we might expect an increase in tents because of warmer weather, the dramatic increase in the total number of tents in the city points to three plausible explanations. The first is that the impact of the pandemic significantly increased tent-based homelessness. Next, because the resample areas only targeted areas populated with higher concentrations of tents, some of the solo or smaller tent clusters in other areas of the city may have gravitated toward these areas during the pandemic, explaining an increase in total tents. Last, the dramatic increase in tents could be accounted for by a combination of both these explanations.
Tents within Resample Area by Cluster Size and Period.

Along with finding an increase in tents because of the COVID-19 pandemic, we also expected to see some degree of stability in tents and tent clusters and location over time. Restricting the tent census for time point 1 to the same geographic area as the two resample map locations, we are able to compare tents and tent camps across three data points. There seems to be some stability among camps in high-concentration areas (see Figure 3). As expected, collections of tents are spatially clustered in Seattle’s downtown region, where the full census counted 159 tents. In the first resample, the city’s downtown region had 106 tents, which follows the pattern of fewer tents in the winter season. 20 In the second resample, during the summer of 2020, the number of tents spiked to 261.

Tent census and two resamples.
Although there is stability across time in location of tents, there is less stability in the size of tent clusters. In terms of tents, the number of single tents was about the same over all three time points, hovering around 100 total solo tents (see Table 3). The major differences emerged in comparing the first and second resamples, with a dramatic increase in the number of medium-sized and large camps (4 or more tents). Table 4 shows the number of tent camps over time. In assessing the size of camps between time 1 and time 2, the number of camps decreased regardless of cluster size. Small camps decreased by 23 percent, medium-sized camps by 48 percent, and large camps by 53 percent. As noted above, it is common to have a reduction in tents and tent-based homelessness because of seasonal change; colder weather results in fewer tents, whereby some tent residents shelter indoors. The biggest change is the increase of medium-sized and large camps between time 2 and time 3: medium-sized camps grew by 130 percent and large camps by 150 percent (small camps grew by only 9 percent). The significant increases in medium-sized and large camps may reflect the increase in total tents during the COVID-19 pandemic, as well as seasonal variation. In looking at change between time 1 and time 3, to account for seasonal variation (comparing summer with summer), there are still increases in medium-sized and large camps of 20 percent and 18 percent, respectively. Therefore, the location of tent clusters remains stable, while there is significant variation in tent cluster size across our time periods.
Total Tent Camps by Camp Size and Period.

Discussion
There are several takeaways from our tent counts, some consistent with expectations from prior research and some surprises. Our first set of expectations regarding the number, type, and size of tents was largely confirmed with some important caveats around the variation in size of tent clusters. We expected to count more tents than official estimates, that the majority of the tents would be unsanctioned, and that there would be a large percentage of medium to large clusters. We found a greater number of tents (n = 878) across the city of Seattle than previously reported estimates. Even assuming some double counting of tents, it appears that the PIT data underestimate tent-based homelessness, while taking some of the count’s limitations (e.g., January collection) into consideration. The large number of tents in the census aligns with national reports on the rise of tent-based homelessness across the United States (Cohen et al. 2018; Herring 2014).
In terms of the types of tents, we found that they were almost exclusively unsanctioned (95 percent), consistent with recent shifts in tent-based homelessness in Seattle and along the West Coast (NLCHP 2014, 2017b). The breakdown in types of tents—single versus clusters of tents—was not straightforward, as we found more variation than hypothesized. In the tent census, we found a large percentage of total tents as part of medium-sized and large clusters (56 percent), yet these represented only 18 percent of total tent camps. There was a surprisingly large number of solo tents (23 percent of all tents), which represented more than half (59 percent) of tent clusters. This is surprising because media and research reports focus on large camps (usually unsanctioned encampments), which are characterized as having increased health and safety risks including violence, police interventions, and sweeps (Brownstone 2021; Johnson 2016). Furthermore, although people may not like seeing solitary tents in their neighborhoods, the ire expressed in public forums and media accounts seemed to be attached to larger tent clusters, often cited as eyesores and connected to crime and disorder. These stereotypes may influence the choice to avoid being part of any size tent camp, especially large camps, resulting in the high percentage of solo tents. It may also reflect atomization of individuals. This finding suggests the focus on large camps misses a significant pattern within tent-based homelessness. It also raises questions about why tents are clustered. In fact, there may be several conflicting explanations for a tent’s proximity to other tents. Some individuals may seek to locate their tents near others for safety or community, while others may choose location by topography or availability. Qualitative data are needed to get behind the reasons for various tent configurations.
Our second expectation—clear spatial patterns where tents were located—was supported and mostly consistent with previous studies on the clustering of homelessness including “homeless hot spots” (Chien et al. 2024; Ward et al. 2023). We found tents in greater concentrations in certain areas of the city, including industrial zones, downtown areas, and along highway underpasses, similar to previous research (Finnigan 2021). Relatedly, concentrations were also found in green spaces, often near freeways or waterways (Parker 2020). Some tents were hidden and tucked away to be out of sight or in nonresidential areas, in line with research that links tents to the periphery (Gowan 2010) or marginalized spaces (Herring and Lutz 2015).
Surprisingly we did not find a relationship between the location of tents and social service organizations and other amenities. In his study of Oakland, Finnigan (2021) reported tent encampments clustered near large homeless organizations, a pattern not found in the Seattle data. In addition, a different analysis based on data from Seattle concluded that people living in camps prioritized living near amenities (Sutton et al. 2024), which we did not find. Instead, we found a high percentage of solo tents, which were often located in residential neighborhoods in somewhat ambiguous spaces, including arterials, traffic circles, on sidewalks, and outside of vacant storefronts which may reflect a shift to pitching tents beyond urban marginal spaces to more “transitional” spaces (Snow and Mulcahy 2001). These spaces may have been seen as safer spaces (residential areas). The choice of pitching a tent in ambiguous spaces may carry less risk, as there is no clear person or business to which reports or complaints can be addressed. Perhaps this represents a different type of amenity for people experiencing homelessness or is simply a unique feature to Seattle. This may provide evidence that homeless individuals are distancing themselves from these service centers. It may also be the case that services are decentralized or that certain kinds of social support are dispersed by other means (e.g., cell phones), reducing the need to physically be near social service centers.
We also did not find a clear pattern between tents and areas of high poverty or racial/ethnic minority populations, which is inconsistent with previous research (Finnigan 2021; Shin 2023). This could be part of Seattle’s unique socioeconomic environment. Seattle is not a high-poverty city and has lower representation of many racial and ethnic minority groups. A tent census, however, is a more holistic measure and suggests that a comprehensive count of tents across the whole city (not just highly populated areas or areas identified through outreach) may lead to different findings.
Our third expectation relates to change and stability over time. Regarding change, we found that tents increased during the COVID-19 pandemic. This increase is consistent with the predicted pattern (Flaming et al. 2022; Kaur 2020) and findings from similar tent counts in Los Angeles neighborhoods (Ward et al. 2022, 2023). The high cost of living and rapid rate of inflation in Seattle may have added to those that were already precariously housed before the pandemic. If not for federal and local interventions through relief subsidies and eviction moratoriums during the pandemic, the increase may have been much higher.
The question of stability of tents is more complicated. First, we find stability in the location of tents over time. Tents remain concentrated in certain areas of the city across all three time periods of our data collection. Although there is stability across time in the location of tents, there is less stability in the size of tent clusters. Our data support previous research showing seasonal variations in tents and tent camps. Between time 1 (spring and summer 2019) and time 2 (autumn 2019) the number of tent camps, regardless of size, decreased. Between time 2 and time 3 (summer 2020), during the pandemic, all tent camps increased, regardless of size. Medium-sized and large camps, however, show dramatic increases, 130 percent and 150 percent, respectively. Recognizing that tent camps often shift across seasons, we also compare time 1 with time 3 to see change within similar seasons. Interestingly, small camps decrease by 16 percent, but medium-sized and large camps grow (20 percent and 18 percent, respectively), showing that, apart from well-documented seasonal variations, there was an increase in overall tents, and they are concentrated in larger clusters. It may be that over time, those living in solo tents gravitated toward other tents as a part of a homeless socialization process whereby they learn that being alone is risky and thus seek out more security and trustworthy neighbors.
Conclusion
Conducting a tent census gives us new purchase on old questions about how to collect reliable and comprehensive data on the number and location of tents, size of tent clusters, and change over time. Tent-based homelessness is a distinct challenge for West Coast states and cities. With the third highest rate of homelessness among state (Washington) and city, Seattle offers an opportunity to better understand the proliferation of tent-based homelessness. Our data reveal that tents are substantially more numerous in Seattle than official estimates, with complex spatial patterns to tent locations and clusters, and nuances surrounding change and stability of tents and tent camps over time. Some of this may be attributed to Seattle’s unique economic and political environment. Collecting tent census data across more cities would be useful to better understand the extent of tent-based homelessness in light of several factors (economic, political, geospatial, etc.) within each urban context (such as has been done in Oakland [Finnigan 2021] and Los Angeles [Ward et al. 2024]).
These patterns are crucial to understanding the scope of the problem and to craft effective policies and interventions to better address the needs of people living in tents. The growth in unsheltered homelessness has raised concerns given the increased health risks associated with living unsheltered (Richards and Kuhn 2023), with many advocating for alternatives such as city-sanctioned tent cities and housing first policies (Jones et al. 2015). While our research offers a snapshot of tent-based homelessness in one major city for three time points, it provides a fuller account of tents in the broader cityscape.
Drawing from this research, we offer a few policy implications. First, multiple counts are needed at different times of the year (e.g., January and June to avoid undercounting in cold weather months), which is being done in highly concentrated homeless areas in Los Angeles (Ward et al. 2024). A more robust count, like ours in Seattle, can yield different findings than yearly (or biannual) one-night counts or counts focused on selective areas of a city. The strength of our census was that it included the entire city, allowing us to find unexpected patterns not documented in other studies, such as more solo tents and tent locations in unexpected spaces (beyond the downtown core or industrial zones). This suggests that the traditional focus on services in downtown spaces might need to also include more robust mobile responses to bring services to more tent and tent camp locations. Second, there is great value in expanding integration of academic research to inform responses to tent-based homelessness. There are several examples of university partnerships such as LA LEADS and the revised methodological design in Seattle’s PIT counts. 21 However these shifts often rely on technological innovations (as did Finnigan’s study of Oakland), such as algorithms as opposed to traditional fieldwork. Our research design highlights the importance of “shoe leather” (Duneier 2004) and allowed us into hard-to-reach spaces that cannot be easily captured in traditional PIT or street view maps. A tent census can also be replicated in other cities to deepen the understanding of patterns in tent-based homelessness. Future work should also compare different methods of counting tents (e.g., using Google Street View and PIT counts) and further document tent size using more advanced multipliers (Ward et al. 2024) to better assess the accuracy of these research designs. Future research studies should also include interview data with individuals living in different tent configurations to get behind the reasons influencing these tent patterns.
Footnotes
Acknowledgements
We would like to thank the student research team involved in this project. This article benefited from a department workshop at Chapman University. Comments from attendees were influential in revising the article. Many thanks to Chris Bader, Ed Day, Ashley Kranjac, Kristen Koenig, Roberta Lessor, Steve Pfaff, Nancy Rios-Contreras, Pete Simi, and David Snow.
Funding
The author(s) disclosed receipt of the following financial support for the research, authorship, and/or publication of this article: This research data collection was funded in part by several small grants from Seattle Pacific University’s Spiritual and Education Resources for Vocational Exploration (SERVE) Grant Program, Seattle Pacific University’s College of Arts and Sciences Undergraduate Research Fund, and Phinney Ridge Lutheran Church’s Endowment Fund.