
Abstract
The relationship between income and voter turnout is crucial to understanding U.S. democracy. Previous research has revealed that richer people tend to vote at higher rates than lower income people. But this research relied on survey data and was subject to response and social desirability bias, producing widely varying estimates of the size of the income-based turnout gap. Using data with official, geocoded precinct election results for the entire nation, the authors examine how precinct-level income is associated with changes in voter turnout between the 2016 and 2020 elections. The authors find a dramatic income gradient in precinct voter turnout and that this inequality became larger in 2020 compared with 2016. When comparing top-decile precincts with bottom-decile precincts (>$121,000 vs <$38,000), the authors estimate turnout gaps of 17 percentage points in 2016 and 27 percentage points in 2020. These results are robust in regression analysis controlling for critical features and spatial dependence.
Keywords
Do resources and economic context shape patterns of voting? Most research on place, income, and voting focuses on who people vote for (i.e., Democrats or Republicans) (Hersh and Nall 2016; Ogorzalek, Piston, and Puig 2020), but little research interrogates the link between geography, income, and the fundamental basis of our democracy: who votes in the first place. Economic inequalities (i.e., when people from poorer communities vote less than those from better-off ones) threaten the integrity of electoral representation. Research consistently shows that people who have higher incomes vote at higher rates than those with lower incomes (Schlozman, Brady, and Verba 2018), but estimates of the scope of this inequality vary substantially (Laurison and Rastogi 2023). In part, this is because this research relies on survey data rather than real election results data, only recently made accessible for the 2016 and 2020 elections (Voting and Election Science Team 2018, 2020). These newly available geocoded, cleaned, nationwide datasets allow us to investigate income inequality in voting at the smallest geography used to conduct elections, the precinct.
For this study, we draw from these precinct-level datasets for the entire nation in the 2016 and 2020 presidential elections. We ask two key research questions: First, do higher income precincts show greater voter turnout than lower income precincts? Second, if income inequality by precinct exists, did this inequality get larger, smaller, or stay the same in 2020 compared with 2016? Our data cover more than 125,000 precincts and 117 million votes in 2020, with an estimated 188 million voting-age residents. Using regression analysis, we show that income is a critical feature of place that is strongly associated with voter turnout. Not only do people in higher income precincts vote at substantially higher rates than those in poorer precincts, but this inequality increased in 2020 compared with 2016. We estimate that 50 percent of adults in precincts in the bottom decile of income (those where median household incomes were $38,000 or less) voted in both years; top-decile precincts (median household incomes more than $121,000) had 67 percent turnout in 2016, but turnout increased to 77 percent in 2020. In other words, the highest earning precincts showed dramatic increases in turnout in 2020—by 10 percentage points on average—but the lowest earning precincts showed little to no change. Overall, voter turnout in the 2020 election was higher than it had been since 1904. Because higher turnout, by definition, means more representation, we might expect this to coincide with more equal representation. Instead, our analyses show that at least in 2020 compared with 2016, higher overall participation came with greater overall income inequality in voting.
This study is the first we know of to examine the relationship between income and voter turnout nationally using real election results data at the hyperlocal geography of precincts. We deploy new data sources that allow us to study voting behavior at the finest grain geographic level possible. This differs from previous research in two crucial ways: First, studies of inequalities in turnout rarely use official election results; rather these studies only use individual-level survey data, which scholars have shown to suffer from data quality issues (DeBell et al. 2020; Duff et al. 2007; Fraga 2016; Herrick and Pryor 2024; Hersh and Nall 2016). Second, studies that do use precinct-level data focus on vote choice (e.g., whether people voted for Democrats or Republicans) (Hersh and Nall 2016; Hill, Hopkins, and Huber 2019; Rastogi and Jones-Correa 2023), racial turnout gaps rather than income (Amos and McDonald 2024; Morris and Grange 2024; Morris and Shoub 2024; Pettigrew 2021; Zingher and Moore 2019), and/or restrict their scope to a small subset of the United States (Cantoni 2020; Cortina and Rottinghaus 2023). As national elections are increasingly close, it is critical that scholars and political practitioners understand the classed contours of political participation.
The Relationship among Income, Voter Turnout, and Survey Research
A long stream of research on class and voter turnout focuses on income, education, or the combination of the two. 1 Studies going back to the 1970s have consistently found that higher income and better educated Americans are more likely to vote than their lower income and less educated counterparts (Anderson 2018; Brady, Verba, and Schlozman 1995; Leighley and Nagler 1992, 2014; Nie, Verba, and Petrocik 1979; Piven and Cloward 1988, 2000; Schlozman, Verba, and Brady 2012; Tenn 2005; Verba and Nie 1987; Verba, Nie, and Kim 1971; Verba, Schlozman, and Brady 1995). We are thus very confident that an income gap in voting exists; however, recent estimates of the size of the income gap vary. Most of these studies model the relationship between class and turnout using logistic regression; these studies report positive coefficients for income and education, but do not provide direct estimates of the size of the class turnout gap. For example, Schlozman et al. (2012:155) estimated that those in the top income quintile had turnout rates from 1.36 to 2.09 times higher than those in the lowest income quintile between 1952 and 2008. Studies that report voting rates directly find that those toward the top of the income distribution have a turnout rate anywhere from 8 to 36 percentage points higher than those toward the bottom (with variation in how those groups are defined) (Laurison and Rastogi 2023; Laurison et al. 2022; Nelson 2023).
These widely varying estimates of income inequality may be the result of known issues with survey data on voters: response bias, social desirability bias, and differences between samples in different surveys. For response bias, politically engaged people are more likely to respond to surveys, biasing estimates of turnout upward (Ansolabehere and Hersh 2012). For social desirability bias, almost all prior research relies on voter self-reports, and between 8 percent and 24 percent of survey respondents report voting when they did not (Ansolabehere and Hersh 2012; Belli, Traugott, and Beckmann 2001; Duff et al. 2007; Silver, Anderson, and Abramson 1986). Furthermore, this bias affects our independent variable (income) because better-off people are more likely to report voting when they did not. Matching respondents to public voter files (i.e., voter validation) improves this issue marginally, but it still produces total turnout estimates that differ substantially from actual election returns (Fraga and Holbein 2020; Selb and Munzert 2013). As for differences in surveys, we estimated income inequality in turnout from 2016 to 2020 in a previous study (Laurison and Rastogi 2023) using two different well-respected survey datasets with voter validation (the Pew American Values Survey and the Cooperative Election Studies) and found the gap between the highest and lowest income groups was 1.5 times larger in the Pew data (36 percentage points) than in the Cooperative Election Studies data (24 percentage points) for 2020. In other words, well-respected survey data from two sources for the same election years provided us with class turnout gap estimates of substantially different magnitudes.
Given issues of bias in survey data, we need studies of income inequality in voter turnout using real election results—the actual number of votes in a given precinct—to create more accurate estimates. Official election results data do not describe individuals; we cannot make claims about the relationship between individual income and voting, but we can describe the economic context of place and voting. Given that we are using a hyperlocal geography of the precinct—the smallest geography available for voting data—we can reasonably assume that aggregate class context affects the local environment in which voters live. We estimate in our data that the median precinct was composed of 1,083 individuals older than 18 years in 2020. Therefore, by using these official results data, we can produce an accurate estimate of the hyperlocal economic context of voting.
Hypothesizing Income and Voter Turnout in the 2016 and 2020 Elections
The 2020 presidential election broke records for voter turnout. The portion of those eligible who cast a ballot was six percentage points higher than in 2016, which was within the typical range for the preceding three elections (between 58.6 percent and 61.6 percent) (McDonald 2020). In this analysis, we leverage this dramatic change in voting to ask, first, do higher income precincts show greater voter turnout than lower income precincts? Second, if this income inequality in turnout by precinct exists, did this inequality get larger, smaller, or stay the same in 2020 compared with 2016? As discussed earlier, ample research shows that higher earning people vote at higher rates than lower income people, suggesting that higher income precincts will have higher turnout than lower earning precincts.
As for the second question, there are many reasons to expect differences in income inequality in turnout between 2016 and 2020, though none that we test directly in this study. Chief among these is the coronavirus disease 2019 (COVID-19) pandemic, which reshaped every aspect of our daily lives, including both campaigning and voting, in 2020 and beyond. Usual approaches to in-person campaigning were disrupted and delayed (Breuninger and Wilkie 2020; Epstein 2020; Goldberg 2020; Matthews 2020). Research on the effect of COVID-19 on the 2020 election has indicated that disease rates and excess deaths mortality may have affected both turnout and vote share, though none look at the relationship between income and COVID-19 impacts (Baccini, Brodeur, and Weymouth 2021; Clarke, Stewart, and Ho 2021; Parzuchowski et al. 2021). Although there was an upswell of new Democratic and progressive organizing in the wake of Trump’s 2016 election (Gose and Skocpol 2019), it is not clear what expectation we should have about its effects on income inequality in turnout. Some studies have shown that intensive get-out-the-vote efforts can increase inequality, because they generally target occasional voters, who are on average higher income than people who have rarely or never voted; when the rate of voting goes up disproportionately among the better-off, the voting gap between low- and high-income people increases as well (Enos, Fowler, and Vavreck 2014; Nickerson and Rogers 2014; Spencer and Ross 2024).
Another factor was the widespread increase in the availability of mail-in voting due to the COVID-19 pandemic. Mail-in voting reduces barriers to participation by allowing people to cast ballots from home at times that are convenient for their schedules. One might expect, then, that mail-in voting would reduce income-based participation gaps; however, the evidence is quite mixed. In some cases, increasing the ease of access to voting increases inequality in political participation because higher propensity voters become more likely to vote after reforms, while people who rarely or never vote, who are disproportionately lower income, do not turn out at much higher rates (Berinsky 2005; Burden et al. 2014; Nickerson 2015). Some studies show no effect of mail-in voting on turnout rates or partisanship, while others have found that mail-in voting, when part of a comprehensive slate of reforms, increased turnout and reduced participation inequalities (Berinsky, Burns, and Traugott 2001; Bonica et al. 2021; Elul, Freeder, and Grumbach 2017; McDonald et al. 2024; Thompson et al. 2020).
Prior research on income inequalities in participation is based on surveys of individual respondents, but there is every reason to expect that these patterns would aggregate at the precinct level. Therefore, our key hypotheses are:
Hypothesis 1: There will be inequality in voting by income: higher income precincts will show higher rates of voting compared with lower income precincts.
Hypothesis 2: This inequality will be larger in 2020 compared with 2016 (i.e., increased voter turnout in 2020 will have occurred disproportionately in higher income precincts).
Data and Methods
Data
National precinct-level voting and mapping data come from the Voting and Election Science Team (2018, 2020). These are the first freely available data to provide comprehensive precinct-level voter data for each state in the nation. These datasets contained roughly 158 million votes for president in 2020 and 136 million votes for president in 2016, consistent with national voter turnout data (McDonald 2020). Most studies of place use much higher aggregate-level election returns (such as counties, which can be very large, encompassing whole cities). But precincts are substantially smaller; we estimate that the median precinct had a voting-age population of only 1,083 people in 2020. In the median precinct, 602 people voted in 2016 and 650 in 2020.
Population and socioeconomic data come from the U.S. Census Bureau and the National Historical Geographic Information System (Manson et al. 2023). These data come from the 2020 census and the 2021 American Community Survey (ACS) five-year estimates, which cover both 2020 and 2016. Using these data simplifies our analyses by providing a point-in-time estimate of population and socioeconomic context. Local geographies across the rural-urban continuum are unlikely to change dramatically over a four-year period in both population and socioeconomic context. Furthermore, given that this is a very large national dataset, places with dramatic changes in population and socioeconomic context will be rare and will not affect overall trends in the data. 2 We further address this situation by limiting the sample to precincts whose boundaries did not change between the two election years (see the “Sample” section) to ensure that administrative changes in precincts do not affect the analysis.
We estimate precinct-level voting-age population and median household income by attaching Census data to voter data using geographic information system methods. We overlay precinct election maps with census and ACS maps (block and block group, respectively) to find how precincts intersect with census geographies. We calculate areal overlap (i.e., the percentage of blocks and block groups that fit within the precinct) and weight population and socioeconomic data to create a precinct-level estimate of population and income.
Sample
Our research questions are about the relationship between income and turnout by precinct in 2016 and 2020. To compare across years, we limit the sample to precincts whose boundaries did not change between the two elections. Precincts are administrative units with little social meaning; they are subject to change arising from decisions by local authorities. Limiting the sample to precincts with fixed boundaries ensures that changes in voter turnout are not due to administrative changes in precinct size. 3 This inclusion criterion provides a sample of 125,127 precincts, which represented roughly 117 million voters in 2020 and 102 million voters in 2016. These data cover roughly 75 percent of all voters in both years and are the most comprehensive data for an analysis of this kind. Roughly 188 million voting-age people lived in these precincts in 2020. See Appendix D for a sensitivity analysis showing that the excluding these precincts does not substantially affect our conclusions.
Table 1 provides the summary statistics. The median precinct we analyze had 606 votes in 2016 and 675 votes in 2020 with an estimated voting-age population of 1,083 in the ACS estimates covering both 2016 and 2020. Moreover, the median precinct had 65 more votes in 2020 compared with 2016. The median precinct had a median household income of $66,000.
Summary Statistics.

Sources: Voting and Election Science Team, 2020 census, and 2021 American Community Survey five-year estimates.
Note: N = 125,127 precincts.
Variables of Interest
Outcome Variable 1: Absolute Voter Turnout
This outcome variable is the number of votes in a precinct in each year and we treat this as a repeated-measures analysis (one measurement each for 2016 and 2020 for an individual precinct). In descriptive analyses, we standardize this number by dividing by the voting-age population as a measure of turnout. In regression analyses, we control for voting-age population.
Outcome Variable 2: Change in Voter Turnout
We analyze change in voter turnout by calculating the difference in number of votes in 2016 and 2020 for a given precinct (i.e., 2020 votes minus 2016 votes).
Focal Explanatory Variable: Median Household Income
Our focal explanatory variable is percentile-ranked median household income. The distribution of median household income has a long right tail (e.g., the 75th percentile was $89,000, but the maximum value was $250,000; see Appendix B for analyses of untransformed median household income). We percentile-rank median household income to emphasize the parts of the distribution in which the vast majority of voters live. To provide greater socioeconomic context, Appendix C provides analyses of poverty and college education rates as well.
Regression Analysis
Regression for Absolute Voter Turnout
Because voter turnout is count data (the count of the number of votes in a precinct), we conduct a negative binomial regression. We first used Poisson regression but found that our data were overdispersed (i.e., that the mean did not equal variance, a critical requirement for Poisson regression). Negative binomial regression addresses this issue by estimating a dispersion parameter. In descriptive analyses, we present turnout as the share of voters over the voting-age population, but we do not conduct logistic regression here for this proportion because the voting-age population is an imperfect estimate of the voting-eligible population. 4 Exploratory analyses suggest a cubic relationship between voter turnout and income; therefore, we include a main effect, as well as a quadratic and a cubic term for income. As this is a repeated-measures analysis, we include a term for the election year and interaction terms between year and income variables to examine whether the slopes differ between years.
Regression for Change in Voter Turnout
We conduct an ordinary least squares regression with a spatial lag for change in voter turnout (i.e., the number of votes in 2020 minus the number of votes in 2016). We can perform this analysis because we limited our sample to precincts that remained stable across the two election years. We do not do a regression of percent change (i.e., 2020 votes minus 2016 votes divided by 2016 votes) because ratios are often problematic in regression analysis and this variable had a highly nonnormal distribution. 5 Exploratory analyses suggest a curvilinear relationship between precinct income and voter turnout; therefore, we include a main effect for median household income as well as a quadratic term and a cubic term.
Controls
We use the same set of controls for both regressions. As precincts vary in size, we control for the population older than 18 years as a measure of the voting-eligible population. We take the log of the population older than 18 years to reduce outliers. Because this is a national analysis, we include fixed effects for state to control for geographic variation and state-specific effects on voting (e.g., cost of living, policies that reduce or promote voter turnout).
Last, we include a spatial lag variable to address spatial autocorrelation (Rastogi and Curtis 2020). Social processes typically cluster in space, because nearby places are typically more alike compared with places farther away (Tobler 1970). This clustering potentially biases inferences (i.e., standard errors, confidence intervals, and p values) because regression analysis assumes observations are independent even when they are correlated in space (i.e., neighboring precincts will often show similar turnout rates). We use two methods to address such spatial autocorrelation. First, we use empirical standard errors that are robust to autocorrelation (heteroskedasticity). Second, we create a spatial lag variable that captures voter turnout of neighboring precincts to parameterize the spatial autocorrelation remaining in the data after accounting for heteroskedasticity (see Anselin 1988, 1990; Voss, Curtis White, and Hammer 2006 for a discussion of spatial dependence and spatial heterogeneity). We identify neighboring precincts using the queen contiguity method: precincts are neighbors if their boundaries touch at any point. For the first regression, we calculate a weighted “spatially lagged” voter turnout for the corresponding spatial cluster. Therefore, the spatial lag for a specific precinct is the voter turnout for its neighboring precincts. We take the log of this variable to reduce outliers. For the second regression, we calculate the weighted spatially lagged change in voter turnout.
Results
Hypothesis 1: Inequality in Voting by Income
We first ask, do higher income precincts show greater voter turnout than lower income precincts in the 2016 and 2020 elections? Our results support hypothesis 1 that a steep income gradient exists by precinct-level median household income. Figure 1a shows the descriptive smoothed means graph of precinct-level voter turnout for 2016 and 2020 by percentile-ranked median household income. We standardize voter turnout (y-axis) by our estimate of the precinct voting-age population since precincts vary substantially in size. Voting-age population is not the voting-eligible population, but we can roughly interpret this number as percent turnout. 6 This graph suggests important findings consistent with hypothesis 1. In both years, higher income precincts showed substantially greater turnout. The highest income precincts (top decile, median household income > $121,000) showed a turnout of greater than 67 percent in 2016 and 77 percent in 2020; the lowest earning precincts (bottom decile, median household income < $38,000) showed a turnout of roughly 50 percent or less in both years.

(a) Descriptive smoothed means graph of precinct-level standardized voter turnout by percentile-ranked median household income and (b) regression results of predicted absolute voter turnout by percentile-ranked median household income.
Regression analyses further confirm the findings and support our hypotheses (Figure 1b). We use numbers of votes, rather than estimated percent turnout, as the dependent variable in these models. We detail this modeling strategy in the materials and methods section. Figure 1b shows the margins for the negative binomial regression predicting precinct-level voter turnout in each election year (see Appendix A for the regression table). Thus, we can interpret the y-axis as the average number of votes when other variables are set to their mean or reference category (e.g., mean voting-age population). For example, the average precinct with median household income at the 75th percentile of income ($89,000) had roughly 1,000 votes in 2020 but 900 votes in 2016. This figure looks similar to Figure 1a, which showed voter turnout increasing with median household income, supporting hypothesis 1.
Hypothesis 2: Greater Inequality in Voting by Income in 2020 Than 2016
We now move onto our second research question: in an election year with record-breaking turnout (2020), did this inequality get larger, get smaller, or stay the same compared with 2016? Our results support hypothesis 2, that increased turnout occurred disproportionately in higher income precincts, resulting in greater inequality in voting. Returning to Figure 1a, the increase in turnout in 2020 was uneven across incomes: the curve is much steeper for 2020 compared with 2016. There was a 17 percentage point gap in 2016 between the highest and lowest income precincts (top decile, 67 percent; bottom decile, 50 percent), but this gap expanded to 27 percentage points in 2020 (top decile, 77 percent; bottom decile, 50 percent).
To highlight this point, we provide a descriptive figure of the precinct-level difference in voter turnout between the two elections (Figure 2a). The y-axis is 2020 votes minus 2016 votes standardized by the estimated voting-age population. This metric can be roughly interpreted as the percentage point change in turnout between the two years. Therefore, a value of 4 indicates that the number of voters in that precinct was 4 percentage points higher in 2020 than in 2016. As we discuss in the materials and methods section, we compared turnout within precincts which had no boundary changes between the two elections. Therefore, the difference in voter turnout between years is a direct comparison for the same geography. This graph is consistent with hypothesis 2, that the overall increase in voting in 2020 was associated with greater inequality in turnout. Higher median-income precincts (75th percentile, >$89,000) had roughly 9 percentage points more voters in 2020 compared with 2016; the lowest income precincts showed no increase in voter turnout in 2020.
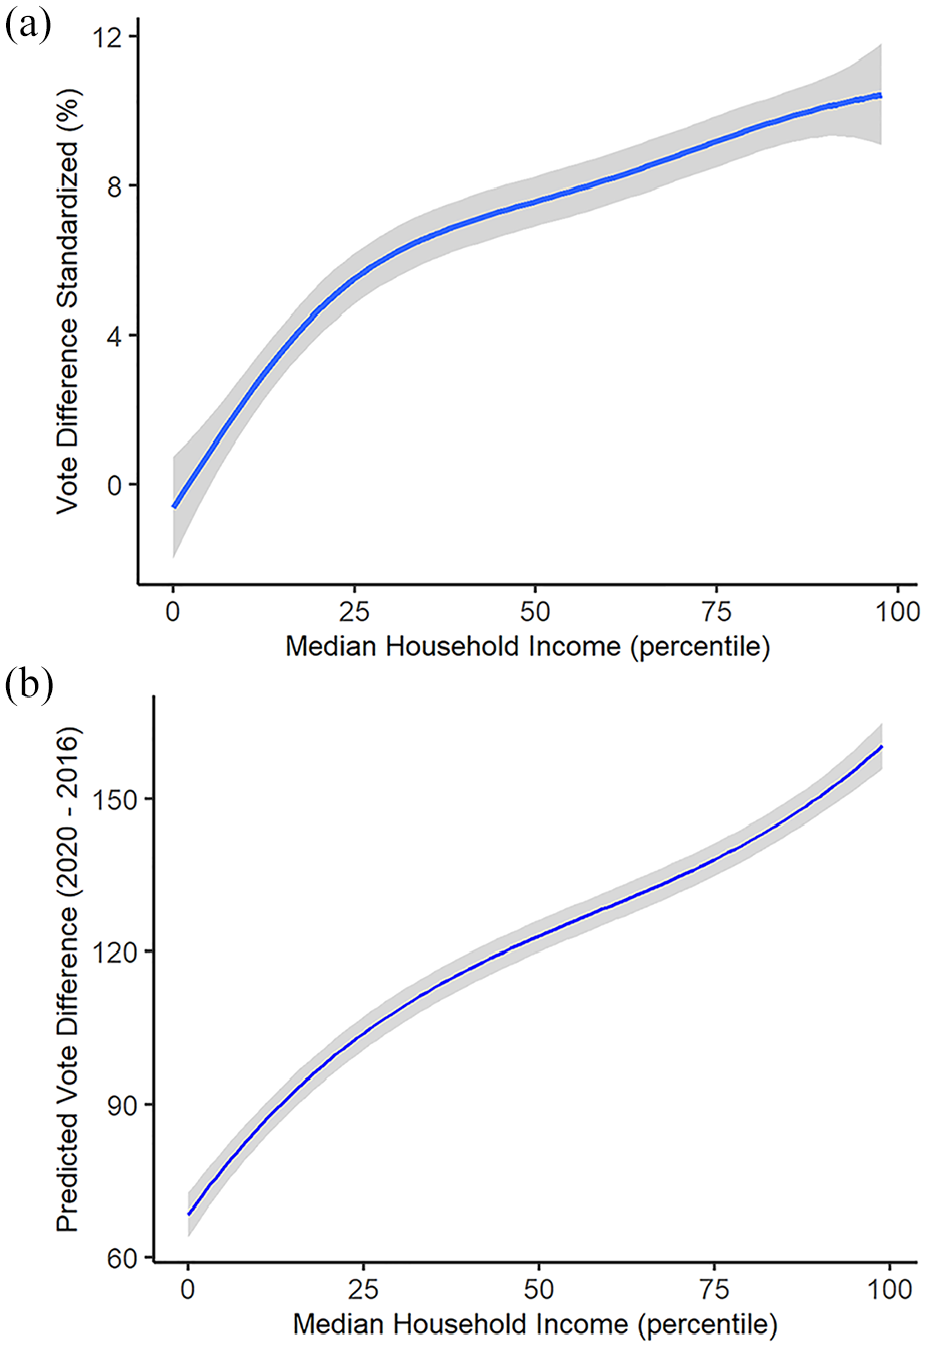
(a) Descriptive smoothed mean graph of standardized difference in voter turnout (2020 votes − 2016 votes) by percentile-ranked median household income and (b) regression results of predicted absolute difference in voter turnout.
Figure 2b shows that this trend persists in regression analysis controlling for critical characteristics such as state fixed effects and spatial dependence. We conducted ordinary least squares regression predicting the absolute difference in voter turnout (see Appendix A for the regression table). We detail this modeling strategy in the materials and methods section. The curve represents the predicted difference in voter turnout between 2020 and 2016 (subtracting 2016 turnout from 2020 turnout) when continuous variables are mean centered and the state fixed effect is set to the reference group. As a reminder, we examine this outcome because we only include precincts whose boundaries remained constant between the two elections. This analysis further confirms hypothesis 2: richer precincts showed greater increases in voter turnout compared with poorer precincts.
Discussion and Conclusion
Voter turnout in the 2020 presidential election broke records—the highest share of the electorate (66 percent) went to the polls in more than 100 years; the last time turnout was higher was in 1900. Turnout in 2020 was almost 6 percentage points higher than in 2016 (60.1 percent), which was similar to the preceding three presidential elections, when turnout was between 58.6 percent and 61.6 percent (McDonald 2020). In theory, the increase in turnout in 2020 could translate to greater representation across the entire electorate. But our evidence indicates the contrary: the increase was concentrated in moderate and higher income precincts and was smaller or nonexistent in precincts with lower median incomes. When comparing the poorest precincts with the richest precincts in 2016, we estimated a turnout gap of roughly 17 percentage points (bottom decile of income, 50 percent; top decile, 67 percent), but this gap increased to 27 percentage points in 2020 (bottom decile, 50 percent; top decile, 77 percent). Moreover, this trend persists in regression analysis after controlling for state fixed effects and spatial dependence. We found this trend in the first ever analysis of turnout inequalities by income using official election results using precinct-level voter turnout for all 50 states and Washington, D.C., including more than 125,000 precincts representing 102 million voters in 2016 and 117 million in 2020.
Prior research on income inequalities in voter turnout relies on survey data that provide wide variation in estimates of income inequality and voting. This wide variation is in part because of response bias and social desirability bias in voter survey research (Selb and Munzert 2013). These biases are particularly problematic because they are correlated with both our dependent and independent variables (voting and income, respectively): better-off people are more likely to participate in surveys, more likely to overreport (lie about) voting, and are generally more politically engaged. Our study moves beyond the problems of survey research by using official election results that cover the full economic spectrum across the entire country. We cannot directly compare our precinct-level analysis to previous individual-level survey analyses, but we can conclude that (1) there is steep inequality in turnout across the distribution of precinct median income, and (2) this inequality got dramatically bigger with increased turnout in 2020. This is important because we cannot know with any precision from survey data how big the gap in voting is between the richest and poorest individuals; however, we now know how big the gap is between the richest and poorest precincts.
It is worth noting that our results cover only a short time span; we can say with confidence that there was more economic inequality in precinct-level voting in 2020 than 2016, but we cannot determine whether this is because 2016 had unusually income-equal turnout, because 2020 had unusually unequal turnout, or whether both are within the range of usual historical variation. Many observers consider both elections to be highly unusual, so neither year may be representative of broader trends. Several aspects of 2020 may have increased turnout among people in higher income areas. People in better-off precincts may have been especially mobilized by the heightened attention to politics in Trump’s first term (Fisher, Dow, and Ray 2017). The accessibility of mail-in ballots, along with the increase in free time for many people working remotely, may have facilitated voting for people in higher income places in 2020 compared with 2016. Conversely, we know that many of the worst effects of the pandemic, from job loss to excess mortality, were concentrated in lower income areas; this may have offset efforts to increase turnout in these areas (Frey, Osterloh, and Rost 2023; Jay et al. 2020).
Our data do not allow us to assess the relative impacts of these or other mechanisms on income inequality in precinct-level turnout. Future research may explore these issues as researchers continue to make precinct-level turnout data available for additional election years. Nevertheless, our analysis shows that for our time period the income gradient in voting was steeper in 2020 than 2016.
Most prior research examines individual-level income and voter turnout. Here, we examine precincts, the smallest geographic units analyzable for voting, with a median voting-age population of roughly 1,000 people. We cannot directly make inferences to individual attributes on the basis of group-level data, but this study’s results are consistent with previous research (Laurison and Rastogi 2023) showing an increase in income inequality in turnout in 2020.
Explanations for economic inequality in voting vary (Brady et al. 1995; Laurison 2016; Rolfe 2012; Tenn 2005), but whatever the cause it has important implications for the health of American democracy: a well-functioning democracy ought to include the voices of people across the economic spectrum. The disproportionate political voice of those with higher incomes is part of why the views and preferences of the well-off are more likely to be reflected in laws and policies (Avery 2015; Bartels 2008; Franko, Kelly, and Witko 2016; Gilens 2012) and people with fewer resources are more likely to report feeling disengaged from politics (Galston 2001). If inequalities in participation grow, there is potential for a vicious cycle: the less people from poor and working-class communities participate in politics, the less their views will be represented; the more political outcomes reflect the preferences of the better-off, the less reason for low-income people to believe that electoral politics can reflect their interests.
Supplemental Material
sj-docx-1-srd-10.1177_23780231251338441 – Supplemental material for Higher Turnout, Greater Inequality? A Precinct-Level Analysis of Income Inequality in U.S. Presidential Voting, 2016 to 2020
Supplemental material, sj-docx-1-srd-10.1177_23780231251338441 for Higher Turnout, Greater Inequality? A Precinct-Level Analysis of Income Inequality in U.S. Presidential Voting, 2016 to 2020 by Ankit Rastogi and Daniel Laurison in Socius
Footnotes
Acknowledgements
We would like to thank Kelly Diaz, Lydia Orr, Elizabeth Zack, and Jennifer Dudley for providing feedback on earlier versions of this article.
Supplemental Material
Supplemental material for this article is available online.
Notes
Author Biographies
References
Supplementary Material
Please find the following supplemental material available below.
For Open Access articles published under a Creative Commons License, all supplemental material carries the same license as the article it is associated with.
For non-Open Access articles published, all supplemental material carries a non-exclusive license, and permission requests for re-use of supplemental material or any part of supplemental material shall be sent directly to the copyright owner as specified in the copyright notice associated with the article.