
Abstract
Geographic disparities in Alzheimer’s disease are often attributed to sociodemographic differences across communities or unequal access to opportunity structures whose use serves as protective mechanisms. Yet limited research considers the social dynamics between residents that are enabled by these opportunity structures. The authors adopt a population-level approach to evaluate how ethnoracial diversity and opportunity structures function jointly to facilitate the development of bridging social capital (i.e., mixing of dissimilar people) which is hypothesized to predict Alzhiemer’s disease mortality rates. Upon analyzing Alzheimer’s disease mortality records from 2,469 U.S. counties, the authors find that counties whose sociodemographic composition and opportunity structures combine to encourage bridging capital potential exhibit lower mortality rates than counties with fewer such opportunities. These findings consistently appear in environments whose composition and structure are conducive to social mixing (i.e., workhoods and civic organizations) but inconsistently in environments that are less conducive to social mixing (i.e., residential neighborhoods). The findings highlight the importance of structural factors that create opportunities for social capital.
Alzheimer’s disease (AD) is the seventh leading cause of mortality in the United States. Approximately 120,000 Americans die of AD every year, placing major physical, emotional, and economic burdens on families, caregivers, and the health care system (Alzheimer’s Association 2023). Yet these burdens are not uniformly experienced throughout the population, as there are well-documented geographic disparities in AD (Ailshire, Walsemann, and Fisk 2022). These disparities are often attributed to either sociodemographic differences across communities or unequal access to opportunity structures whose use serves as protective mechanisms. Limited research, however, considers how the social dynamics between residents from diverse backgrounds, which are enabled by these opportunity structures, may explain geographic disparities in AD.
Considerable progress has been made in recent years toward establishing a theoretical framework that explains how social factors influence AD (Sachdev 2022). A predominant finding to emerge from this body of research suggests that exposure to novel social settings protects against AD (Bianchi et al. 2023; Ellwardt, Van Tilburg, and Aartsen 2015; Kim et al. 2019). These findings closely align with the sociological concept of bridging social capital (i.e., mixing of dissimilar people). Bridging social capital, which highlights the advantages of people overcoming their differences to achieve a desirable outcome (Putnam 2000), has been presented as a protective factor against AD because it builds cognitive resilience against the deteriorating effects of the disease (Perry, McConnell, et al. 2022). This theoretical framework states that exposure to people from diverse backgrounds cognitively stimulates the brain by routinely toggling between different social contexts (Ashida and Schafer 2018; Peng et al. 2022; Perry, McConnell, et al. 2022). We extend this framework to consider a previously underexplored source of bridging capital: the mixing of people from different ethnoracial identities.
Numerous studies show that contact between ethnoracial groups promotes cognitive skills such as empathy (Boisjoly et al. 2006), information processing (Sommers, Warp, and Mahoney 2008), and creativity (McLeod, Lobel, and Cox 1996), all of which are known to protect against AD. Population-level research, meanwhile, suggests that ethnoracial diversity can serve as a source for cognitively beneficial social exposure by pointing to the fact that communities with many ethnoracial groups exhibit higher levels of social cohesion than communities with fewer ethnoracial groups (Bazzi et al. 2019). Collectively, research across multiple disciplines and substantive areas lends indirect support to emerging views that contact between people of different ethnoracial backgrounds (i.e., bridging social capital) is cognitively beneficial.
It is important to note, however, that the ability to socialize with others depends on the social environment in which people reside (Blau 1977). At the most basic level, people cannot bridge connections across social groups if they reside in completely homogenous communities. Although diverse communities have greater bridging capital potential by virtue of their sociodemographic composition, their potential also depends on opportunities for social contact. Sociologists have long noted that the opportunity structures of a community (e.g., residential neighborhoods, workplaces, civic organizations) serve as upstream factors that influence people’s ability to maintain diverse social lives (Blau 1994; Feld 1981; Klinenberg 2018). An opportunity structure in this context refers to an organized social setting that is structured in a way that brings people into close proximity for a shared purpose (e.g., domestic tasks, work, recreational activities). We argue that analyzing variation in sociodemographic composition (i.e., ethnoracial diversity) across communities, in conjunction with structural opportunities for social contact, allows us to infer the degree of bridging capital potential within these communities. These conditions, in turn, should theoretically explain geographic disparities in AD.
The present study adopts a population-level approach to study AD. We analyze compressed mortality records from 2,469 U.S. counties to estimate the association between ethnoracial diversity and AD mortality rates among the older population and how opportunity structures facilitate this association. By leveraging data on ethnoracial composition, our study draws attention to the structural conditions of the social environment that are theoretically linked to different opportunities for bridging social capital. We also explore linguistic diversity as an alternative measure of bridging capital. Our results advance the understanding of how the social environment shapes population health disparities.
AD and Bridging Social Capital
AD is a common neurodegenerative disease among the older population. It is characterized by the accumulation of toxic amyloid plaques and neurofibrillary tangles in the brain. Although these plaques and tangles often result in cognitive decline, there is long-standing evidence that people can live with neurodegeneration despite ever exhibiting any symptoms (Riley, Snowdon, and Markesbery 2002). These findings have led neuroscientists to coin the term cognitive reserve, a concept that refers to the “adaptability of cognitive processes that helps to explain differential susceptibility of cognitive abilities or day-to-day function to brain aging, pathology, or insult” (Stern et al. 2020:1306). The cognitive reserve hypothesis, in turn, states that long-term exposure to stimulating environments and activities explains how some people experience severe effects of AD while others remain unaffected (Chapko et al. 2018). Recent research shows that people with higher levels of cognitive reserve have longer life expectancy than people with lower levels of cognitive reserve (Zijlmans et al. 2021).
There is long-standing evidence that social engagement builds cognitive reserve (Sachdev 2022). Whereas pioneering neuroscience studies documented a negative association between various measures of social engagement (e.g., frequency of social contact, number of friends and family) and cognitive impairment (Barnes et al. 2004; Zunzunegui et al. 2003), recent developments highlight the importance of social diversity (Ellwardt et al. 2015; Kim et al. 2019; Perry, Roth, et al. 2022). Exposure to people from diverse backgrounds and mindsets (i.e., bridging social capital) is theorized to provide novel social stimuli in the form of new ideas and perspectives, verbal and nonverbal social cues, and facial and speech recognition, among other things (Peng et al. 2022).
Bridging social capital takes multiple forms. Network theorists traditionally defined a social bridge as a connection between otherwise unconnected members within a social network (Burt 1992). An alternative definition extends to consider all social contact, from everyday exposure to intimate relationships, between dissimilar individuals (Putnam 2000). Applying this latter definition has illuminated the population-level existence of social capital that stems beyond the network view (Kyne and Aldrich 2020; Monnat 2018; Yang, Jensen, and Haran 2011; Yang, Kim, and Matthews 2023). This population-level approach does not explicitly capture social connections between people but rather assumes that brief and indirect social exposures have nontrivial health and well-being consequences in their own right, a claim that is supported by research that leverages experience sampling methods (Collins et al. 2022; Goldman and York Cornwell 2023; Sandstrom and Dunn 2014; Zhaoyang et al. 2021).
In the present study, we follow prior arguments that social engagement occurring across ethnoracial groups serves as a form of bridging capital that exposes people to new ways of thinking (Park and Bowman 2015). Similar arguments have been made for linguistic diversity (i.e., mixing of people who speak different languages) (Tegegne 2018). Although these forms of bridging capital are infrequently studied within the AD literature, there are multiple reasons to believe that they provide the exact type of novel stimuli that is hypothesized to build cognitive reserve and consequently reduce AD risk (Perry, McConnell, et al. 2022). First, exposure to heterogenous cultures and languages improves brain structure and function (Mendez 2019; Wagner, Bekas, and Bialystok 2023). This is unlikely to occur within homogenous groups. Second, although ethnoracial mixing may be emotionally challenging and serve as a potential source of conflict (Putnam 2007), it can promote cognitive flexibility, creativity, and problem solving under the correct conditions (Hodson et al. 2018). Studies in psychology show that racially heterogenous workgroups tend to produce unique resolutions that incorporate multiple perspectives and result in higher quality decisions compared with racially homogenous groups (Phillips et al. 2004; Sommers et al. 2008). These findings highlight the collective benefits of diversity that extend beyond any given individual. A study that analyzed the impact of randomly assigned roommates in college dorms, meanwhile, revealed that students who were assigned a roommate of a different race presented more empathetic views compared with students who were assigned a roommate of their same race (Boisjoly et al. 2006). These studies jointly point toward social mixing between dissimilar people (i.e., bridging capital) as cognitively challenging yet collectively beneficial.
Whereas the aforementioned studies take ethnoracial mixing as a starting point, it is important to acknowledge the importance of the sociodemographic composition of a population (Blau 1977). Consider the hypothetical populations presented in Figure 1. If two residents in population A were paired at random, there would be a 67 percent likelihood of this resulting in bridging capital (i.e., a diverse pairing). Conversely, it is impossible for the residents of population B to develop bridging capital because there is no variation within their population. The increasing variation of ethnoracial (or linguistic) composition within a population not only raises the potential of bridging capital but may also serve as community motivation for social integration. For instance, a study on population resettlement in Indonesia showed that communities with many different ethnic groups exhibited greater efforts toward a united identity compared with communities composed of one or two large ethnic groups (Bazzi et al. 2019). In other words, the widespread presence of diversity may induce some level of bridging capital within a community by chance alone. Following the cognitive reserve hypothesis, which would argue that diverse social environments lower AD risk, we formulate our first hypothesis:
Hypothesis 1: Counties with high levels of ethnoracial diversity will have lower AD mortality rates compared with counties with low levels of ethnoracial diversity.

Hypothetical populations with different sociodemographic compositions.
Structural Opportunities for Bridging Capital
The preceding hypothesis assumes that the sociodemographic composition of a community dictates the probability of bridging capital potential. Although true from a statistical standpoint, a long line of sociological research further recognizes that mixing between local residents is fostered by structural opportunities (Blau 1994; Klinenberg 2018). According to focus theory, social contact tends to occur in environments “around which joint activities are organized” (Feld 1981:1016). This theory states that these environments (i.e., opportunity structures) may be either formal or informal in their structure and membership so long as they foster an atmosphere that is conducive to social contact between participating individuals.
We argue that opportunity structures should be theoretically conceived as the pipes through which social capital flows rather than a marker of social capital themselves (Podolny 2001). For example, residential neighborhoods are opportunity structures because they situate residents in close proximity with one another. In other words, residential neighborhoods serve as pipes that enable mixing between dissimilar residents (i.e., bridging capital). Yet a neighborhood that is composed solely of residents from the same ethnoracial background cannot create bridging capital. In this example, the opportunity structure (i.e., residential neighborhood) still exists but the source of the capital (i.e., diverse population) does not. Indeed, opportunity structures are necessary but not sufficient for the development of social capital.
Adopting this perspective, we extend our first hypothesis to consider three types of opportunity structures that facilitate bridging capital: (1) residential neighborhoods, (2) workplace neighborhoods, and (3) civic organizations. These opportunity structures—which share theoretical parallels with the sociological concepts of the “first place,” “second place,” and “third place” (Oldenburg 1999)—represent different opportunities for social contact.
Residential Neighborhoods
Residential neighborhoods have a profound impact on social life. One obvious reason is that people spend large amounts of time at home in close proximity to their neighbors. Although not all neighborhood residents know each another, the probability of social contact occurring (even if it is surface-level contact) is greater among people who live near each other compared with those who live further apart (Onnela et al. 2011). As suggested by Figure 1, the sociodemographic composition of a neighborhood facilitates the types of contact that can occur. For example, integrated neighborhoods will have a higher probability of ethnoracial (or linguistic) bridging capital occurring compared with segregated neighborhoods by virtue of the composition of people living there. On the basis of these insights, we formulate our second hypothesis:
Hypothesis 2: Counties that are characterized by residential ethnoracial integration will exhibit lower AD mortality rates than counties that are characterized by residential ethnoracial segregation.
Workplace Neighborhoods (“Workhoods”)
Numerous studies demonstrate that people routinely engage in social contact outside of their residential neighborhoods (Browning and Soller 2014; Roth and Peng 2024) and that these nonresidential environments have health consequences (Kimbro, Sharp, and Denney 2017; York Cornwell and Goldman 2020). The workplace is a common nonresidential environment as it constitutes a place where many Americans spend most of their waking hours for much of their adult lives. Social contact at the workplace, when aggregated across the life course, is particularly important for AD as it has been documented that people who previously worked socially complex jobs have a lower probability of developing AD in later life compared with people who worked primarily with things or data (Coleman et al. 2023).
Hall, Iceland, and Yi (2019) used the term workhood to refer to a social environment that extends beyond one’s worksite or office building to include nearby neutral locations (e.g., coffee shops, restaurants, plazas) that serve as potential sites for social contact. We leverage this idea of a workhood, which finds precedence in studies that focus on social integration in public spheres (Anderson 2011; Klinenberg 2018), to infer bridging capital potential from ethnoracial (and linguistic) mixing. Given that integrated environments are more likely to induce diverse social contact compared with predominantly segregated environments, we formulate our third hypothesis that focuses on workhoods:
Hypothesis 3: Counties that are characterized by workhood ethnoracial integration will exhibit lower AD mortality rates than counties that are characterized by workhood ethnoracial segregation.
Civic Organizations
Finally, we direct attention to organizations that actively encourage civic engagement among the local public. Civic organizations differ from residential neighborhoods and workhoods in that they are geared specifically toward social inclusivity. By virtue of their intended mission, these organizations represent a key ingredient in building a civic society as they foster a sense of community, create cognitive empathy, and provide a space for meaningful social contact (Colistra, Bixler, and Schmalz 2019; Small and Gose 2020; Whitham 2012). This has direct implications for the health and well-being of local residents. Prior research has shown that counties with high rates of civic organizations (and similar social infrastructures) tend to exhibit lower mortality rates compared with counties with lower organization rates (Kawachi et al. 1997; Yang et al. 2011, 2023; Zhang, Rhubart, and Monnat 2024). Moreover, the presence of civic organizations within a community has been empirically linked with cognitive impairment among local residents (Clarke et al. 2015; Finlay et al. 2022).
An ideal way to assess the role of ethnoracial (or linguistic) bridging capital at the organizational level would be to observe the sociodemographic composition of such organizations. Our theoretical framework would suggest that counties with organizational integration (i.e., ethnoracial diversity among civic organization members) would fare better than counties with organizational segregation because of the mixing of diverse people that is likely to occur in the organizational context. Unfortunately, there are no comprehensive data on organizational membership in the United States. This is partially because most civic organizations are open to the public and therefore fluid in their membership. We argue, however, that organizational opportunities for civic engagement increase the likelihood of ethnoracial mixing if there is sufficient sociodemographic diversity within the communities that house such organizations. In other words, we infer the potential for ethnoracial bridging capital by combining the presence of civic organizations and ethnoracial diversity at the county level (i.e., statistical interaction). This leads to our final hypothesis:
Hypothesis 4: The association between ethnoracial diversity and AD mortality rates will be stronger for counties with a high civic organization rate compared with counties with a low civic organization rate.
Methods
The present study harmonizes data from multiple sources to study the associations between ethnoracial (and linguistic) diversity, structural opportunities for social contact, and AD mortality. First, we collected compressed mortality files from the Centers for Disease Control and Prevention (CDC) to calculate the AD mortality rates by county. Second, we collected data from the U.S. Census Bureau, the U.S. Department of Transportation, and the U.S. Department of Agriculture to create sociodemographic, geographic, residential, and workhood variables for each county. Third, we downloaded data from the National Neighborhood Data Archive (NaNDA) to assess the presence of civic organizations across counties. These data were merged using five-digit Federal Information Processing Standards county codes. Table 1 provides a summary of the data sources.
Data Sources.
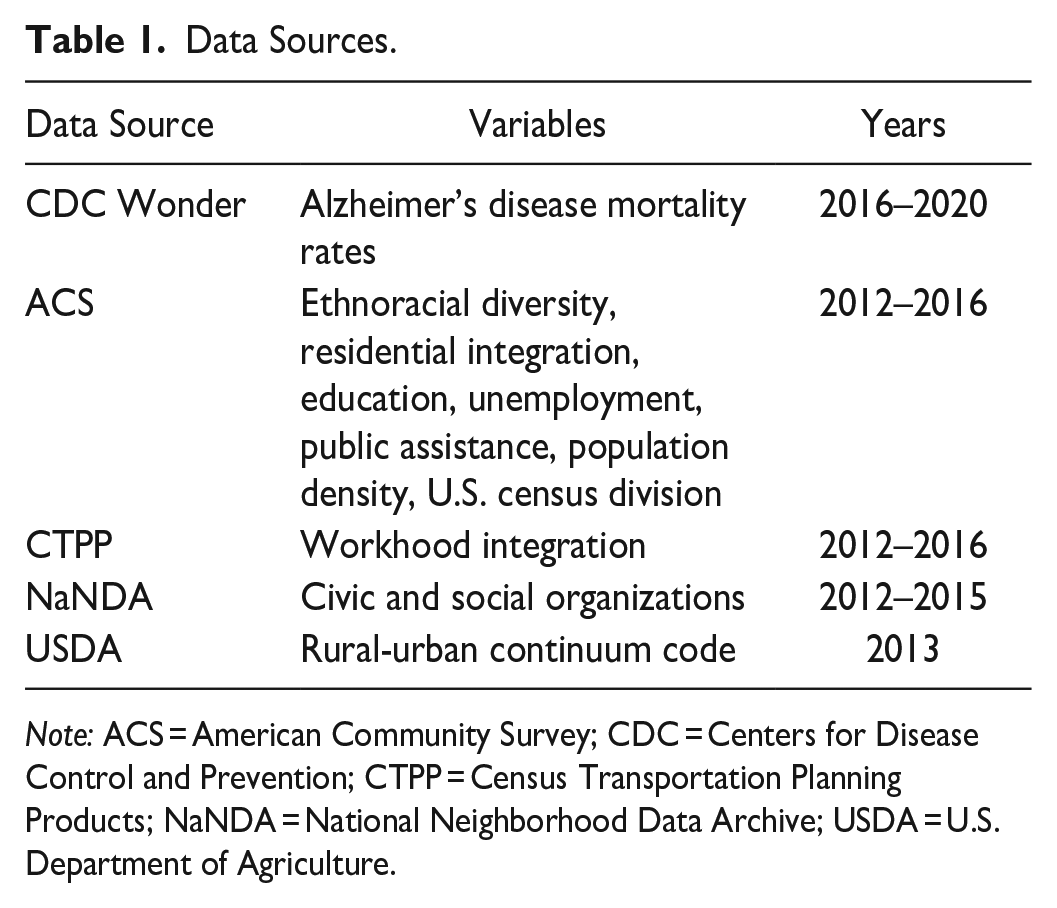
Note: ACS = American Community Survey; CDC = Centers for Disease Control and Prevention; CTPP = Census Transportation Planning Products; NaNDA = National Neighborhood Data Archive; USDA = U.S. Department of Agriculture.
AD Mortality Rates
Our dependent variable is the AD mortality rate for each county. These rates were calculated using the CDC Wonder online database. We included mortality records whose underlying cause of death was classified as AD per International Classification of Diseases, Tenth Revision, code G30. Because AD is most common among the older population, we used age-adjusted mortality rates for the subpopulation ≥65 years of age at the time of death. Our final variable is interpreted as the number of AD-specific deaths for older adults per 100,000.
It is worth noting that some counties have a relatively small population of older adults and consequently a small number of AD deaths. The CDC flags mortality rates as unreliable if there were fewer than 20 deaths reported within a county. We therefore pooled the AD mortality rates from 2016 to 2020 to minimize the number of counties with unreliable mortality rates. 1 This produced an analytic sample of 2,469 counties that account for more than 99 percent of the U.S. population. We did not adjust for missingness (e.g., multiple imputation, full information maximum likelihood) because the counties with the missing data were intentionally excluded from the CDC database because of unreliable estimates. Attempting to recover these cases via statistical techniques would unnecessarily introduce noise.
Ethnoracial Diversity
County-level data on race and ethnicity were drawn from the 2012–2016 American Community Survey (ACS). These years were chosen to allow a lag between exposure to social environment and AD mortality rates. We took five categories (Asian, Hispanic, non-Hispanic Black, non-Hispanic White, and other) to calculate the ethnoracial diversity for each county using the entropy score as defined by Massey and Denton (1988) This score is derived using the following equation:

where Ei represents the entropy score for county i, and Π ri equals the proportion of ethnoracial group r within the county i. This equation produces an ethnoracial diversity score for each county with higher scores representing greater diversity. Our five-category classification produces a diversity score that mathematically ranges from 0.00 to 1.61. As instructed by Iceland (2004), the natural logarithm is set to 0.0 when the proportion of an ethnoracial group is zero.
Residential Neighborhood Integration
The preceding variable assesses ethnoracial diversity at the county level (hypothesis 1). Yet it unrealistic to assume that all residents with a county have equal chance of coming into contact with one another, especially as counties can be relatively large geographic areas. We therefore used the multigroup entropy (ME) index to assess the residential distribution of ethnoracial groups residing within each county (Iceland 2004). This index, also known as Theil’s H, aggregates data on the sociodemographic composition of all census tracts within a county to provide a single value of residential integration (i.e., ME) for each county. It is a measure of “evenness” that shows the extent that groups are equally distributed among organizational units (e.g., census tracts) within a larger area (e.g., county) (Iceland 2004). This allows us to infer the likely presence of bridging capital (i.e., mixing of people from different backgrounds) because it simultaneously accounts for the county’s supply of diverse residents and their distribution across opportunity structures (e.g., residential neighborhoods, workhoods).
The ME index is derived using a two-step equation. The first equation is a repeat of the previous entropy equation (shown above) but this time at the census tract level, where Ei represents the entropy score for census tract i, and Π ri equals the proportion of ethnoracial group r within the census tract i. We stayed consistent with our previous operationalization of ethnoracial diversity and used the five-category classification. The values from the above equation, which now provide the entropy scores for each census tract in a county, are subsequently plugged into the following equation:

where ti equals census tract i population, T equals the county population, n equals the number of census tracts in the county, and Ei and E equal the diversity (entropy) of tract i and the county, respectively. We rescaled the resulting ME score by multiplying it by 100 such that it mathematically ranges from 0 (complete ethnoracial segregation within a county) to 100 (complete ethnoracial integration within a county). This variable is used to test hypothesis 2.
Workhood Integration
We used data from the Department of Transportation’s Census Transportation Planning Products (CTPP) to assess the ethnoracial integration of workhoods (Seo et al. 2017). The CTPP drew on the 2012–2016 ACS which documents the commuting flow of working Americans. This allowed us to calculate the ethnoracial diversity of each census tract in which people work. As noted by Hall et al. (2019), these data “extend beyond the firms or establishments where individuals work to encompass the broader spatial contexts that people navigate throughout the workday” (pp. 673–74). Again, we used the two-step procedure as laid out in the previous subsection to calculate first the entropy score (Ei) for each census tract followed by the ME index at the county level. This provided us with a value of ethnoracial workhood integration across ranging from 0 (complete ethnoracial segregation within a county) to 100 (complete ethnoracial integration within a county). This variable is used to test hypothesis 3.
Civic Organizations
We used data from NaNDA, which drew on the North American Industry Classification System, to calculate the number of civic and social organizations (subsector 8134) located in each U.S. census tract (Finlay et al. 2020). This classification captures organizations that are “primarily engaged in promoting the civic and social interests of their members” (Executive Office of the President 2017:587). We aggregated the number of organizations to the county level (to match our unit of analysis) and converted it to a rate of organizations per 100,000 residents. NaNDA provides data from 2003 to 2017, with the exception of 2016. To best match the 2012–2016 years used for our other variables, we calculated an average civic organization rate (per 100,000) across 2012, 2013, 2014, and 2015 for each county.
There are unfortunately no available data on the ethnoracial composition of the civic organizations. We circumvent this issue by multiplying the civic organization rate variable by the county-level measure of ethnoracial diversity. Although imperfect, this approach allows us to infer the probability of intergroup mixing occurring within civic organizations (as opposed to residential neighborhoods or workhoods) and to test hypothesis 4.
Covariates
We adjusted for the following covariates in our final models: educational attainment (percentage with college degree), unemployment (percentage of unemployed residents ≥16 years of age), economic disadvantage (percentage of residents receiving public assistance income), median household income (divided by $10,000), population density (residents per square mile), U.S. census division (New England, Mid-Atlantic, East North Central, West North Central, South Atlantic, East South Atlantic, West South Central, Mountain, or Pacific), and a dichotomized metropolitan status (metropolitan vs. nonmetropolitan) that was derived using the Department of Agriculture’s 2013 rural-urban continuum codes (U.S. Department of Agriculture 2013). Data on all covariates (except metropolitan status) were drawn from the 2012–2016 ACS.
Sensitivity Analysis: Linguistic Diversity
We used linguistic diversity as an alternative measure of bridging capital to check the sensitivity of our ethnoracial diversity measures. Linguistic diversity has previously been conceptualized as a form of bridging capital that is empirically linked to health outcomes (Tegegne 2018). We created three variables for linguistic diversity that mirrored the ethnoracial variables. First, county-level data on primary language spoken in the home were drawn from the 2012–2016 ACS using the following categories: English, Spanish, other European language, Asian language, and other languages. These five categories were used to calculate a county-level linguistic diversity score using the same entropy equation that we previously used for ethnoracial diversity. We next used these same data to create a residential linguistic diversity variable using the ME index. Finally, we drew data from the CTPP to measure linguistic workhood diversity. This variable was also created using the ME index.
Analytic Strategy
We first provide summary statistics to illustrate the range and distributions of the key variables. Next, we estimate a series of ordinary least squares (OLS) regression models with robust standard errors that predict the age-adjusted mortality rates for the older population of each county using ethnoracial diversity, opportunity structures (i.e., residential integration, workhood integration, civic organizations), and covariates as predictors. OLS regression is appropriate given that mortality rates are continuous and the OLS assumptions are not violated to the extent that it biases the estimates (see Appendix for model diagnostics).
Our analytic process follows our hypotheses such that model 1 provides the main association between ethnoracial diversity and AD mortality rates that is used to test hypothesis 1. Models 2 and 3 introduce the residential and workhood integration variables to test hypotheses 2 and 3. Models 4 and 5 turn attention to hypothesis 4. Model 4 introduces the civic organization variable to assess whether there is an independent association between organization rates and AD mortality. Model 5 then introduces an interaction term (ethnoracial diversity × civic organization) to assess hypothesis 4. We plot the predicted values from selected models to substantiate the findings. Finally, we conduct a series of sensitivity analyses that use linguistic diversity as an alternative measure of bridging capital.
Results
Table 2 presents the summary statistics for the 2,469 counties in the analytic sample. The mean AD mortality rate was 284.32 deaths per 100,000 older adults (SD = 115.08). There was, however, considerable variation, as the county with the lowest rate recorded 46.50 deaths per 100,000 and the county with the highest rate recorded 1,226 deaths per 100,000. Most counties (83.5 percent) recorded between 100 and 400 deaths per 100,000 older adults. The mean ethnoracial diversity was 0.62 (SD = 0.30) and ranged from 0.07 to 1.49. The mean residential integration was 10.44 (SD = 6.48), and the mean workhood integration was 8.94 (SD = 5.52). The mean civic organization rate was 65.37 per 100,000 residents (SD = 33.17). See the Appendix for visual distributions of these variables.
Summary Statistics (n = 2,469).

Table 3 presents the results from the linear regression models. As seen in model 1, ethnoracial diversity was not independently associated with AD mortality rates (β = 15.86, SE = 9.44, p = .09), a null finding that fails to lend support to hypothesis 1. Models 2 to 5 introduce the opportunity structures that test hypotheses 2 to 4. Model 2, which adjusts for the geographic and sociodemographic variables, shows a significant negative association between residential integration and AD mortality rates (β = −1.19, SE = 0.39, p < .01), thus providing preliminary support for hypothesis 2. Yet this association between residential integration and AD mortality loses significance upon adjusting for the workhood variable in model 3 (β = −0.50, SE = 0.39, p = .21). There is, however, a negative association between workhood integration and AD mortality rates (model 3, β = −2.58, SE = 0.44, p < .001). This latter finding indicates that counties whose workhoods are more ethnoracially integrated see fewer of their older residents die of AD compared with counties with more segregated workhoods, a finding that supports hypothesis 3.
Linear Regression Predicting Alzheimer’s Disease Mortality Rates (n = 2,469).

Median household income is divided by 10,000.
p < .05. **p < .01. ***p < .001
The next models introduce the civic organization variable, first independently (model 4) and next interacted with the ethnoracial diversity variable (model 5). Model 4 shows a negative association between the civic organization rate and AD mortality rate (β = −0.31, SE = 0.12, p < .01). Model 5 extends this finding by showing a significant interaction between ethnoracial diversity and civic organization rates (β = −1.46, SE = 0.33, p < .001). The interaction term, when interpreted jointly with the ethnoracial and civic organizations coefficients, indicates that there is a sharp negative association between ethnoracial diversity and AD mortality rates among counties with high civic organization rates. This association weakens as civic organization rates decrease. These findings support hypothesis 4.
Figures 2 and 3 plot selected predicted values from model 5 to further elucidate the findings. As shown in Figure 2, the predicted AD mortality rate was 308.10 (95 percent confidence interval [CI] = 299.15–317.04) for counties with a workhood integration score of 0.0 (i.e., completely segregated counties). The predicted rates were significantly lower in more integrated counties. For example, counties with a workhood integration score of 20 had a predicted mortality rate of 254.91 (95 percent CI = 245.43–264.39). Figure 3, meanwhile, plots the predicted values from the interaction between ethnoracial diversity and civic organization rates. There is a clear negative association between ethnoracial diversity and AD mortality for counties with an above average civic organization rate (shown via the orange dotted line). These counties were predicted to have an AD mortality rate of 305.20 (95 percent CI = 284.11–326.28) if the diversity was 0.0 (i.e., all residents were in the same ethnoracial group) and mortality rate of 212.99 (95 percent CI = 181.68–244.32) if the diversity was 1.49 (i.e., empirical maximum). In other words, counties with the highest levels of ethnoracial diversity are predicted to have 92.21 fewer deaths per 100,000 (95 percent CI = 42.29–1,42.11) than counties with the lowest levels of ethnoracial diversity, assuming they have an above average civic organization rate (i.e., 1 standard deviation above the mean). By contrast, there was a slight positive association between ethnoracial diversity and AD mortality among counties with a below average civic organization rate (i.e., 1 standard deviation below the mean). Specifically, these counties were predicted to have an AD mortality rate of 277.31 (95 percent CI = 258.66–295.96) if their diversity score was 0.0 and an AD mortality rate of 322.93 (95 percent CI = 300.42–345.43) if their diversity score was 1.49. Although these latter values significantly differed from each other, neither value differed from the mean AD mortality rate (284.32 deaths per 100,000).

Alzheimer’s disease (AD) mortality rate by workhood integration.

Alzheimer’s disease (AD) mortality rate by ethnoracial diversity and civic organization rates.
Sensitivity Analysis
We ran additional analyses by substituting the ethnoracial diversity variable with a linguistic diversity variable to ensure that our previous findings were not sensitive to our operationalization of bridging capital (see Table A3 in the Appendix). The results from the linguistic diversity models were largely consistent with the results from the ethnoracial diversity models. For example, there was mixed support for hypothesis 2 (residential hypothesis) across the models, but a consistent negative association between workhood linguistic integration AD mortality rates across models (hypothesis 3). Model A5, meanwhile, showed a significant interaction term between linguistic diversity and civic organizations that lends support to hypothesis 4. Figure A16 visualizes this relationship.
Discussion
The present study was motivated by theoretical insights on social capital to explore geographic disparities in AD. We extended previous studies that used a population-level approach to explore associations between community social capital and mortality rates (e.g., Monnat 2018; Yang et al. 2011, 2023) by focusing specifically on the mixing of dissimilar people as it relates to AD mortality rates. Although existing sociological research suggests that bridging capital is protective against AD (Perry, McConnell, et al. 2022) and psychological research empirically demonstrates that social contact between people of different races and ethnicities increase information sharing, creativity, and shared empathy (Bazzi et al. 2019; Boisjoly et al. 2006; McLeod et al. 1996; Phillips et al. 2004; Sommers et al. 2008), we are unaware of any study that merged these insights to assesses the role of ethnoracial diversity in AD disparities.
Our first hypothesis stated that counties with higher levels of diversity would have lower AD mortality rates than counties with lower levels of diversity (hypothesis 1). We found no support for this hypothesis when using ethnoracial diversity (or linguistic diversity) as the sole marker of bridging capital. These initial null findings, when contrasted with the significant findings from subsequent models, suggest the presence of a contextual mechanism (i.e., a combination of environmental factors operating in unison) rather than compositional mechanisms (i.e., aggregated sum of personal-level characteristics). The contextual explanation would state that a diverse population cannot provide cognitive benefits to its residents if they remain in complete isolation from one another. There must instead be at least some degree of population mixing for these diverse identities to produce the type of bridging capital that has been theorized to bolster cognitive reserve.
Following this latter point, it is theoretically important to recognize that a diverse population does not automatically induce mixing across social groups. There must also be structural opportunities for social contact. We therefore analyzed three types of opportunity structures that are frequently discussed within the sociological literature but have not been simultaneously addressed within the AD literature: residential neighborhoods, workplace neighborhoods (i.e., workhoods), and civic organizations. Evaluating these structures addresses their theoretical distinctions in fostering varying degrees of bridging capital potential.
Residential neighborhoods have been theoretically and empirically linked to a range of health outcomes at the personal and population levels (Sampson 2003). We hypothesized that counties with ethnoracially integrated residential neighborhoods would have relatively low AD mortality rates because they provided proximal opportunities to develop bridging capital, which should theoretically reduce AD risk (hypothesis 2). We found mixed support for this hypothesis across different model specifications. This may reflect the fact that residential neighborhoods are less conducive to social contact (and subsequent bridging capital potential) than more “focused” structures such as workhoods or civic organizations. Indeed, when laying the foundations of focus theory, Feld (1981) noted that in social environments “that are less constraining on interaction (e.g., city neighborhood), only a slightly higher proportion of individuals will be [socially] tied than would be tied in the general population” (p. 1019). Given that a typical residential neighborhood is unlikely to enforce any clear institutional rules or expectations that would induce social contact among its residents (Small and Gose 2020), a lack of such organized social contact occurring within the residential neighborhood may therefore reflect the inconsistent support for hypothesis 2.
Our last two hypotheses (hypotheses 3 and 4) shifted attention to opportunity structures that are more socially focused than the residential neighborhood. Our measure of workhood integration, which drew on the sociodemographic composition of the census tracts in which individuals worked, was consistently negatively associated with AD mortality such that counties with higher levels of workhood integration experienced significantly lower mortality rates than counties with lower levels of workhood integration. These findings, which support H3, underscore the theoretical importance of the workplace in creating opportunities for bridging social capital. As noted by Hall et al. (2019), racial diversity in workplace settings “may contribute to the erosion of racial prejudice not only from the exposure of people to racial ‘others’ but also because it may bring people together through instrumental or purposeful, as well as incidental, contact” (p. 674). Indeed, the workplace reduces the physical distance necessary for social contact and provides a range of activities for which people can work together. This latter benefit aligns with experimental evidence on the importance of complex, cognitively stimulating tasks for maximizing the benefits of diverse contact (McLeod et al. 1996; Sommers et al. 2008). At the same time, it is worth recalling that our measure of workhood integration extended beyond worksites (e.g., office buildings) to include the entire census tract where residents work. This implies that working in the vicinity of a diverse population—which enables workers to share local commutes via public transit, patronize the same eateries, and carry out daily errands—might be enough to protect against AD, regardless of the sociodemographic composition of each specific worksite. Although further investigation into this latter claim is needed, experience sampling studies consistently demonstrate that individuals need not have extended or meaningful contact with people to cognitively benefit from diverse social exposures (Collins et al. 2022; Fingerman et al. 2020; Sandstrom and Dunn 2014; Zhaoyang et al. 2021). Weak contact with a socially diverse group of people appears to be protective in its own right (Perry, McConnell, et al. 2022).
The presence of civic organizations in a community also increases the likelihood of mixing between local residents because these organizational settings create further opportunities for direct social contact (Feld 1981). We built on this assumption put forth by focus theory to hypothesize that the combination of organizational presence (as an opportunity structure) and ethnoracial composition would interact such that diverse counties with exceptionally high rates of civic organizations would exhibit the lowest rates of AD mortality (hypothesis 4). This hypothesis consistently received strong support in our analysis. It is worth noting that civic organizations conceptually differ from workhoods because the former are voluntarily joined whereas the latter are mandatorily attended. Yet the findings from our study suggest that it does not matter how bridging capital develops (e.g., workhoods versus civic organizations). The end result is the same. Communities whose opportunity structures lay the foundations for bridging capital development fare better against AD than counties that are devoid of such opportunities.
Limitations and Future Directions
There are several limitations to this study. First, we used counties as our unit of analysis because these are administrative units that can be linked to secondary measures. Although county boundaries do not perfectly align with conventional definitions of a community, we mitigated this concern by using the ME index, which accounts for tract-level variations within each county. The combination of residential and workhood data, each of which had its own ME index, taps into the daily geographic flows of residents, which subsequently increase the probability that they will be exposed to people from different ethnic and racial backgrounds. Second, our county-level analysis prohibits us from assessing whether the same environment has systematically different effects on people depending upon their personal characteristics (Bronfenbrenner 1979). Future research should consider using a multilevel approach in which individuals are embedded within communities. This approach, which is amenable to person-level measures such as AD diagnosis or cognitive function, would allow researchers to determine whether the protective mechanisms of bridging social capital apply equally to individuals of all ethnoracial groups. We argue, however, that our population-level analysis informs the AD literature by drawing a link between structural opportunities for social capital at the community level and widespread prevalence of AD. Finally, we leveraged data on civic organizations as a proxy for the opportunity structures that exist outside of private (i.e., residential neighborhood) and professional spaces (i.e., workhoods). This is a common approach that relies on the fact that civic organizations, which are typically open to the public, are designed to promote the social interests of their members (Colistra et al. 2019; Rhubart et al. 2022; Whitham 2012). Yet it is important to acknowledge that civic organizations take different forms and not all organizations are anchored to a spatial location. Moreover, we lacked data on the sociodemographic composition of the civic organizations. We instead relied on the presence of these organizations, in conjunction with the ethnoracial diversity of the county, to infer bridging capital potential. We emphasize that this study makes no claims to the duration, frequency, or intensity of social contact between county residents. Rather, we used area-level measures of residential neighborhoods, workhoods, and civic organizations to infer the broad exchanges that likely surround opportunity structures characterized by a diverse population.
Conclusion
AD is a widespread public health issue that exhibits marked geographic disparities. In this study, we built on recent sociological studies that point toward the importance of bridging social capital by adopting a population-level approach in which we demonstrated that beyond the mere presence of a diverse population there must also be structural opportunities that facilitate bridging capital potential. These structures appear in the places in which people work as well as the voluntary civic organizations to which people belong. Moving forward research should consider other ways in which these opportunity structures might serve as protective factors at the community and personal levels.
Supplemental Material
sj-docx-1-srd-10.1177_23780231251327540 – Supplemental material for Bridging Social Capital Potential and Alzheimer’s Disease Mortality Rates
Supplemental material, sj-docx-1-srd-10.1177_23780231251327540 for Bridging Social Capital Potential and Alzheimer’s Disease Mortality Rates by Adam R. Roth, Ashley F. Railey and Siyun Peng in Socius
Footnotes
Acknowledgements
This research was presented at the 2023 annual meeting of the Population Association of America in New Orleans, Louisiana. The authors acknowledge the thoughtful comments received at the meeting.
Funding
The author(s) disclosed receipt of the following financial support for the research, authorship, and/or publication of this article: This research was supported by the National Institute on Aging (grant R01AG078247, Adam R. Roth, principal investigator).
Supplemental Material
Supplemental material for this article is available online.
Notes
Author Biographies
References
Supplementary Material
Please find the following supplemental material available below.
For Open Access articles published under a Creative Commons License, all supplemental material carries the same license as the article it is associated with.
For non-Open Access articles published, all supplemental material carries a non-exclusive license, and permission requests for re-use of supplemental material or any part of supplemental material shall be sent directly to the copyright owner as specified in the copyright notice associated with the article.