
Abstract
In the era of school choice, much research has examined how families access nonneighborhood schools, but little attention has been given to families’ prior connections to nonneighborhood locations. This study examines how activity spaces—the places where people work, play, worship, and otherwise spend time—relate to school enrollments and, by extension, school segregation. Combining longitudinal data from the Los Angeles Family and Neighborhood Survey with school and neighborhood demographics, the study tests hypotheses derived from the social structural sorting perspective, which predict that families’ activity spaces will influence school sorting processes. First, among schools more than two miles from the home, families were twice as likely to enroll when the school was near a previous activity location. Second, net of residence, racially segregating prior activity spaces (consisting of higher own-group proportions than the neighborhood) predicted racially segregating school enrollments (in schools with higher own-group proportions than the neighborhood school). The results demonstrate links between activity space segregation and school segregation, with implications for larger patterns of social and educational stratification in the twenty-first century.
Ethnoracial segregation divides American society. Originating from expansive discriminatory policies (Faber 2020; Rothstein 2017), and sustained through racial hierarchies, resource inequalities, and institutional forces (Hwang and McDaniel 2022), spatial differences in where groups live and spend time are associated with differential access to educational and employment opportunities, social networks, and resources. A robust literature measures segregation in specific sites, such as homes and schools (Owens 2017; Stroub and Richards 2013), often examining its relationship to inequalities in life opportunities (Massey 2016; Massey and Denton 1993; Reardon, Kalogrides, and Shores 2019; Reardon and Owens 2014).
Activity spaces—the locations where people spend time and conduct routine activities such as employment, worship, education, and recreation (Cagney et al. 2020)—have long been theoretically important to segregation: Du Bois (1899:128) noted that the color line exists across spaces, “not simply in the higher realms of intercourse, but also in church and school, in railway and street-car, in hotels and theaters, in streets and city sections.” Recent scholarship carries this perspective forward, theoretically and empirically, by exploring how social networks, resources, and institutions in activity spaces may be consequential for a range of outcomes (Browning and Soller 2014; Levy, Phillips, and Sampson 2020; Pinchak et al. 2022). Still, research on the consequences of activity spaces is nascent, with limited empirical evidence on many plausible processes.
The school choice era offers a unique setting to examine links between activity spaces and educational access: choice policies untether schools from neighborhood residence, allowing parents to consider schools beyond the boundaries of their neighborhoods (Berends, Primus, and Springer 2020), but also giving families opportunities to create greater segregation than neighborhood schools would (Bifulco, Ladd, and Ross 2009; Monarrez, Kisida, and Chingos 2022; Pearman and Swain 2017; Rich, Candipan, and Owens 2021). In this new era, a growing body of research investigates how geography influences enrollments (e.g., Altenhofen, Berends, and White 2016; Denice and Gross 2016), but little attention has been given to families’ prior connections to locations outside of their residential neighborhoods.
In this study, I examine activity spaces and school enrollments of families in Los Angeles County during a period when school choice was prevalent and growing. Combining the 2000–2001 and 2006–2008 waves of the Los Angeles Family and Neighborhood Survey (L.A. FANS) with school attendance boundaries, school demographics, and neighborhood demographics, I analyze (1) the relationship between activity space locations and school enrollments and (2) the relationship between activity space demographic features and the demographic characteristics of the enrolled school. Analyses on a sample of 507 children reveal that among schools more than two miles from the home, families were twice as likely to enroll when the school was near a previous activity location. Ethnoracially segregating prior activity spaces (consisting of higher own-group proportions than the neighborhood) also predicted ethnoracially segregating enrollments (in schools with higher own-group proportions than the neighborhood school). These findings demonstrate that, net of the residential neighborhood, activity spaces are associated with schooling decisions, with implications for segregation and educational stratification in the twenty-first century.
Beyond Residential Sorting: A New Era of School Choice
Place is known to structure social opportunities. A broad literature has examined “neighborhood effects” and the “geography of opportunity,” frequently identifying neighborhood-level variation in educational experiences (Reardon et al. 2019; Wodtke and Parbst 2017) and life-course mobility (Chetty, Hendren, and Katz 2016; Wodtke, Harding, and Elwert 2011). These differences in neighborhood opportunities are strongly associated with legacies of ethnoracial and class segregation, which created conditions under which Black, Latine, and poor residents often live in or near neighborhoods with high levels of disadvantage, while White and wealthy residents live in neighborhoods of isolated advantage (Howell 2019; Massey and Denton 1993; Quillian 2012; Sampson and Sharkey 2008; Wilson 1987).
Historically, neighborhoods have been determinative of public schooling possibilities, and neighborhood attainment has been tightly linked to school access. It is not uncommon for families, especially families with resources, to residentially relocate for schools (Lareau and Goyette 2014). Neighborhood boundaries may also be invoked (or redrawn) to bar access to schools (Bischoff 2008). Because of this strong link between neighborhoods and schools, segregation in the residential context has mostly ensured segregated schools (Monarrez 2023).
In recent decades, however, school choice policies – here defined broadly to include charter schools, open enrollment programs, magnet schools, and vouchers – have weakened the link between residential neighborhood and school enrollment, opening possibilities for families to access schools outside of their neighborhood catchment zones. The growth in school choice policies 1 disproportionately affects minoritized ethnoracial groups: in the 2019–2020 school year, 70 percent of charter schools served majority-non-White student bodies (Irwin et al. 2022).
In theory, choice policies “liberate” families from underperforming neighborhood schools (Archbald 2004) and offer a pathway to school integration even in segregated neighborhoods. In practice, however, ethnoracially marginalized families choose within sets of schools that are similar to their neighborhood schools in ethnoracial composition and performance (Denice and Gross 2016; Rich and Jennings 2015). Despite the considerable labor that Black mothers put into schooling decisions (Brown 2021; Cooper 2007), geographic barriers constrain the schools they choose from (Burdick-Will et al. 2020; Denice and Gross 2016). Language barriers sometimes limit how Latine families engage in school choice processes (Mavrogordato and Stein 2014). At the same time, White and advantaged families often use choice systems to attain Whiter and more advantaged schools than their neighborhood option (Candipan 2020; Pearman and Swain 2017; Schachner 2022), contributing to increases in ethnoracial segregation (Bifulco et al. 2009; Monarrez et al. 2022; Rich et al. 2021; Ukanwa, Jones, and Turner 2022). These findings cast doubt on the degree to which weakening the neighborhood-school link will integrate schools.
A combination of geographic constraints, racialized preferences, and academic preferences contribute to segregation in school choice contexts. For most families, the most important criterion of school selection is proximity to the home (Altenhofen et al. 2016; Denice and Gross 2016). Ethnoracial preferences may also play a role: White and Asian parents often prefer White schools over Black and Hispanic/Latine schools, while Latine and Black parents prefer Latine and Black schools, respectively (Billingham and Hunt 2016; Hailey 2022). Black and Latine families may also place more emphasis on mitigating risks around school safety and academics than White families, who tend to emphasize abstract educational qualities and niche schooling environments (Brown 2021; Holme 2002; Szabo 2022; Ukanwa et al. 2022). Beyond school-home distances, school demographics, and school characteristics, some studies note that parents hold nuanced geographic preferences (Bell 2007, 2009b), with schooling choices being connected to commuting routes or other ties to nonneighborhood locations. However, the relationship between families’ connections to locations outside their neighborhoods and their school enrollments has not been empirically examined.
Activity Spaces through the Social Structural Sorting Perspective
Activity spaces, defined as the collection of locations that individuals routinely visit, capture important dimensions of families’ spatial experiences that may be relevant to families’ educational decisions in the school choice era. Beyond residences and schools, these include workplaces, places of worship, shopping centers, recreational locations, and other places where people spend time. People spend considerable time in activity locations (Browning et al. 2021), which vary widely in environmental and social conditions. On average, activity spaces tend to be less segregated than residential neighborhoods (Athey et al. 2021; Browning et al. 2017), such that through activities, residents are exposed to different racial and economic demographics (Browning et al. 2017; Jones and Pebley 2014; Krivo et al. 2013). For instance, Black youth living in segregated neighborhoods experience considerable heterogeneity in activity spaces (Browning et al. 2022), suggesting that geographic isolation does not adequately describe urban exposures, even for highly segregated residents. Other studies have shown that Black and Latine residents (Jones and Pebley 2014; Krivo et al. 2013), and residents of Black and Latine neighborhoods (Levy et al. 2020; Wang et al. 2018), conduct activities in more disadvantaged neighborhoods than their peers.
Given the geographic and social variation in activity spaces, relative to individuals’ residential neighborhoods, we might expect these spaces to exert their own “neighborhood effects.” Harding et al. (2010) and Sharkey and Faber (2014) noted that people who spend time outside of their neighborhoods are likely given a smaller “dose” of their own neighborhood’s social forces. Similarly, individuals may receive “doses” the characteristics and amenities that neighborhoods offer in their activity spaces.
The social structural sorting perspective (SSSP; Krysan and Crowder 2017) offers a theoretical foundation for social and geographical influences on sorting processes, 2 and suggests that exposure to schools through everyday travels may influence sorting processes and segregation. According to the SSSP, individuals narrow possible choices to smaller “consideration sets” when choosing homes (or schools). Because consideration sets are shaped through the lenses of segregated neighborhoods, activities, and social networks, segregation is maintained. In the aggregate, familiarity with specific locations, and place-based social networks, can lead to residents selecting into segregated neighborhoods and schools. Drawing from the SSSP, the following section details mechanisms connecting activity spaces to school choices.
Mechanisms Connecting Activities to School Sorting
Figure 1 presents a theoretical model incorporating activity spaces into school sorting processes. Parents begin a school search by narrowing all possible schools into a smaller consideration set (Bell 2009a; Bosetti 2004; Burdick-Will et al. 2020). Although proximity to residence is a primary determinant of the consideration set (Altenhofen et al. 2016; Bell 2009b; Denice and Gross 2016; Hastings, Kane, and Staiger 2005; Lubienski and Lee 2017), parents also bring nuanced considerations of space and place. Schools’ distances to other locations, such as workplaces, siblings’ schools, and family members’ homes, are also factors (Bell 2007, 2009b). For example, in a longitudinal study of Detroit families, Bell (2009b:503) wrote that “a school off a parent’s commuting path was dropped from consideration early in the process,” illustrating the value of transportation feasibility for parents. Thus, when school choices are present, families may begin their search with schools that are spatially convenient, eliminating schools outside of regularly travelled spaces from consideration.

Theoretical school sorting model.
As families evaluate potential schools, activities may further inform their perceptions of school locations. Families often gather information about educational choices through social networks (Fong 2019), which may be formed or maintained in activity locations. Community centers and local institutions can be important sites of social networking and tie formation (Small 2009), and businesses such as coffeeshops and restaurants may be important conductors of “bridging” social ties, connecting individuals to residents of other neighborhoods (Cabrera and Najarian 2015). Institutions such as churches, community centers, and businesses play a significant role in tie formation for low-income individuals (Small and Gose 2020). Social ties formed during activities do “not necessarily derive from an intention to form connections among patrons or members” (Small and Gose 2020:104), suggesting that a range of activity locations may become places where meaningful interactions occur, even if individuals do not intend to form social ties in these places. In urban settings, many parents primarily learn about school opportunities through social connections at parks, playgrounds, and other locations (Bader, Lareau, and Evans 2019). These geographically located social ties are important to how parents obtain information on school quality and culture, and schooling opportunities (Bader et al. 2019; Holme 2002; Weininger 2014).
As they narrow down potential choices and ultimately select a school, parents may continually reconsider locational convenience. Bell (2009b) found that even parents who initially neglected the role of geography often experienced locational challenges (e.g., scheduling around a long school commute became difficult). These locational challenges are particularly important for parents with fewer transportation options or those who rely on public transit (Glaeser, Kahn, and Rappaport 2008).
Although the current study is focused on pathways between activities and school enrollments, these can be understood in the context of a broader set of interrelated pathways working in multiple directions. Figure 1 highlights a pathway from school enrollments to families’ future residential choices and activity spaces. For instance, families may structure their shopping or social routines around school pick-up and drop-off schedules. The SSSP describes how segregated residences lead to segregation in other spheres, which then shape knowledge of potential options and reinforce segregation in the residential sphere (Krysan and Crowder 2017). Similarly, activities may shape knowledge and perceptions of possible schools, and families’ chosen schools could facilitate sorting in activity spaces.
Hypotheses
Focusing on the association between activities and schools, the following hypotheses flow from the theoretical model:
Hypothesis 1: All else equal, families will be more likely to enroll in schools near their previous activities.
Hypothesis 2: Ethnoracially segregating activity spaces (consisting of higher own-group proportions than the neighborhood) will predict ethnoracially segregating school enrollments (in schools with higher own-group proportions than the neighborhood school).
The Los Angeles Context
Los Angeles County’s history of school choice makes it an ideal setting for the present study. California’s 1993 AB 1114 and AB 19 mandated that districts hold open enrollment policies, which allow parents to enroll their children in schools outside their attendance zones and sometimes outside district boundaries (Ledwith 2009). California law encourages (but does not require) schools and districts to consider place of parental employment in intradistrict and interdistrict transfers, potentially broadening schooling access for students with parents who commute outside of their attendance zone or district (California Department of Education 2023). Los Angeles County contains 83 school districts, with the Los Angeles Unified School District (LAUSD) being the largest. Within LAUSD, families can participate in open enrollment, in which they apply to each nonneighborhood school separately, rather than ranking several schools at once. If the nonneighborhood school has open seats, students will receive invitations (on a random basis if applications exceed the number of open seats; LAUSD 2022). There are limitations to the open enrollment policy (see Ledwith 2009 for a fuller discussion) and barriers preventing students from entering charter schools; nonetheless, more than one-third of students aged 12 years and older enrolled in nonneighborhood schools in 2000–2001, with Asian, Black, Latine, and White students all participating in open enrollment at rates above 20 percent (Ledwith 2009, 2010). In addition to the open enrollment policy, L.A.’s charter school options expanded rapidly in the twenty-first century: between 2002 and 2008, the number of charter schools in Los Angeles increased from 52 to 157 (Lauen, Fuller, and Dauter 2015).
Los Angeles’s multiethnic population is spatially divided along ethnic and racial boundaries. In 2000, Los Angeles County’s population of 9.5 million people was 45 percent Latine, 31 percent White, 13 percent Asian and Pacific Islander, and 10 percent Black (Sastry et al. 2006a). The metropolitan area was one of two places in the United States where both Black and Hispanic/Latine populations were hypersegregated from White residents (Wilkes and Iceland 2004). Research using the L.A. FANS shows ethnoracial and socioeconomic disparities in travel patterns, with non-White residents visiting more disadvantaged neighborhoods than White residents (Jones and Pebley 2014; Krivo et al. 2013) and affluent residents being the least likely to intersect with neighbors in activity locations (Browning et al. 2017).
Figures 2 and 3 show ethnoracial and socioeconomic demographics of neighborhoods and schools throughout the county, with a focus on the LAUSD, where approximately half of the county’s children reside. Schools are bifurcated into a higher poverty, segregated urban core and lower poverty and integrated suburban regions. Greater variation in school contexts occurs across districts than within districts 3 (Clark and Maas 2012). Although schools are spatially segregated, most districts contain schools of varying demographics, and some students use the open enrollment policy to attain more integrated schools (Ledwith 2009).

Census tract demographics and school ethnoracial compositions, Los Angeles County.

Census tract demographics and school ethnoracial compositions, Los Angeles County.
Data
Sample Population
In this study, I analyze a sample of families from the first and second waves of L.A. FANS, which were collected between 2000–2001 and 2006–2008, respectively. The unique combination of information in L.A. FANS—family activities, demographics, and enrollments over time in a setting with school choice—provides more detailed information on student choices over time than recent activity space data sources (such as health and mobility studies or mobility patterns gathered from cell phone records), making L.A. FANS well suited for testing this study’s hypotheses.
L.A. FANS covers 65 neighborhoods, defined as census tracts, in Los Angeles County. Neighborhoods were selected in all regions of the county, with poor tracts oversampled (20 tracts in the 90th to 100th percentiles of poverty rates, 20 in the 60th to 90th percentiles, and 25 in the 0th to 60th percentiles). In each neighborhood, approximately 39 households were selected, with households with children overrepresented (constituting 70 percent of the sample). In households with children, a child was randomly selected, as well as a sibling if applicable. The children’s primary caregiver, usually the mother, was interviewed about the children (Peterson et al. 2011; Sastry et al. 2006b).
I limit the analyses to L.A. FANS children whose families did not move between waves (60 percent of wave 2 households). I focus on nonmovers for three reasons. First, this study is focused on school sorting. Although residential sorting is a central mechanism for school access, movers introduce new relationships between activities, homes, and schools, which would require more data to adequately disentangle. Second, focusing on nonmovers carries advantages for choice modeling, as it allows for choice sets based on a constant home address for each family. Third, by restricting the sample to a set of nonmovers, I can analyze within-neighborhood differences in school access, distinguishing the role of activities from neighborhood effects. The resulting sample contains 507 children in 371 households who enrolled in public schools in wave 2.
Compared with movers, nonmovers have higher incomes ($48,509 vs. $33,201) and attend schools with slightly lower average performance scores (693 vs. 708). Nonmovers are also more likely to opt for their neighborhood schools (63 percent vs. 51 percent), even though many movers remain in prior neighborhood schools. These groups are statistically indistinguishable on other demographic, neighborhood, and school characteristics (shown in Table A1 in the Appendix). Within the analytic sample, family characteristics and student information are missing at a rate of 11 percent across variables. I use multiple imputation to estimate these missing values (van Buuren and Groothuis-Oudshoorn 2011).
Defining Activity Spaces
Adults and caregivers in L.A. FANS were asked, “What store do you and others in this household normally go to buy groceries?” and similar questions for places of employment, worship, health care, and other places where they spent time. Locations were initially provided in the form of addresses or cross-streets, which were mapped to census tracts using geographic information system software (Peterson et al. 2011). For each household, adults provided information on their own activities and others’ that they would reasonably know about (e.g., primary caregivers reported children’s schooling and health care locations; Peterson et al. 2011) or indicated that the household did not conduct the activity (e.g., no one in the household attended a place of worship). I include activities in the following counties: Kern, Los Angeles, Orange, San Bernardino, and Ventura. 4
Table 1 displays L.A. FANS activity categories, along with the percentage of all households that listed the activity, and the percentage of activities that are “distal,” or beyond the residential and adjacent neighborhoods. Activity locations include health care locations, grocery stores, the place where the respondent spends the most time, place of worship, place of work, family members’ home, childcare locations and any school that the adult attends, and other locations where children stay part time. Residents were more likely to go to distal locations for employment and health care but tended to go to grocery stores and places of worship closer to their home.
Activity Location Prevalence and Proximity to Residence.

Source: Los Angeles Family and Neighborhood Survey wave 1 (2000–2001) and wave 2 (2006–2008).
Note: Estimates are based on sample of 507 children in waves 1 and 2 who did not move between waves. “Total activities” refers to the number of total listed activity locations for all sample households (households generally list multiple). Households did not report activities which were not relevant (e.g., if the primary caregiver was not currently employed, this was not reported). “Distal” activities are those outside the residential neighborhood and adjacent neighborhoods.
Activity Space Geography and Demographics
I primarily follow a “node” approach to geographically defining activity spaces (Jones and Pebley 2014; Wong and Shaw 2011), where activity spaces consist of all activity neighborhoods, but not locations between the home and the activities (e.g., commuting routes). An “activity neighborhood” refers to the census tract of that activity location. As a measure of colocation between a given school and activity space, I consider whether the school is in or adjacent to (i.e., in a neighboring tract) the activity space census tract. The binary variable is coded 1 if a school is near an activity and 0 if a school is neither in the activity tract nor in an adjacent tract.
Following research on the demographic characteristics of activity spaces (Browning et al. 2022; Jones and Pebley 2014; Krivo et al. 2013), I measure the ethnoracial and socioeconomic compositions of activity space neighborhoods using tract demographics from the 2000 census. I measure ethnoracial composition using the average proportions of non-Hispanic White residents, Latine residents, Black residents, Asian residents, and all others. Each activity is weighed equally in these demographic averages (for example, if a family listed multiple health care centers, these would be given the same weight as a single place of employment). Krivo et al. (2013) use the same method, noting that although this approach assumes that residents engage with all activities equally, L.A. FANS does not contain information on frequency or duration of visits, leaving no clear alternative weighting scheme.
School Demographics
Each family’s primary caregiver provided information on schools their children attended. Using county-district-school codes, I match the parental responses to public schools 5 in Los Angeles County. To assess whether children attended their neighborhood public school, I match respondents’ census block boundaries with grade level–specific school attendance zones from County of Los Angeles Enterprise GIS (County of Los Angeles 2002). If the students’ school attendance zone overlaps with their residential block, 6 I consider the student enrolled in their neighborhood public school (as opposed to using open enrollment). 7 This method reveals that approximately one third of K–12 public school students opt out of their neighborhood schools (mirroring what Ledwith 2010 found).
I use information from the California Department of Education on student demographics and academic performance. I measure the ethnoracial composition of the schools using the proportion of White, Latine, Black, Asian, and all other students. I measure the economic composition of schools using the proportion of children who are eligible for free or reduced-price meals and school test performance using the Academic Performance Index. All school characteristics are aggregated from 2006 to 2008 to match wave 2 L.A. FANS enrollments.
To measure socioeconomic conditions of the neighborhood in which the school is located, I calculate the first principal component of seven census tract characteristics: poverty, unemployment, welfare receipt, female-headed households, educational attainment (proportion of residents with college degrees and proportion without high school diplomas), and occupational status (proportion of residents in professional or managerial occupations). This approach mirrors how other studies have measured “neighborhood disadvantage” (e.g., Wodtke et al. 2011). Additional information on school enrollments across panels is provided in Table A2.
Family and Child Variables
I classify the child’s ethnoracial status, provided by the primary caregiver, into the following five categories: Asian, Black, Latine, White, and other. To measure each family’s socioeconomic status, I average standardized measures of family income and education levels of the child’s primary and secondary caregivers (usually the child’s parents).
I also consider potentially confounding child and family characteristics. These include the child’s grade level and indicators for an whether families had access to a car and whether the primary caregiver or another adult in the household was born outside the United States. Last, I measure parental cognitive skills, which contribute to inequalities in schooling decisions and neighborhood sorting (Schachner and Sampson 2020), using scores from the Woodcock-Johnson test.
Analytic Approach
Analysis of Specific School Enrollments
To investigate the first hypothesis (students will be more likely to enroll in schools near activity spaces), I construct choice sets of plausible schools for each student and model relationships between activities and enrollments within these choice sets. Prior literature suggests that families prefer schools within two miles of the home (Bell 2009b; Denice and Gross 2016) but are sometimes willing to travel 5 miles or farther, particularly in the western United States (Schachner 2022). I therefore create choice sets of plausible schools—those where the grade range matches the student’s wave 2 grade—for each student within 2 miles, 5 miles, and 10 miles from the home. I measure school-to-home distances using block-to-block group internal points. 8 The 2-mile choice sets capture 79 percent of actual public school enrollments, the 5-mile sets capture 93 percent of actual public school enrollments, and the 10-mile sets capture 98 percent of enrollments. Students have a median of six schools within 2 miles and within district boundaries.
From these choice sets, I use conditional logistic models to predict wave 2 school enrollments. Conditional logistic models are appropriate when choices are exclusive (an individual can only choose one option), finite, and exhaustive (all options are represented; Train 2003). Although the exclusive and finite conditions hold for school options, choices are not necessarily exhaustive: families can opt for a range of non-public school options. Some families opt out of public schools entirely (approximately 13 percent of wave 2 children), limiting the generalizability of these data. The conditional logistic model also relies on the assumption of independence of irrelevant alternatives, which specifies that the odds ratio associated with any given person-choice match should not change on the basis of the number of alternative choices. Here, individuals’ preferences for one school over another should remain the same independent of the other options available to them. Because the utility of existing tests of this assumption is unclear (Bruch and Mare 2012; Quillian 2015; Schachner and Sampson 2020; Train 2003) and because the coefficients are still likely to be average effects of characteristics on utilities even if the assumption does not hold (Train 2003), I proceed with this assumption. The general model of choice is as follows:

where Uis is the utility of school s for individual i, Zs represents characteristics of school s, Xi represents characteristics of individual i, and ρ is represents unobserved variation in utilities. F(·) is a linear model, such that the difference in utilities between two schools (1 and 2) can be represented as

Individual characteristics are constant throughout each choice set and influence the utility only through interactions with the school characteristics. Assuming the errors follow a Gumbel distribution, the probability that the student enrolls in the school s,
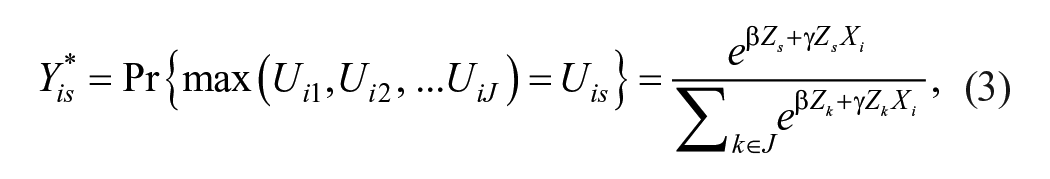
where Zk are school-level characteristics, such as performance or student demographics, and ZkXi are interactions between school characteristics and individual characteristics, such as the distance from the home to the school, for school k within choice set J (Bruch and Mare 2012). Error terms are clustered at the student level.
To account for whether families opt out of the neighborhood school at all, I follow a similar strategy to Bruch and Mare (2012) and include both students who enroll in and opt out of neighborhood schools, with a binary indicator of whether the school is the student’s neighborhood school. I also include measures of distance from the school to the home, distance squared, and whether the school lies within the student’s district boundaries. Last, I include the school percentages of Black, White, Hispanic, and poor students, and the level of disadvantage in the neighborhood where the school is located. Interactions between school ethnoracial compositions and individual ethnoracial status account for race-specific preferences (Hailey 2022). The conditional logistic model uses maximum likelihood to estimate the coefficients for school-level characteristics and interactions between individual- and school-level characteristics.
Analysis of Segregating or Integrating Enrollments
To investigate the second hypothesis (segregated activities will predict segregating school enrollments), I estimate models of the general form

where ΔSIij represents a continuous measure of the difference between the composition of the enrolled school and the neighborhood school. A positive value of ΔSIij represents an “integrating” enrollment (one that produces less overall segregation than the neighborhood enrollment would), while a negative value represents an “segregating” enrollment. Similarly, ΔASIij is the difference between the average ethnoracial characteristics of a child’s family’s activity space and the characteristics of their residential neighborhood. A positive value of ΔASIij represents an integrating activity space and a negative value represents a segregating activity space (relative to the neighborhood). γ
j
is a wave 1 neighborhood-level fixed effect, and
The degree to which enrollments and activity spaces are segregating or integrating is coded differently depending on the child’s ethnoracial status. For example, a White child who enrolls in a school that is 10 percentage points Whiter than their neighborhood school would be classified as an “segregating” enrollment, with a ΔSIij score of −0.1. A Latine child who enrolls in a school that is 10 percentage points less Latine than their neighborhood school would be classified as a “integrating” enrollment, with a ΔSIij score of 0.1. Analogous logic is used to code ΔASIij (e.g., a White student whose family activity spaces are 10 percentage points Whiter than their neighborhood would have a ΔSIij score of −0.1). The β2 coefficient represents the relationship of interest, the association between segregating activity spaces and segregating school enrollments.
I consider three ethnoracial boundaries in this analysis of segregating enrollments. First, given the historic position of White U.S. residents in ethnoracial hierarchies, I use the White-Nonwhite boundary. Second, given the large Latine population of Los Angeles, I consider segregation between Latine and Non-Latine children. Last, due to the growing scholarship that indicates the possibility of changing ethnic boundaries from “who is White” to “who is Black” in twenty-first century ethnoracial hierarchies (Lee and Bean 2004), and the educational and socioeconomic similarities of Black and Latine groups relative to all others in Los Angeles, I consider segregation between students who are Black or Latine and students who are White, Asian, or other.
Results
Descriptive Results
In terms of schooling, Table 2 shows that open enrollment is used across groups: at least 35 percent of Black, Latine, and White families opted out of neighborhood schools. On average, families enrolled in schools that were slightly higher performing and served fewer poor students than their neighborhood schools. These results align with Ledwith’s (2009) finding that Latine families can access higher performing and more integrated schools outside their neighborhoods, although access to majority-White schools remains rare. Indeed, choice seems uniquely leveraged by White students, who enrolled in schools that were 17.3 points higher performing, 6.7 percent less poor, and 6.0 percent Whiter than their assigned school.
Residential, Activity Space, and School Characteristics by Race/Ethnicity.
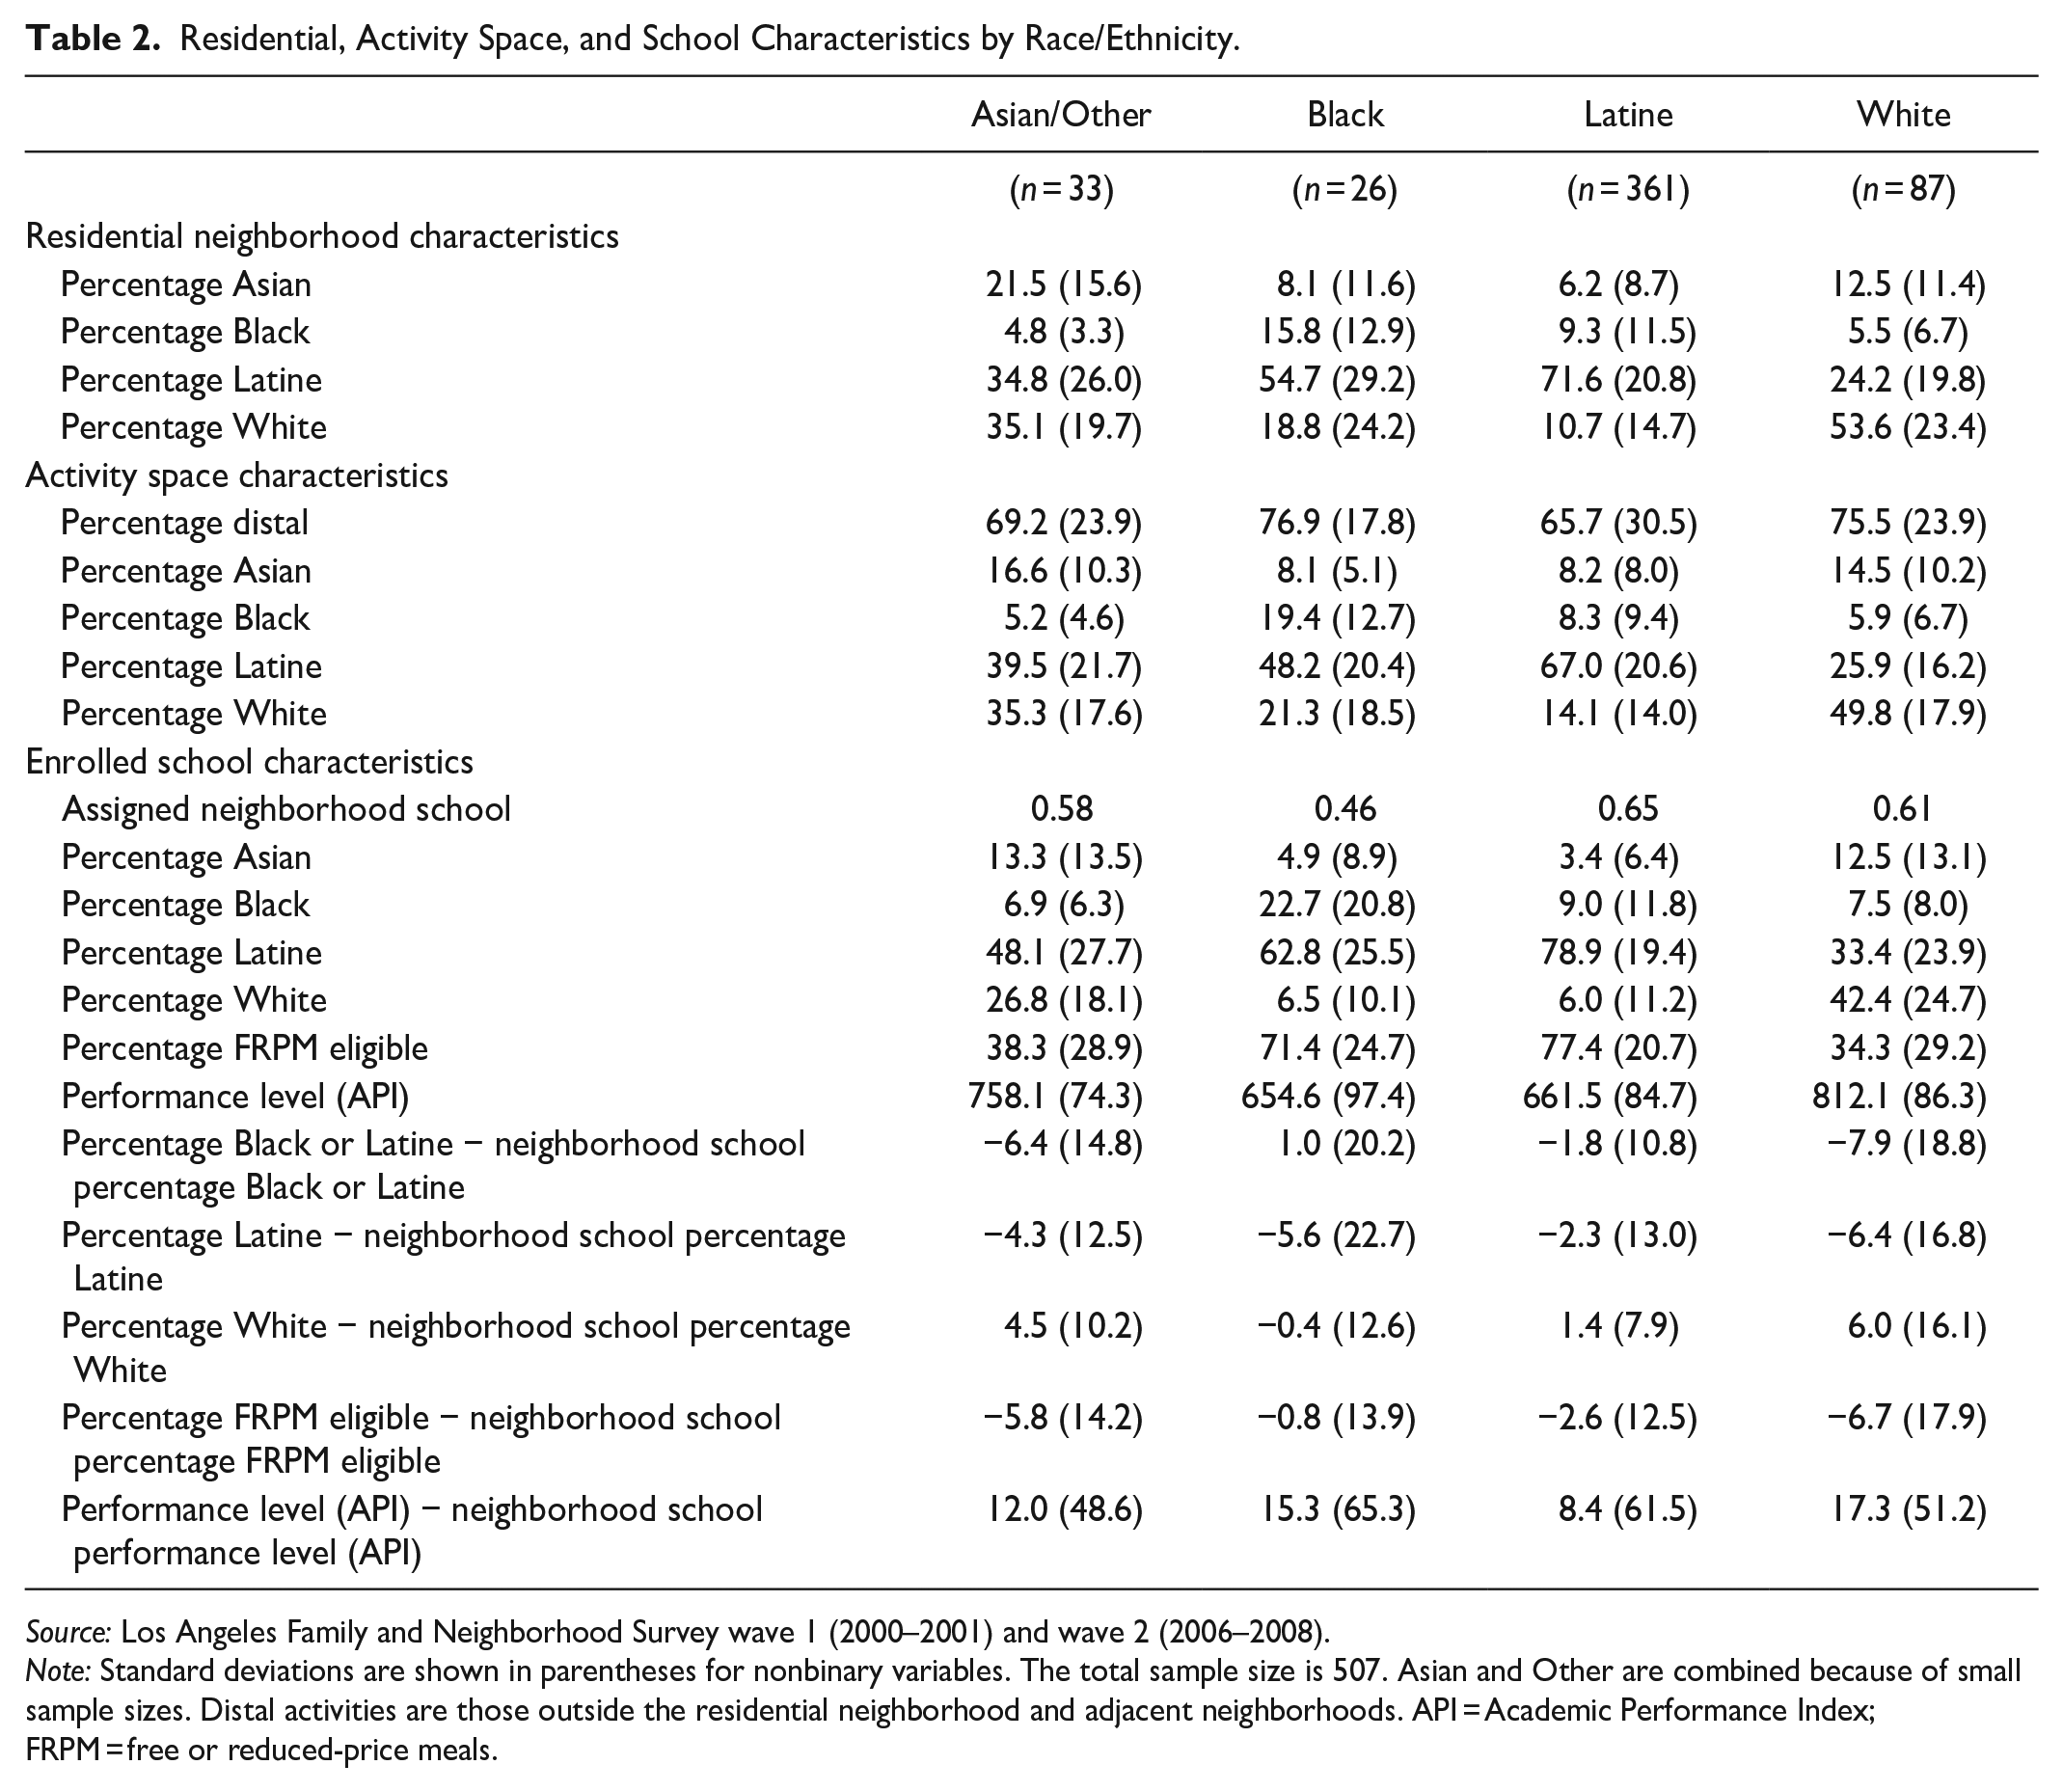
Source: Los Angeles Family and Neighborhood Survey wave 1 (2000–2001) and wave 2 (2006–2008).
Note: Standard deviations are shown in parentheses for nonbinary variables. The total sample size is 507. Asian and Other are combined because of small sample sizes. Distal activities are those outside the residential neighborhood and adjacent neighborhoods. API = Academic Performance Index; FRPM = free or reduced-price meals.
Table 2 also provides descriptive statistics on sample demographics and activity spaces. Consistent with previous research (Browning et al. 2017; Jones and Pebley 2014; Krivo et al. 2013), families’ activity spaces and educational sorting patterns are structured by race and class. Non-White families in Los Angeles tended to conduct activities in neighborhoods that are mostly non-White, whereas White families, on average, conduct activities in White neighborhoods. Still, large standard deviations point to considerable variation in families’ proportions of distal activities, and in the demographics of activity space locations. Additional analyses, shown in Table A3, reveal that places of employment are the most integrating activities, while places of worship and places that family members stay part time are segregating.
Are Activities Related to Specific Enrollment Decisions?
Table 3 presents results from conditional logistic models estimating the probability of enrollment from choice sets of schools within a series of radii from children’s residences. Model 1 estimates enrollments using school characteristics and activities that the child’s family conducted near the school in wave 1 among schools within two miles from the home. Models 2 and 3 estimate the same relationships, at 5- and 10-mile radii. All three models exclude students who enroll outside of these radii, resulting in slightly smaller sample sizes for the smaller radii. To allow for different choice mechanisms between neighborhood and nonneighborhood schools, I interact whether a school is near an activity tract with whether the school is the neighborhood school.
Conditional Logistic Estimates of Wave 2 School Choices.

Source: Los Angeles Family and Neighborhood Survey wave 1 (2000–2001) and wave 2 (2006–2008).
Note: Models include all interactions between ethnoracial groups and school ethnoracial characteristics. Only own-race interactions shown here for conciseness. Table A4 reports an alternative specification with all ethnoracial interactions displayed. API = Academic Performance Index; FRPM = free or reduced-price meals.
p < .05, **p < .01, and ***p < .001 (two-tailed tests).
Several noteworthy relationships emerge between family characteristics and school enrollments: even within the two-mile radius, families are less likely to enroll students in more distal schools (although this relationship is nonlinear, as shown by the distance squared coefficient). Unsurprisingly, families are more likely to choose neighborhood schools and schools within their district. Although parents may hold racialized preferences (Hailey 2022), I find little evidence of school racial compositions driving enrollments, net of other characteristics. Interestingly, school performance is negatively associated with enrollment likelihood. This relationship is likely caused by school constraints, rather than choices to enroll in schools with lower test scores, net of other attributes. In an alternative specification reported in Table A4, I show that the negative relationship between school performance and enrollments is entirely driven by students’ socioeconomic characteristics, suggesting that school characteristics that are appealing (or accessible) to socioeconomically disadvantaged families differ from those of their more advantaged peers. Finally, all three models also show that families avoid schools in disadvantaged neighborhoods: a 1 standard deviation increase in disadvantage corresponds to a 39 to 54 percent decline in the probability that a child enrolls (e−0.77 = 0.46, e−0.49 = 0.61, e−0.50 = 0.61). It is possible that families avoid neighborhoods with higher levels of real or perceived violence (Burdick-Will, Stein, and Grigg 2019), as parents often cite safety as a concern in choosing schools (Szabo 2022). Place-based perceptions of social organization may additionally (or alternatively) lead families to avoid schools in disadvantaged neighborhoods.
Turning to the main relationship of interest, model 1 reveals no significant association between activity spaces and enrollments for students opting out of neighborhood schools within two miles. However, models 2 and 3 show significant and positive relationships between activity locations and enrollments, with the presence of these activities increasing the likelihood of enrollment by factors of 1.8 and 2.2, respectively (e0.58 = 1.79, e0.81 = 2.25). These relationships are significantly diminished for neighborhood schools, essentially nullifying the relationship between activities and enrollments for these schools.
In sum, activity spaces are predictive of future school sorting patterns for students that opt out of neighborhood schools beyond the two-mile radius. Consistent with hypothesis 1, all else equal, families are more likely to enroll in schools geographically close to previous activities. These relationships are stronger at larger distances from the home. Explanations of school sorting based on convenience, exposure, and social ties align with these findings: families are more likely to opt for schools near neighborhoods where they have previously spent significant amounts of time.
Importantly, activities near the neighborhood school do not increase the likelihood that families enroll there. Like multistage decision processes in the residential context (Bruch and Swait 2019; Krysan and Crowder 2017), it may be that parents first consider the neighborhood school, and only investigate alternative options after they have formed an opinion of the neighborhood school. If the main mechanism by which activities relate to enrollments is exposure to potential schools, activities would be less likely to sway parents toward the neighborhood option (which they would already know about).
Do Segregated Activities Lead to Segregated Enrollments?
I now turn to whether segregated activities are related to segregating school enrollments. Table 4 reports the coefficients predicting the degree to which families make segregating or integrating enrollments in wave 2. Models 1 and 2 examine White/non-White segregation, models 3 and 4 examine Latine/non-Latine segregation, and models 5 and 6 examine segregation between Black or Latine students and all others. For each type of segregation, the first model reports the main relationship between activity spaces and enrollments, and the second model reports the interaction of activity space characteristics with race (allowing exploration of whether ethnoracial groups contribute differently to the main relationship).
Estimates of Wave 2 Integrating/Segregating Enrollments (n = 507).

Source: Los Angeles Family and Neighborhood Survey wave 1 (2000–2001) and wave 2 (2006–2008).
Note: Negative values represent more segregation than enrolling in the neighborhood school would produce. For integrating/segregating activity spaces, positive values indicate that integrated activity spaces are associated with integrating enrollments (and segregating activity spaces with segregating enrollments). For interpretability, integrating/segregating enrollments are expressed as percentage points. WJ = Woodcock-Johnson.
p < .05, **p < .01, and ***p < .001 (two-tailed tests).
Across models, race appears to drive sorting patterns, with White children enrolling in schools that are 12 to 13 percentage points Whiter than their peers, 13 to 15 percentage points less Latine than their peers, and 14 to 15 percentage points less Black or Latine than their peers, net of neighborhood and family characteristics. These results are consistent with other evidence of White families using school choice policies to attain Whiter schools (Bifulco et al. 2009; Schachner 2022). Asian students also make segregating enrollments, but to a lesser degree, enrolling in schools that are 9 to 10 percentage points less Black or Latine than otherwise similar students.
Beginning with the White/non-White boundary, I find that segregating activity spaces predict segregating enrollments. Model 1 shows that on average, families with activity ties that are 20 percentage points more segregating than their neighbors (approximately 1 standard deviation) enroll in schools that contain 5.8 percentage points more of their own ethnoracial group than their neighborhood schools. Such a difference is substantial considering that results are averaged across students who did and did not enroll in neighborhood schools. Model 2 reports no significant variation in this relationship across ethnoracial groups, implying that Whiter activity spaces predict enrollments in Whiter schools for White and non-White students alike.
I find similar relationships for the Latine/non-Latine boundary: model 3 reports that a 20 percentage point increase in segregating activity spaces is associated with a 5.1 percentage point increase in own-group composition. Here, however, results vary by ethnoracial group. Model 4 shows that for Latine students the same change in activity space ethnoracial composition is associated with only a 2.6 percentage point increase in own group share in the enrolled school. For Black and White students, the share of Latine residents in activity spaces is more strongly linked to the Latine share of students in their enrolled school (with a 20 percentage point increase in segregating activity spaces associated with 12.9 and 10.2 percentage point increases in non-Latine students, respectively).
Last, models 5 and 6 examine the boundary between Black and Latine students compared with all others. Once again, segregating activity spaces contribute to segregating enrollments, but to a slightly lesser degree than for the previous boundaries: a 20 percentage point increase in own-group composition in activity spaces corresponds to a 4.4 percentage point increase in school own-group composition. Along this boundary, model 6 shows that White students drive the relationship between activity spaces and school demographics: for White students, a 20 percentage point increase in activity space own-group composition is associated with a 9.9 percentage point increase in school own-group composition. For other ethnoracial groups, the relationship is not statistically significant.
Taken together, these findings support hypothesis 2, which predicts that segregated activities will guide families toward segregating school enrollments. Ethnoracial segregation in activity spaces appears to be related to ethnoracially segregating school enrollments, suggesting that ethnoracially isolated activities, at least in terms of the share of White residents, Latine and non-Latine residents, and residents who are Black or Latine, are connected to families’ school enrollment patterns and to the degree to which families make segregating enrollments. The results are interpreted in terms of segregating activity spaces and enrollments but imply the same positive relationship between integrating activity spaces and integrating school enrollments.
Discussion and Conclusion
Activity spaces may be increasingly consequential for inequalities in twenty-first century cities. With recent studies documenting high levels of ethnroacial and class segregation in activity spaces (Athey et al. 2021; Browning et al. 2017; Jones and Pebley 2014; Levy et al. 2020; Wang et al. 2018), particularly in cities (Nilforoshan et al. 2023), there is a need to understand the implications of such spatial separation.
This study demonstrates that in the Los Angeles context, activity spaces are related to school enrollments for those that search more than two miles from their residence, and that racially segregating activities predict racially segregating enrollments, while integrating activities predict integrating enrollments. The findings are consistent with a model in which activities shape how families screen for potential schools and evaluate schools outside the local context: beyond two miles of the residence, families in the sample were twice as likely to choose nonneighborhood schools near workplaces, religious institutions, family members’ neighborhoods, grocery stores, health care centers, or other settings with which they are already familiar, than otherwise similar schools outside their activity spaces. As families search for schools beyond the neighborhood, their mobility patterns may shape which schools they consider, and where they ultimately enroll their children.
In this way, ethnoracial segregation in activity spaces may create segregated consideration sets among families searching for nonneighborhood schools and contribute to school segregation in the era of school choice. Net of residential neighborhoods, L.A. FANS families with ethnoracially segregating activity spaces made segregating enrollments, sending their children to schools with higher own-group percentages. This relationship persists across the three ethnoracial boundaries tested (White/non-White, Latine/non-Latine, and Black and Latine compared with all others).
The design of this study, using wave 1 activities to predict wave 2 school enrollments for nonmovers, helps in disentangling the interdependencies of neighborhoods, activities, and schools. Importantly, this approach allows the measurement of differences over time in children and households with similar neighborhoods and other characteristics to isolate the role of activities. Of course, segregation in homes, activities, and schools are inextricably linked. Alternative pathways—for instance, schools shaping activity spaces as well as later school enrollments—are possible, and as such, the current results should be interpreted as associations rather than proof of causality. Furthermore, the results may not extend to families who move (although the nonmovers in L.A. FANS are largely similar to movers, as shown in Table A1).
Several other limitations merit attention. First, the geospatial measures of activity spaces and school enrollments do not capture the full extent of individuals’ movements. Like many studies of segregation in activities, in the present study I use “atemporal” activity spaces, which do not account for the fact that individuals may use activity locations at different times of day or with different frequencies (Ellis, Wright, and Parks 2004), or even congregate in different institutions within spaces (Hall, Iceland, and Yi 2019). Residents may also change activity locations or add new activities over time. Second, the exhaustive assumption for conditional logistic models is not fully satisfied, as noted in the Analytic Approach section, potentially limiting interpretation for a general student population. Third, the present study is focused on Los Angeles in the 2000s, which comprised a larger Latine population compared with other U.S. cities, as well as unique patterns of hypersegregation (Wilkes and Iceland 2004), urban sprawl, and car-dominated transportation. In other cities, public transit networks are critical to the spatial mobility patterns of poor residents (Glaeser et al. 2008), and although the pathways presented here from activity spaces to school sorting (e.g., exposure to potential schools, logistical convenience) are plausible in these locations, this study can only directly comment on the Los Angeles region. Finally, in terms of school enrollments, the 2002 attendance boundaries may have shifted before the second wave.
Limitations notwithstanding, this study shows a substantively meaningful relationship between activities and school enrollments over time, net of neighborhood and family characteristics. The analyses connect theoretical models of segregation, which suggest that mobility patterns may play a role in perpetuating spatial inequality in the modern era (Krysan and Crowder 2017), and empirical analyses of school choices, which tend to focus on families’ residential and school characteristics as explanatory factors. The findings of this study can be understood within the SSSP, which states that proximity to and knowledge of resources shape processes of segregation (Krysan and Crowder 2017). Furthermore, the mechanisms described are potentially informative for other sorting processes, such as selection into residences or community organizations.
As neighborhoods change and school choice policies expand, activities constitute an important element of inequality. Gentrifying families may use activities to separate themselves from long-term residents (Lees 2008), and the growth of school choice – 8 percent of public K–12 students in the United States now attend charter schools compared with 1 percent in 2000 (Irwin et al. 2024) – may correspond to greater school segregation. Candipan (2020) found that in gentrifying neighborhoods, recent movers are less likely to enroll in public schools, and more likely to seek school options elsewhere, compared with longer term residents. These trends—the confluence of neighborhood demographic change and increases in school choice—suggest that activity spaces could play an even greater role in overall school sorting patterns now than during the study period.
Historically, policies aimed at reducing segregation tend to focus solely on neighborhoods or schools. Programs such as Moving to Opportunity, HOPE IV, and Gautreaux incentivize low-income families to move into middle-class neighborhoods, and post–Brown v. Board of Education school desegregation plans mandate that districts achieve various within-district benchmarks. These efforts reduced segregation and improved opportunities for children (Chetty et al. 2016; Johnson and Nazaryan 2019; Popkin, Levy, and Buron 2009; Reardon and Owens 2014), but in the current urban landscape, where residents of diverse neighborhoods can lead separate lives, and where families can opt out of diverse public schools, similar policies might not carry the same gains. What would it look like if policies focused on creating and maintaining integrated activity spaces? Such policies might leverage local knowledge to foster shared social connections, outings, recreation, and labor. True integration is not just “the colocation of Black and White bodies” (Patillo 2019:32), but instead means that residents “use the same public spaces, ride the same buses, and interact on relatively equal footing” (Ellen and Steil 2019:14). If successful, the benefits of activity integration would likely spill into schools, and other spaces too.
Footnotes
Appendix
Conditional Logistic Estimates of Wave 2 School Choices, Alternative Specification.

| Pr(Enroll) | |||
|---|---|---|---|
| Model 1 | Model 2 | Model 3 | |
| Radius | 2 Miles | 5 Miles | 10 Miles |
| Performance level (API in 100s) | .01 | −.08 | −.01 |
| (.19) | (.12) | (.10) | |
| SES · performance level (API in 100s) | .59*** | .38*** | .40*** |
| (.17) | (.10) | (.09) | |
| Percent FRPM eligible | −.03* | −.02** | −.01* |
| (.01) | (.01) | (.01) | |
| Neighborhood disadvantage | −.89*** | −.53*** | −.53*** |
| (.28) | (.19) | (.18) | |
| Percent Asian (reference: Latine) | −.05 | .04 | .04 |
| (.08) | (.05) | (.04) | |
| Percentage Black | −.04 | .03 | .03 |
| (.07) | (.05) | (.03) | |
| Percentage Latine | .02 | .06 | .05* |
| (.05) | (.04) | (.03) | |
| Percentage White | −.11 | .05 | .04 |
| (.08) | (.05) | (.03) | |
| Asian · percentage Asian | .26** | .01 | −.02 |
| (.12) | (.06) | (.05) | |
| Asian · percentage Black | .14 | .01 | −.03 |
| (.10) | (.05) | (.04) | |
| Asian · percentage Latine | .18* | −.01 | −.02 |
| (.10) | (.05) | (.04) | |
| Asian · percentage White | .30*** | .02 | .01 |
| (.11) | (.05) | (.04) | |
| Black · percentage Asian | .19 | .06 | .05 |
| (.64) | (.16) | (.13) | |
| Black · percentage Black | .25 | .09 | .08 |
| (.54) | (.15) | (.14) | |
| Black · percentage Latine | .19 | .07 | .04 |
| (.52) | (.14) | (.14) | |
| Black · percentage White | .19 | .00 | .01 |
| (.54) | (.15) | (.13) | |
| White · percentage Asian | .01 | −.00 | −.01 |
| (.10) | (.07) | (.06) | |
| White · percentage Black | −.10 | −.03 | −.03 |
| (.12) | (.07) | (.06) | |
| White · percentage Latine | −.05 | −.05 | −.04 |
| (.09) | (.06) | (.05) | |
| White · percentage White | .09 | −.02 | −.00 |
| (.10) | (.07) | (.06) | |
| Distance (miles) | −4.46*** | −1.87*** | −1.12*** |
| (.79) | (.30) | (.17) | |
| Distance2 | 1.49*** | .23*** | .07*** |
| (.41) | (.05) | (.02) | |
| Neighborhood school | 3.34*** | 3.11*** | 3.15*** |
| (.35) | (.27) | (.26) | |
| Within district | 1.85** | 1.18*** | 1.04*** |
| (.82) | (.42) | (.30) | |
| Near family activity | .44 | .62** | .84*** |
| (.32) | (.27) | (.25) | |
| Neighborhood school · near family activity | −.34 | −.62** | −.65** |
| (.34) | (.30) | (.29) | |
| Observations (student-school dyads) | 5,680 | 29,595 | 95,607 |
| Students | 372 | 440 | 470 |
| R 2 | .18 | .07 | .03 |
| Maximum possible R2 | .26 | .11 | .05 |
Source: Los Angeles Family and Neighborhood Survey wave 1 (2000–2001) and wave 2 (2006–2008).
Note: API = Academic Performance Index; FRPM = free or reduced-price meals; SES = socioeconomic status.
p < .05, **p < .01, and ***p < .001 (two-tailed tests).
Acknowledgements
Thanks to Jackelyn Hwang, sean reardon, Aliya Saperstein, Iris Zhang, and Terresa Eun; participants of the MERN, Computational Sociology, Quantitative Education Policy, and Journal Article Writing Seminar workshops at Stanford University; participants at the 2020 American Sociological Association annual meeting; and anonymous reviewers for their helpful comments.
Funding
The author(s) disclosed receipt of the following financial support for the research, authorship, and/or publication of this article: This material is based upon work supported by the National Science Foundation Graduate Research Fellowship Program under Grant No. DGE-1656518 and the Institute of Education Sciences under Grant No. R305B140009.