
Abstract
Sociologists increasingly employ machine learning (ML) to quickly sort, code, classify, and analyze data. With known racial and gender biases in ML algorithms, we urge sociologists to (re)consider the implications of the widespread use of these technologies in our research. To illustrate this point, we use two popular ML algorithms, ClarifAI and Kairos, to code a small sample of sociologists (n = 167) and their coauthors (n = 1,664) and compare their findings to the sociologists’ hand-coded race and gender information. We further explore ML-generated differences by analyzing the extent of racial homophily in these sociologists’ collaboration networks. We find significant differences across the three coding methods that would lead to very different conclusions and future research agendas. We conclude by elaborating on how sociologists might ethically consider the role of ML and its use in the discipline.
With the widespread use of computers, the Internet, and the mass digitization of records, abundant digital data are available for researchers’ use. Given these large data sets, scholars are increasingly relying on computer-automated techniques, including machine learning (ML) systems, to extract information from these data that would otherwise be too time- and cost-prohibitive to explore manually (Chen et al. 2021; Karell, Freedman, and Gidron 2023; Lee et al. 2023). ML is found in automated text analysis, (un)supervised topic modeling, grouping of social network data, and more (DiMaggio, Nag, and Blei 2013; Karell et al. 2023; Molina and Garip 2019). Scholars use object image classification technologies to glean information from the connections between text and image (Chen et al. 2021; Karell et al. 2023; Zhang and Pan 2019). Moreover, these technologies and related methodological techniques are expanding as private companies, such as Amazon and Google, and governmental organizations, such as the National Science Foundation, have called for their further development (Nietzel n.d.; Ransbotham et al. 2019).
At the same time, a growing body of literature documents how ML and artificial intelligence (AI) more broadly deepen existing societal inequalities. Lenders who have used AI to generate decisions on pricing for home and refinance loans have been found to discriminate and overcharge borrowers of color, costing them approximately $765 million annually (Bartlett et al. 2022). Facial recognition software has been used to classify demographic data such as age, sex, gender, and race/ethnicity from photos, but they often underperform for historically marginalized groups (Buolamwini and Gebru 2018; Grother, Ngan, and Hanaoka 2019). Furthermore, facial recognition programs are heavily implemented in the criminal justice system, and the pernicious effects of these technologies, particularly on Black communities, have only begun to be explored (Yapo and Weiss 2018; Završnik 2020). Despite these failures, well-trained natural language processing models and object classification have had promising deployments in detecting depression from user-generated content and determining suicide risk (Bucur et al. 2023; Castillo-Sánchez et al. 2020); however, these approaches have not yet been tuned to accurately capture the social context of what is occurring in the images, making the data output incapable of adequately reflecting social reality (van Giffen, Herhausen, and Fahse 2022; Mehrabi et al. 2022). Although scholars have brought attention to the potential consequences of some of these technologies, it remains unclear how consideration of potential bias impacts their deployment in data classification and labeling (Chakraborty, Majumder, and Menzies 2021; Cryan et al. 2020).
We join other scholars to argue that further research is needed to uncover the relationship between ML and societal inequality (see Joyce et al. 2021). Given known racial and gender biases in ML, we suggest the impact of using these technologies to speed up analyses of digital data may cause more harm than good, particularly for historically marginalized populations. In this research article, we highlight some of the effects of using ML, specifically, facial recognition software, to classify demographic data and the resulting conclusions we would draw from that data. In this article, we compare findings from two popular facial recognition programs, ClarifAI and Kairos, to hand-coded demographic data on a small cohort of sociologists (n = 167) and their coauthors (n = 1,664). After documenting their initial differences, we next use the facial recognition programs’ results to examine the extent of racial homophily in the group’s collaboration networks. We use this illustrative example to discuss how existing ML could negatively affect underrepresented groups within higher education, specifically, and skew the state of sociological knowledge itself, more broadly. We conclude by elaborating on how sociologists might ethically consider the role of ML and its use in the discipline.
Machine Learning and Inequality
Although hailed for its relative neutrality and ability to quickly and efficiently sort and classify data, AI/ML is still influenced by the values, institutional practices, and inequalities of the society that creates them. Biases in ML are found in nearly every stage of their development, from their training on unrepresentative data sets to inadequate models and algorithmic designs (for reviews, see Mehrabi et al. 2022; van Giffen et al. 2022). These biases have proven difficult to remove (Chakraborty et al. 2021; Sun, Nasraoui, and Shafto 2020), leading to poor and unfair decision-making across multiple industries with particularly negative impacts on gender and racial minorities.
Racial discriminatory practices arise due to racist practices being recreated in algorithms and racist methods being introduced as a name of fairness (Benthall and Haynes 2019). The introduction of these practices causes the algorithms to inaccurately represent racial experiences in America due to the choices made in the selection of data (Benthall and Haynes 2019; Stinson 2022). Similarly, biases arise in data sorting, naming, and ordering (Leavy 2018). This is furthered by statistical error, which results in recreating racism due to the lack of data on some racial or minority groups, which can lead to poor estimations or predictions for the groups (Leavy 2018). Furthermore, some technology has been specifically designed to discriminate against racial minorities, perpetuating historical biases into algorithms. For example, algorithms have been designed to make racial minorities invisible to clash with their personal security and create false narratives about criminal offenses (Almeida, Shmarko, and Lamos 2022). Although different methods to reduce bias have been introduced, a perfect solution has yet to be found due to the complexity of the biases (Chakraborty et al. 2021).
Facial recognition programs replicate the same biases seen in other algorithms. Buolamwini and Gebru’s (2018) well-known work investigated three commercial facial recognition programs and found that darker-skinned females were 34.7 percent likely to be misclassified, whereas lighter-skinned males had only a 0.8 percent likelihood of misclassification. Moreover, there are legal implications for the significant differences in these programs’ accuracy. For example, facial recognition software has been used in police cameras and has been shown to be more likely to deem someone who is Black to be a criminal and recommend a longer sentence (Almeida et al. 2022). Although some protections exist in the United Kingdom and the European Union to protect the privacy of the individual, there are no protections for misclassified individuals in the United States (Almeida et al. 2022). Although there are possible legal ramifications of biases in algorithms and the faults of the companies under Title XI, currently, no company has yet been found liable for such biases (Barocas and Selbst 2016).
Bias in ML is often attributed to the fact that its developers are overwhelmingly White and Asian cisgender men. Unsurprisingly, the people who uncover bias in ML tend to be from underrepresented groups in the field, as many of the aforementioned examples show. This has increased calls for diversity in computational methods and computing more broadly. However, in 2021–2022, men accounted for 77.2 percent of bachelor’s degrees awarded in computing, and 79.3 percent were awarded to White and Asian students (Zweben and Bizot 2023); consequently, much work remains to be done to actively combat this disparity.
ML in (Some of) Sociology
Digital data and ML developments have led to an explosion of empirical social science research, leading to the quickly developing interdisciplinary field of computational social science (CSS). From using Google search data to understand how demographic factors contribute to anti-Muslim radicalization (Bail, Merhout, and Ding 2018) to using Meta (formerly Facebook) data to analyze the landscape of anti-vaccination sentiment (Hoffman et al. 2019), sociologists use CSS methods primarily to study how social relationships form and evolve in different contexts over time. However, CSS has also been used to build new sociological theories of human behavior. For example, Foster (2018) provided a guide for grounding new ideas of culture using computational methods that could better account for cultural learning. In sociology, CSS has primarily spread to the substantive subfields of cultural, political, and economic sociologies and the sociology of knowledge, social networks, and group formations (Edelmann et al. 2020). Although some ML has long been established in sociology, for example, principal component analysis, neural network analysis, and k-nearest neighbor algorithms, new ML and other computational methods have much more intricate internal mechanisms, making it difficult for users to comprehend why the algorithms make specific decisions (Molina and Garip 2019). Despite this, there is an increase in the employment of ML and other computational methods in the production of new sociological knowledge (Edelmann et al. 2020; Molina and Garip 2019).
Against this backdrop is a growing body of scholars calling for more critical sociological thinking on digital data and ML (Joyce et al. 2021). Sociology has long recognized that data about social life is neither neutral nor objective (Sharda, Dhara, and Alam 2021; Skiba et al. 2011). Still, the increased use of supposedly neutral data- and ML-driven analyses has moved the field further away from this perspective. Sociologists concerned with this shift have primarily concentrated their critiques in three areas: the data themselves, the analyses of the data, and the epistemological consequences of digital data and computational methods (for a review, see Leitgöb, Prandner, and Wolbring 2023). Because ML often cannot capture the social context in which the objects it identifies are found, sociologists employing such methods cannot adequately comment on the social environments or settings influencing the observations of interest (Bechmann 2017). This shift has profound implications for the depth of sociological knowledge because it moves the field closer to a simplistic naturalization of social patterns with a diminished role of hermeneutics (Krasmann 2020; Törnberg and Törnberg 2018).
Thus far, the sociological subfields of race and ethnicity, education, stratification and inequality, and sex and gender studies have primarily not engaged with ML and CSS methods. A lack of data access and appropriate training for sociologists in these fields has been offered as potential reasons for this nonengagement (Edelmann et al. 2020). However, these subfields are also the ones that have traditionally shunned the “value-neutral,” “objective,” or “scientific” approach to sociology. These critical sociologies are often more aligned with humanistic sociology, which wants to achieve social justice, and using partial, situated data has negatively affected historically marginalized groups in society.
For sociologists of race and racism, these technologies pose a further danger in the reification of race because they promote the conversion of abstract concepts of “racial differences” into racial classification without regard to the numerous (changing) ways race is conceptualized (Morning 2009; Zuberi 2001) or the link between its conceptualization and inequality in society (Saperstein and Penner 2012). For example, each facial recognition program uses its own fixed number of racial categories in which to classify individuals. Face++ uses three racial categories: White, Black, or Asian; ClarifAI currently uses seven: Middle Eastern, White, Black, Indian, Southeast Asian, East Asian, and Latino/Hispanic. Although race categories used in the United States vary nearly every census, the U.S. Office of Management and Budget (OMB) currently uses five race categories: American Indian or Alaska Native, Asian, Black or African American, Native Hawaiian or Other Pacific Islander, and White. How each group is measured in society is affected by and also affects the social construction of race and of group boundaries (Morning 2009; Omi and Winant 2014; Prewitt 2013). Thus, any racial classification is social, but the combined effect of the epistemic authority given to facial recognition programs and their reported “accurate” predictions of race given fixed racial categories furthers the notion that racial groups are biologically real. For critical sociologists, then, it will remain unlikely that these facial recognition programs and other ML technologies will be widely used in research until more developed theoretical frameworks and social scientific perspectives on these methods are developed.
Research Questions
The increased use of these technologies in classifying objects or groups leads to new sociological knowledge, which may be based on partial or inaccurate data. More research is needed to understand the implications of generating knowledge from these methods, particularly the sociological implications of the misclassification of groups. In this article, we aim to compare how two common facial recognition programs classify the race and gender information of a group of sociologists and their coauthors and how both compare to the authors’ hand-coding of that information. By comparing the differences, we aim to show the variability of the different methods and how these differences can impact the results and conclusions of sociological work. We further examine the consequences of these ML-assigned races and genders on the interpretation of the racial homophily of these sociologists’ collaboration networks. The aforementioned discussion led us to the following research questions:
Research Question 1: How do the race and gender classifications from ClarifAI and Kairos compare to the hand-coded classifications found by the authors?
Research Question 2: How do the ClarifAI and Kairos classifications alter the racial homophily of the collaboration networks of the cohort?
Research Question 3: What are the consequences of different specifications of race by coding type (hand-coded, ClarifAI, and Kairos) on the conclusions drawn from the sociologists’ collaboration networks?
Data and Methods
The data for this illustrative example are based on a cohort of historically underrepresented racial minorities in sociology (n = 171) who received their PhDs between 1995 and 2006. The curricula vitae of this cohort were downloaded from the Internet along with their pictures and the pictures of their coauthors when found. Furthermore, supplemental publication information was gathered from the Thomson Reuters Web of Science to obtain missing publications and information on the cohort’s coauthors’ publications and collaborators. The resulting data set includes 167 cohort members (four original members’ photos could not be located) and their 1,664 coauthors. Of the 1,664 coauthors, 96 (5.8 percent) photos could not be located, and their race and gender information were coded as “unknown.”
Importantly, these data comes from a previous study looking at race in the discipline, and the initial cohort was constructed to have only Black and Latinx sociologists (Spalter-Roth et al. 2019). Although a more representative starting sample (e.g., one that included Asian, American Indian, Native Hawaiian, and White sociologists) would further strengthen the results found in this study, we believe there is sufficient racial variability in the sample once the starting cohort’s coauthors are included to answer the questions of this study. Furthermore, because previous research has shown that facial recognition has worse accuracy rates for individuals with darker skin tones (Buolamwini and Gebru 2018), we believe that our starting cohort of Black and Latinx sociologists helped to ensure we had a large enough sample of sociologists of color in the data set to see any impacts these programs would have on subsequent conclusions drawn about these groups.
Determining Race and Gender of the Sample
First, each of the authors individually hand-coded the race and gender of the individuals in the data, drawing only on an individual’s appearance in their photograph. Individuals’ race labels came from the U.S. OMB’s five race categories: American Indian or Alaska Native, Asian, Black or African American, Native Hawaiian or Other Pacific Islander, and White, plus an additional Hispanic or Latino category. However, we did not identify anyone in the sample as Native Hawaiian or Other Pacific Islander, effectively making our racial categories for the hand-coded analysis to be comprised of five groups. Individuals’ gender labels came from binary gender categories: man and woman. Importantly, we were unable to determine if these classifications match the racial and gender identities of the sample themselves. We chose to code our sample solely based on what they look like (e.g., a composition of physical characteristics, including skin color, facial features, etc.), or their “street race” and “street gender” (López and Hogan 2021), to match the superficial nature of facial recognition software, which relies solely on images to draw conclusions. However, for convenience, we refer to these categories as individual’s race and gender, noting that these labels may not be representative of members’ actual identities. To find the interrater reliability of our coding scheme, we computed Cohen’s kappa for each coder-pair and report the average score for each (Light 1971). We had substantial agreement (K = 0.728) for the coding of members’ race information and near perfect agreement (K = 0.995) for the coding of members’ gender information. The results presented in this article are from the hand-coded classifications of the lead author.
Second, we used ClarifAI, a commercial facial recognition program, to classify the race of the individuals in the photos used in this study. In ClarifAI, the models for classifying age, race, and gender are separated to improve flexibility of the model’s use and to ensure that the models are consistently accurate regardless of other demographic features. Importantly, we chose only to use the race classification model from ClarifAI because this model has recently undergone extensive training data revisions specifically designed to decrease race bias (Toffoli 2020), whereas their model to classify gender has no similar claims of revision and seems to remain based on training data that were annotated by only three human coders (Metz 2019). Although ClarifAI does not post any claims to the accuracy rates of its program, ClarifAI does boast that its new demographics model is “substantially more accurate” (Toffoli 2020).
Third, we used Kairos, another common facial recognition program that boasts a 99.63 percent accuracy rate in identifying the race and gender of photos (Virdee-Chapman n.d.), to determine the race and gender of study members. Unlike ClarifAI, Kairos predicts gender and race in the same model. For each face in a photo, a template of the face is created and compared with preexisting templates in the data set to predict their demographic outcomes (Virdee-Chapman n.d.). We chose to use both the gender and race information from Kairos because previous studies have found their models to be highly accurate (Jaeger, Sleegers, and Evans 2020).
Furthermore, ClarifAI is trained on seven racial groups for their analyses (Middle Eastern, White, Black, Indian, Southeast Asian, East Asian, and Latino/Hispanic), whereas Kairos was trained on four racial categories (White, Black, Asian, and Hispanic). Because of the limited racial categories of Kairos, we recoded the ClarifAI racial categories into the four Kairos categories. ClarifAI’s categories were collapsed as follows: Indian, Southeast Asian, and East Asian were collapsed into the Asian category; Middle Eastern and White were collapsed into the White category; and the remaining classifications stayed the same. These categories were collapsed into new categories based on current official U.S. understandings of racial classification. When collapsing into new categories, we added any prediction values to the new category. For example, if ClarifAI was 43 percent certain an individual was Indian and 23 percent certain an individual was East Asian, that individual was recoded as 66 percent certain to be Asian. Importantly, neither ClarifAI nor Kairos had racial classifications for American Indian and Alaska Native persons or Native Hawaiian and Other Pacific Islander persons, so anyone in our data set we identified as such would automatically not match the classification in ClarifAI or Kairos. We chose to keep the hand-coded classifications of the six American Indian authors in our sample despite ClarifAI and Kairos missing this category because to do otherwise would further contribute to these groups’ relative invisibility and representation in research. Although this decision meant we used five racial categories from the hand-coding process and only four racial categories from the ML processes, we argue this difference (6 out of 1,831 total members of the sample) does not greatly affect the substantive findings of this article and further reinforces our argument that racial conceptualization is a changing social process that ML software cannot adequately capture.
Finally, we used the threshold of 60 percent to determine the race and gender of each person. That is, if the software was at least 60 percent confident the person was a certain race or gender, we labeled them with that race or gender. Sixty percent was used because it is the most commonly recommended threshold (Chiu et al. 2015). If the facial recognition program did not have at least 60 percent confidence in a race or gender category, that individual was coded as “unknown” in the analyses that follow.
Ego Network Construction
To understand potential consequences of different demographic classifications based on coding type, we constructed ego networks for each of the 167 sociologists in our initial cohort. Ego networks consist of a focal node, called an “ego”; the nodes to whom the ego is directly connected, called “alters”; and any connections among the alters that exclude the ego. Here, the 167 sociologists in our initial cohort are our egos, and their coauthors are our alters. We construct ego collaboration networks by assigning an edge between an ego and their alter if they published at least one work together. Then, we used these networks to explore racial homophily in the networks across the three methods of coding. Network homophily is a measure of an individual’s preference for ties with people the same as or different from themselves on some variables of interest (e.g., race or gender). Homophily is calculated using the EI index where –1 means complete homophily, the individual only has collaborations with people of the same type as them, and 1 means complete heterophily, the individual only has collaborations with people of a different type than them (Perry, Pescosolido, and Borgatti 2018).
Findings
The original 167 sociologists in this data set were first hand-coded for race and gender by the lead author. Based on these results, the original cohort comprised 104 (62.3 percent) Black sociologists and 63 (37.7 percent) Latinx sociologists. By gender, the cohort consisted of 100 (59.9 percent) women sociologists and 67 (40.1 percent) men sociologists. The coauthor data set consisted of 119 (7.2 percent) Asian/Asian American members, 302 (18.1 percent) Black members, 201 (12.1 percent) Latinx members, 6 (0.4 percent) Native American/American Indian members, 940 (56.5 percent) White members, and 96 members (5.8 percent) of undetermined race. By gender, the cohort was coded to contain 862 (51.8 percent) women sociologists, 706 (42.4 percent) men sociologists, and 96 (5.8 percent) sociologists of undetermined gender. These figures are considered our baseline and are used to compare the results of ClarifAI and Kairos. Because the races and genders of the sociologists and their coauthors are not known, we use the hand-coding based on street race and gender as a baseline to show the variability in the facial recognition applications.
Although every image yielded results on the category an individual could belong to, only those with a 60 percent threshold were used to convey certainty in the classification of an individual’s identity. According to ClarifAI, the ego sample was composed of 35 (21.0 percent) Asian sociologists, 32 (19.2 percent) Black sociologists, 1 (0.6 percent) Latinx sociologist, and 20 (12.0 percent) White sociologists, and the program was unable to classify 79 (47.3 percent) members of the ego sample. ClarifAI labeled the 1,568 coauthors with photos as follows: 307 (19.6 percent) Asian, 99 (6.3 percent) Black, 9 (0.6 percent) Latinx, 353 (22.5 percent) White individuals; it was unable to classify 800 individuals. Most of these classifications were different from the hand-coded data. ClarifAI’s overall discrepancy rate was 73.9 percent (1,283 out of 1,735 possible matches). Not surprisingly, there are significant differences in the overall racial distribution of authors provided by ClarifAI compared to the distribution given from the hand-coding process (see Figure 1). The ClarifAI gender model was not run for these analyses, so there are no gender comparisons to make between ClarifAI and the hand-coded data.
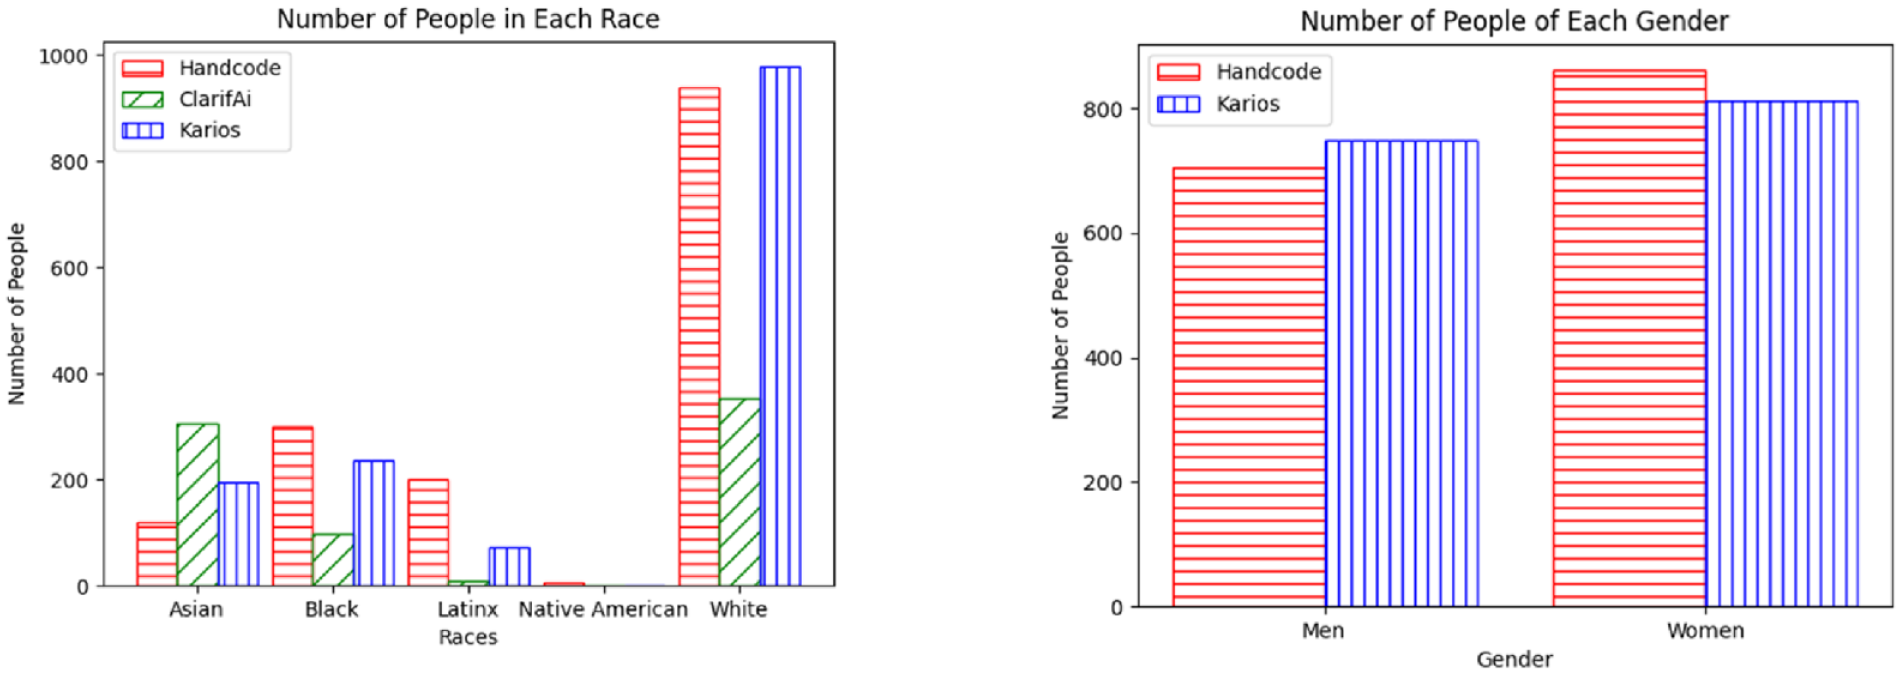
Distributions of race and gender groups by coding type.
From the original dataset of 167 sociologists, Kairos classified 74 (44.3 percent) as men and 93 (55.7 percent) as women. It classified 23 (14.6 percent) as Asian, 71 (42.5 percent) as Black, 24 (14.4 percent) as Latinx, and 39 (23.4 percent) as White and was unable to classify 10 (6.0 percent). For the 1,568 coauthors with photos, it classified 749 (47.8 percent) as men and 812 (51.8 percent) as women and was unable to classify 103 (6.6 percent). For the races of these coauthors, it classified 194 (12.4 percent) as Asian, 237 (15.1 percent) as Black, 73 (4.7 percent) as Latinx, and 978 (62.4 percent) as White and was unable to classify 182 (11.6 percent) people. As shown in Figure 1, there were significant differences in the classification of race between Kairos and the hand-coding process but no significant differences in the classification of gender; therefore, we focus our remaining analyses on racial group differences caused by the method of classification.
As shown in Table 1, both ClarifAI and Kairos produced large differences in scholars’ race information. For the original 167 cohort members, ClarifAI classified 74 (71.2 percent) of the hand-coded Black sociologists as a different race and all 63 (100 percent) of the hand-coded Latinx sociologists as a different race. Kairos performed marginally better than ClarifAI, classifying only 36 (34.6 percent) hand-coded Black sociologists and 49 (72.1 percent) hand-coded Latinx sociologists differently than their hand-coded race. However, both facial recognition programs classified over 50% of the starting sample’s race information as a different race than originally hand-coded. ClarifAI and Kairos had much smaller difference rates when classifying the races of the alters in this study. For this group, the error rate for ClarifAI was 71.2 percent, and for Kairos, it was 26.3 percent. ClarifAI classified 70 (58.8 percent) Asian coauthors, 235 (77.8 percent) Black coauthors, 198 (98.5 percent) Latinx coauthors, 6 (100 percent) Native American/American Indian coauthors, and 637 (67.8 percent) White coauthors as a different race. Kairos, again, performed closer to the hand-coding than ClarifAI but still classified 26 (21.8 percent) Asian coauthors, 99 (32.8 percent) Black coauthors, 173 (86.1 percent) Latinx coauthors, 6 (100 percent) Native American/American Indian coauthors, and 133 (14.1 percent) White coauthors differently. From this, Kairos appears to be more similar to the hand-coding method of classification than ClarifAI, having smaller difference rates in both the ego and the alter data.
Differences in Egos’ and Alters’ Hand-Coded Race and Gender by ClarifAI and Kairos.
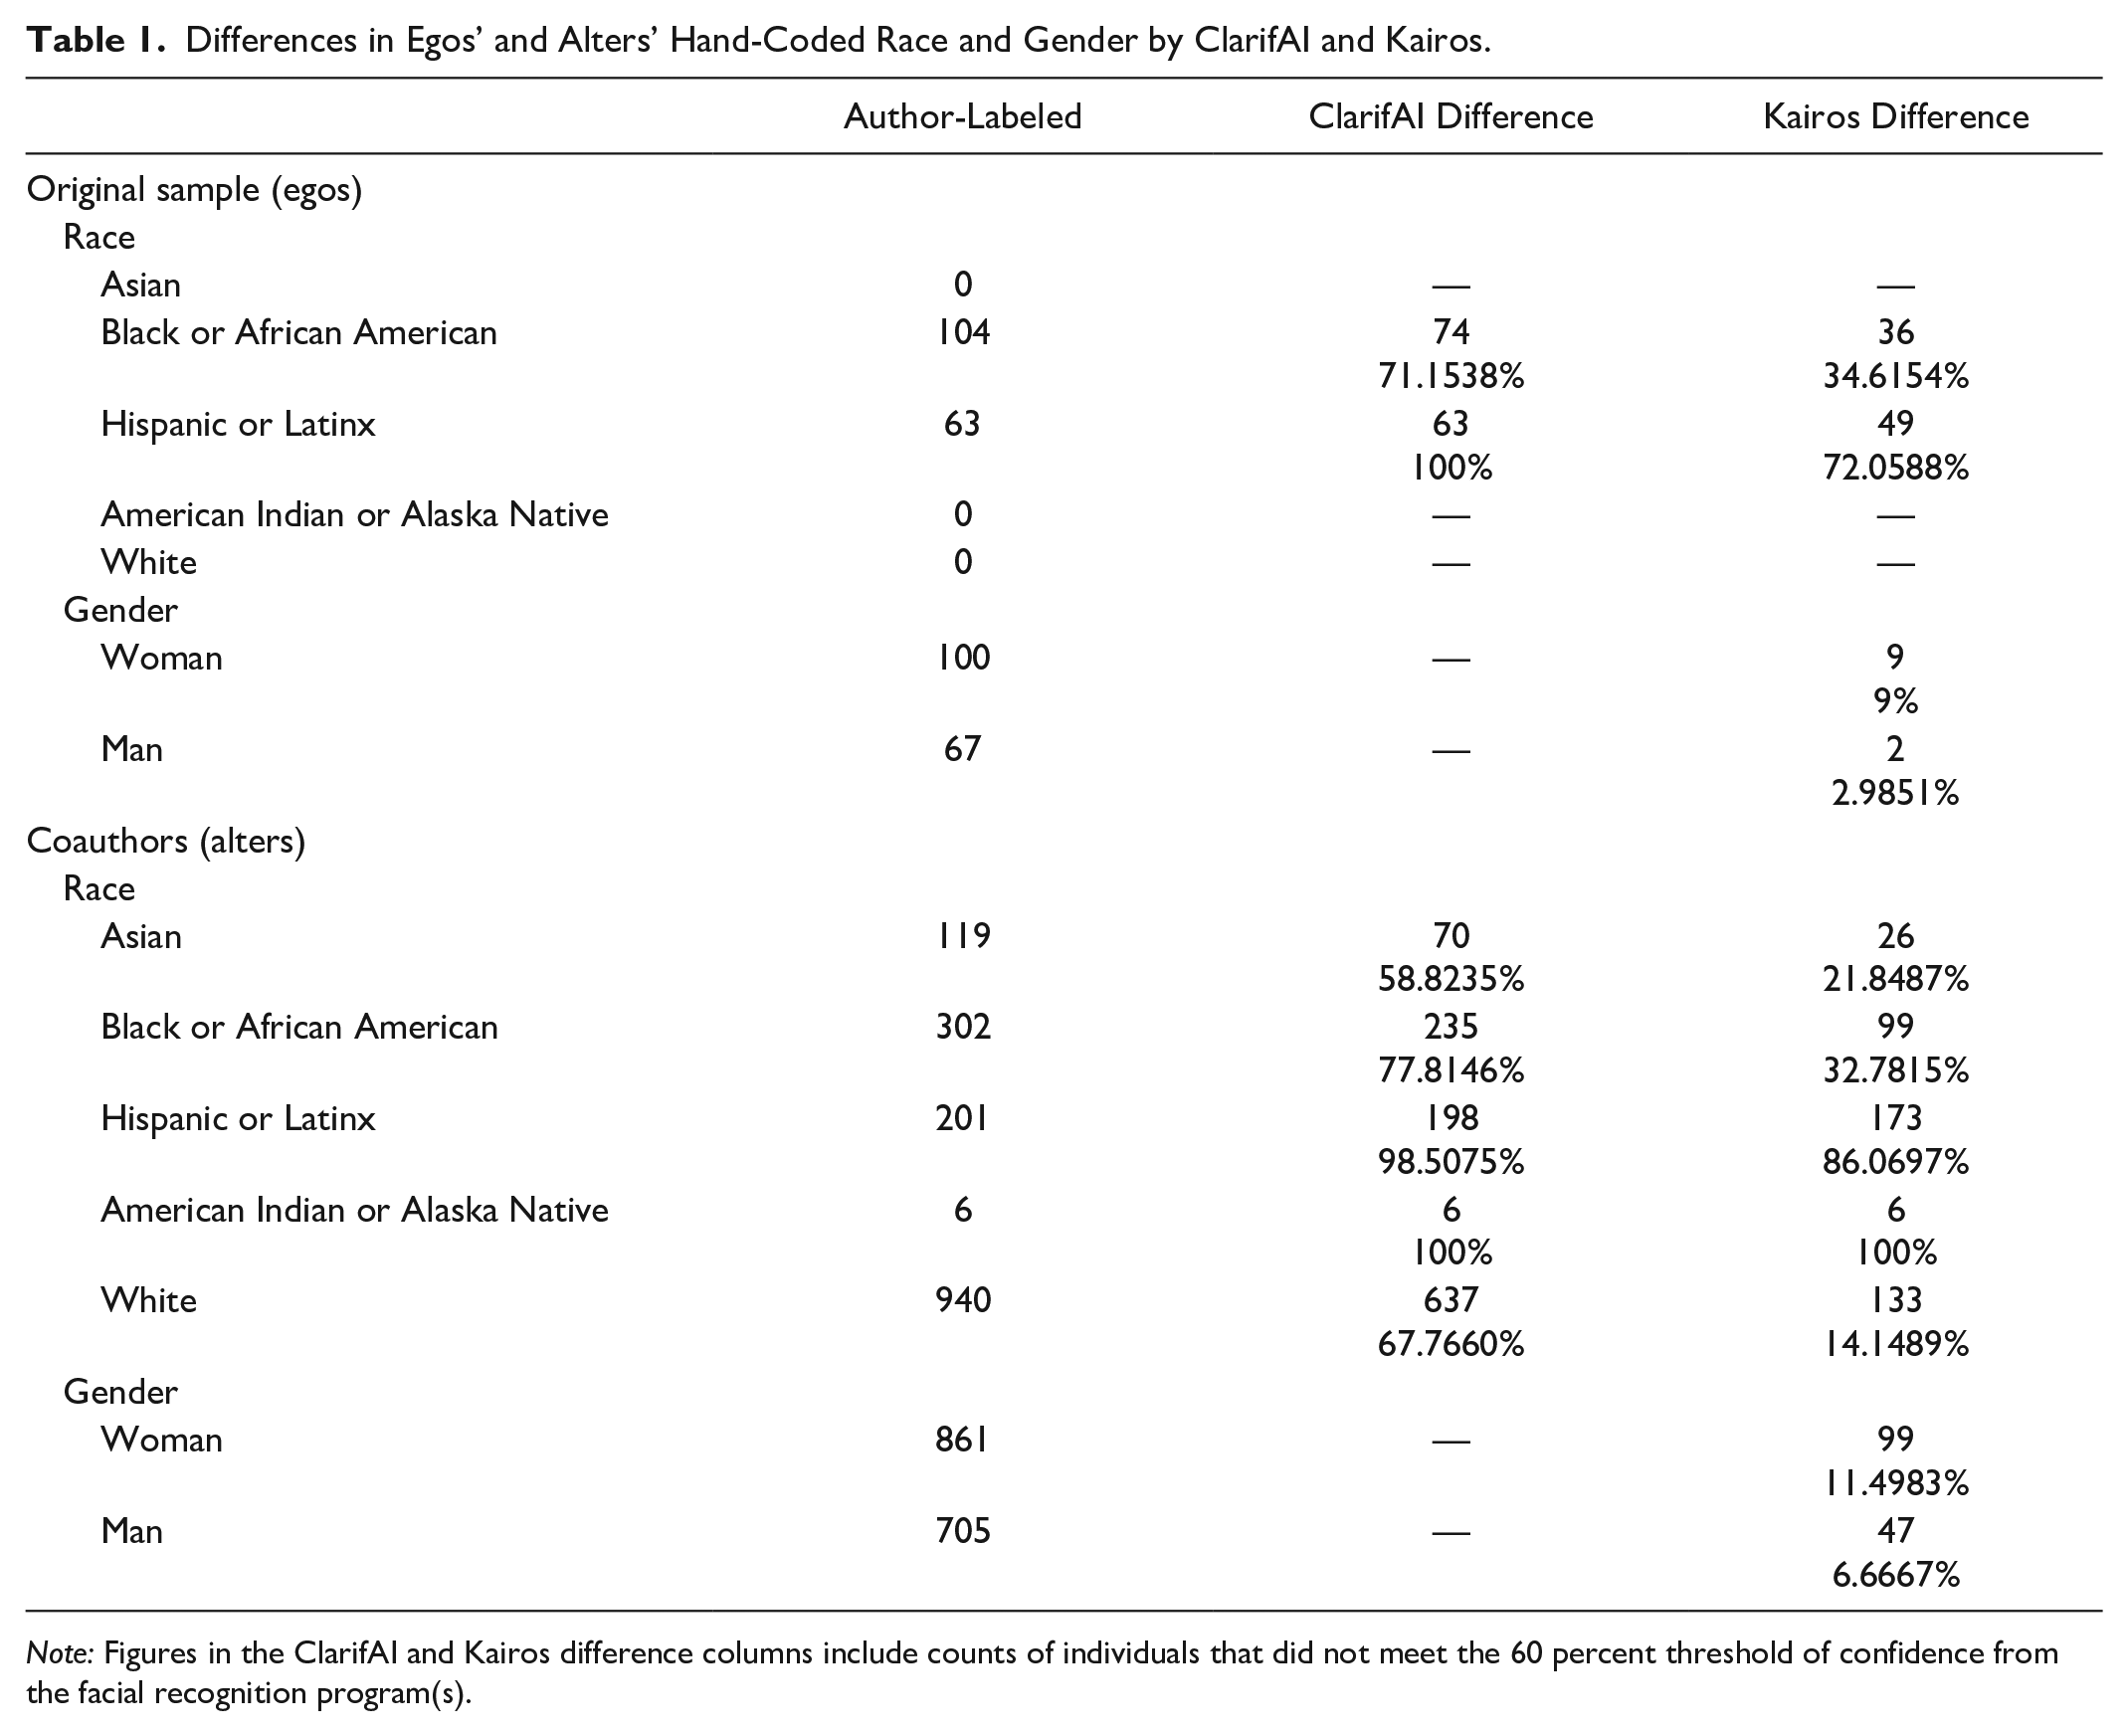
Note: Figures in the ClarifAI and Kairos difference columns include counts of individuals that did not meet the 60 percent threshold of confidence from the facial recognition program(s).
Importantly, ClarifAI was unable to classify 47 percent of individuals in the sample, and Kairos unable to classify 6 percent of them. For these individuals, we cannot draw conclusions about their identities using the facial recognition programs. Unlike hand-coding, where researchers can choose a category and discuss and find consensus with their colleagues on a label, facial recognition programs can only offer confidence levels on their fixed racial categories. When models with higher rates of nonclassification are used, like ClarifAI with these data, either there will be many unclassified people in the data sets, likely leading to missing cases, or researchers will have to hand-code the remaining subjects, introducing different coding schemes and bias. Facial recognition software with lower rates of nonclassification, like Kairos with these data, may be preferable for sociologists’ use. However, Kairos also has fewer racial categories for classification. If facial recognition is used in sociological studies, the categories for classification available, the threshold of classification, the rate of nonclassification, and the methods for handling nonclassified individuals must be considered to best meet the needs of the research questions.
These findings also suggest what comprises the data that are input to the facial recognition software substantially impacts their difference rates. In these data, the dramatic decline in discrepancy rates is explained by the different populations that comprise the ego data and the alter data. The ego data is solely composed of Black and Latinx sociologists, whereas the alter data is primarily comprised of Asian and White scholars. Both ClarifAI and Kairos had the lowest difference rates for these Asian and White individuals, supporting existing literature on bias in facial recognition technology (Buolamwini and Gebru 2018; Grother et al. 2019). The worst difference rates, in order, were found for Black, Latinx, and Native American/American Indian people. Furthermore, both facial recognition programs failed to identify any of the Native American/American Indian individuals in the sample. The large difference rates for Latinx and Native American/American Indian scholars are particularly noteworthy because both are considered racial and ethnic categories today. There are ongoing debates on how to appropriately measure the Latinx population (López 2013; López and Hogan 2021; Shiao 2023) and the Native American/American Indian population (Liebler 2018; Rodriguez-Lonebear 2021). Because neither ClarifAI nor Kairos were able to capture these populations in their models at similar rates to the authors, we argue this is another indication of how human bias in race conceptualization gets coded into ML.
Next, we used the race and gender information from our hand-coded data, ClarifAI, and Kairos to study the collaboration networks of the 167 egos from this data. We found significant differences in the racial homophily scores by coding type (see Figure 2). Further testing indicated that the significantly different pairs were between the hand-coded data and ClarifAI and Kairos and ClarifAI. Figure 3 shows three examples of ego networks labeled with race and gender information according to each coding type. These networks were chosen to highlight the differences that were introduced using the different facial recognition programs. In the first example, none of the three classification types agree on this person’s race, so this sociologist and their network information would be included in different racial groups when their networks are compared. In the second example, ClarifAI and Kairos agree on this sociologist’s racial classification; however, they differ from the hand-coded classification. Furthermore, when using the Kairos classification, this sociologist has a very homophilous-looking network (17 same-race collaborators), but when using ClarifAI, they only have 9 same-race collaborators. For the third sociologist, all three classification types agree on this person’s race, and both the hand-coded data and Kairos data agree on this person’s gender. So, we would conclude that the first sociologist is a Black woman with 11 coauthors. However, we can easily visualize that her racial homophily score changes notably by observing her alters’ changes. Our ego either has six same-race collaborators (hand-coded), five same-race collaborators (Kairos), or just two same-race collaborators (ClarifAI). All three examples highlight how the facial recognition programs’ classifications would lead to different conclusions about the state of cross-racial collaborators for each sociologist studied.
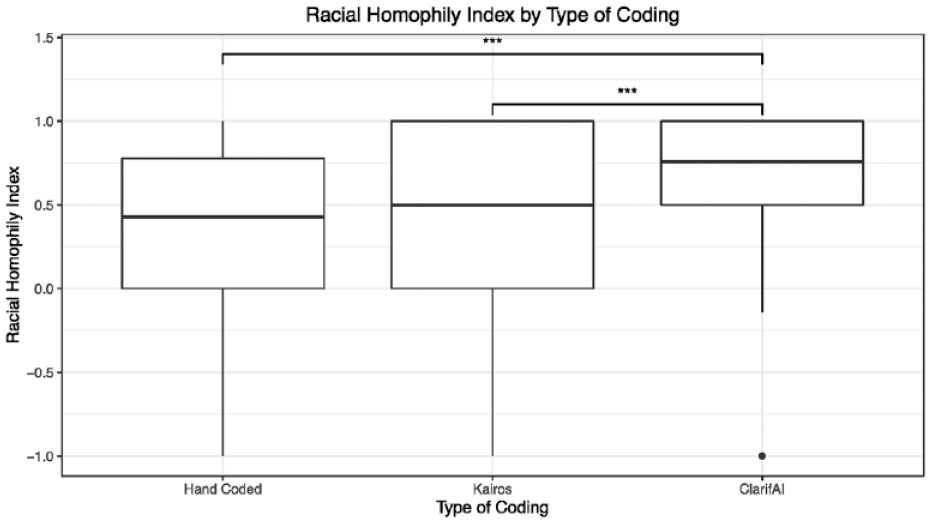
Racial homophily index by coding type.
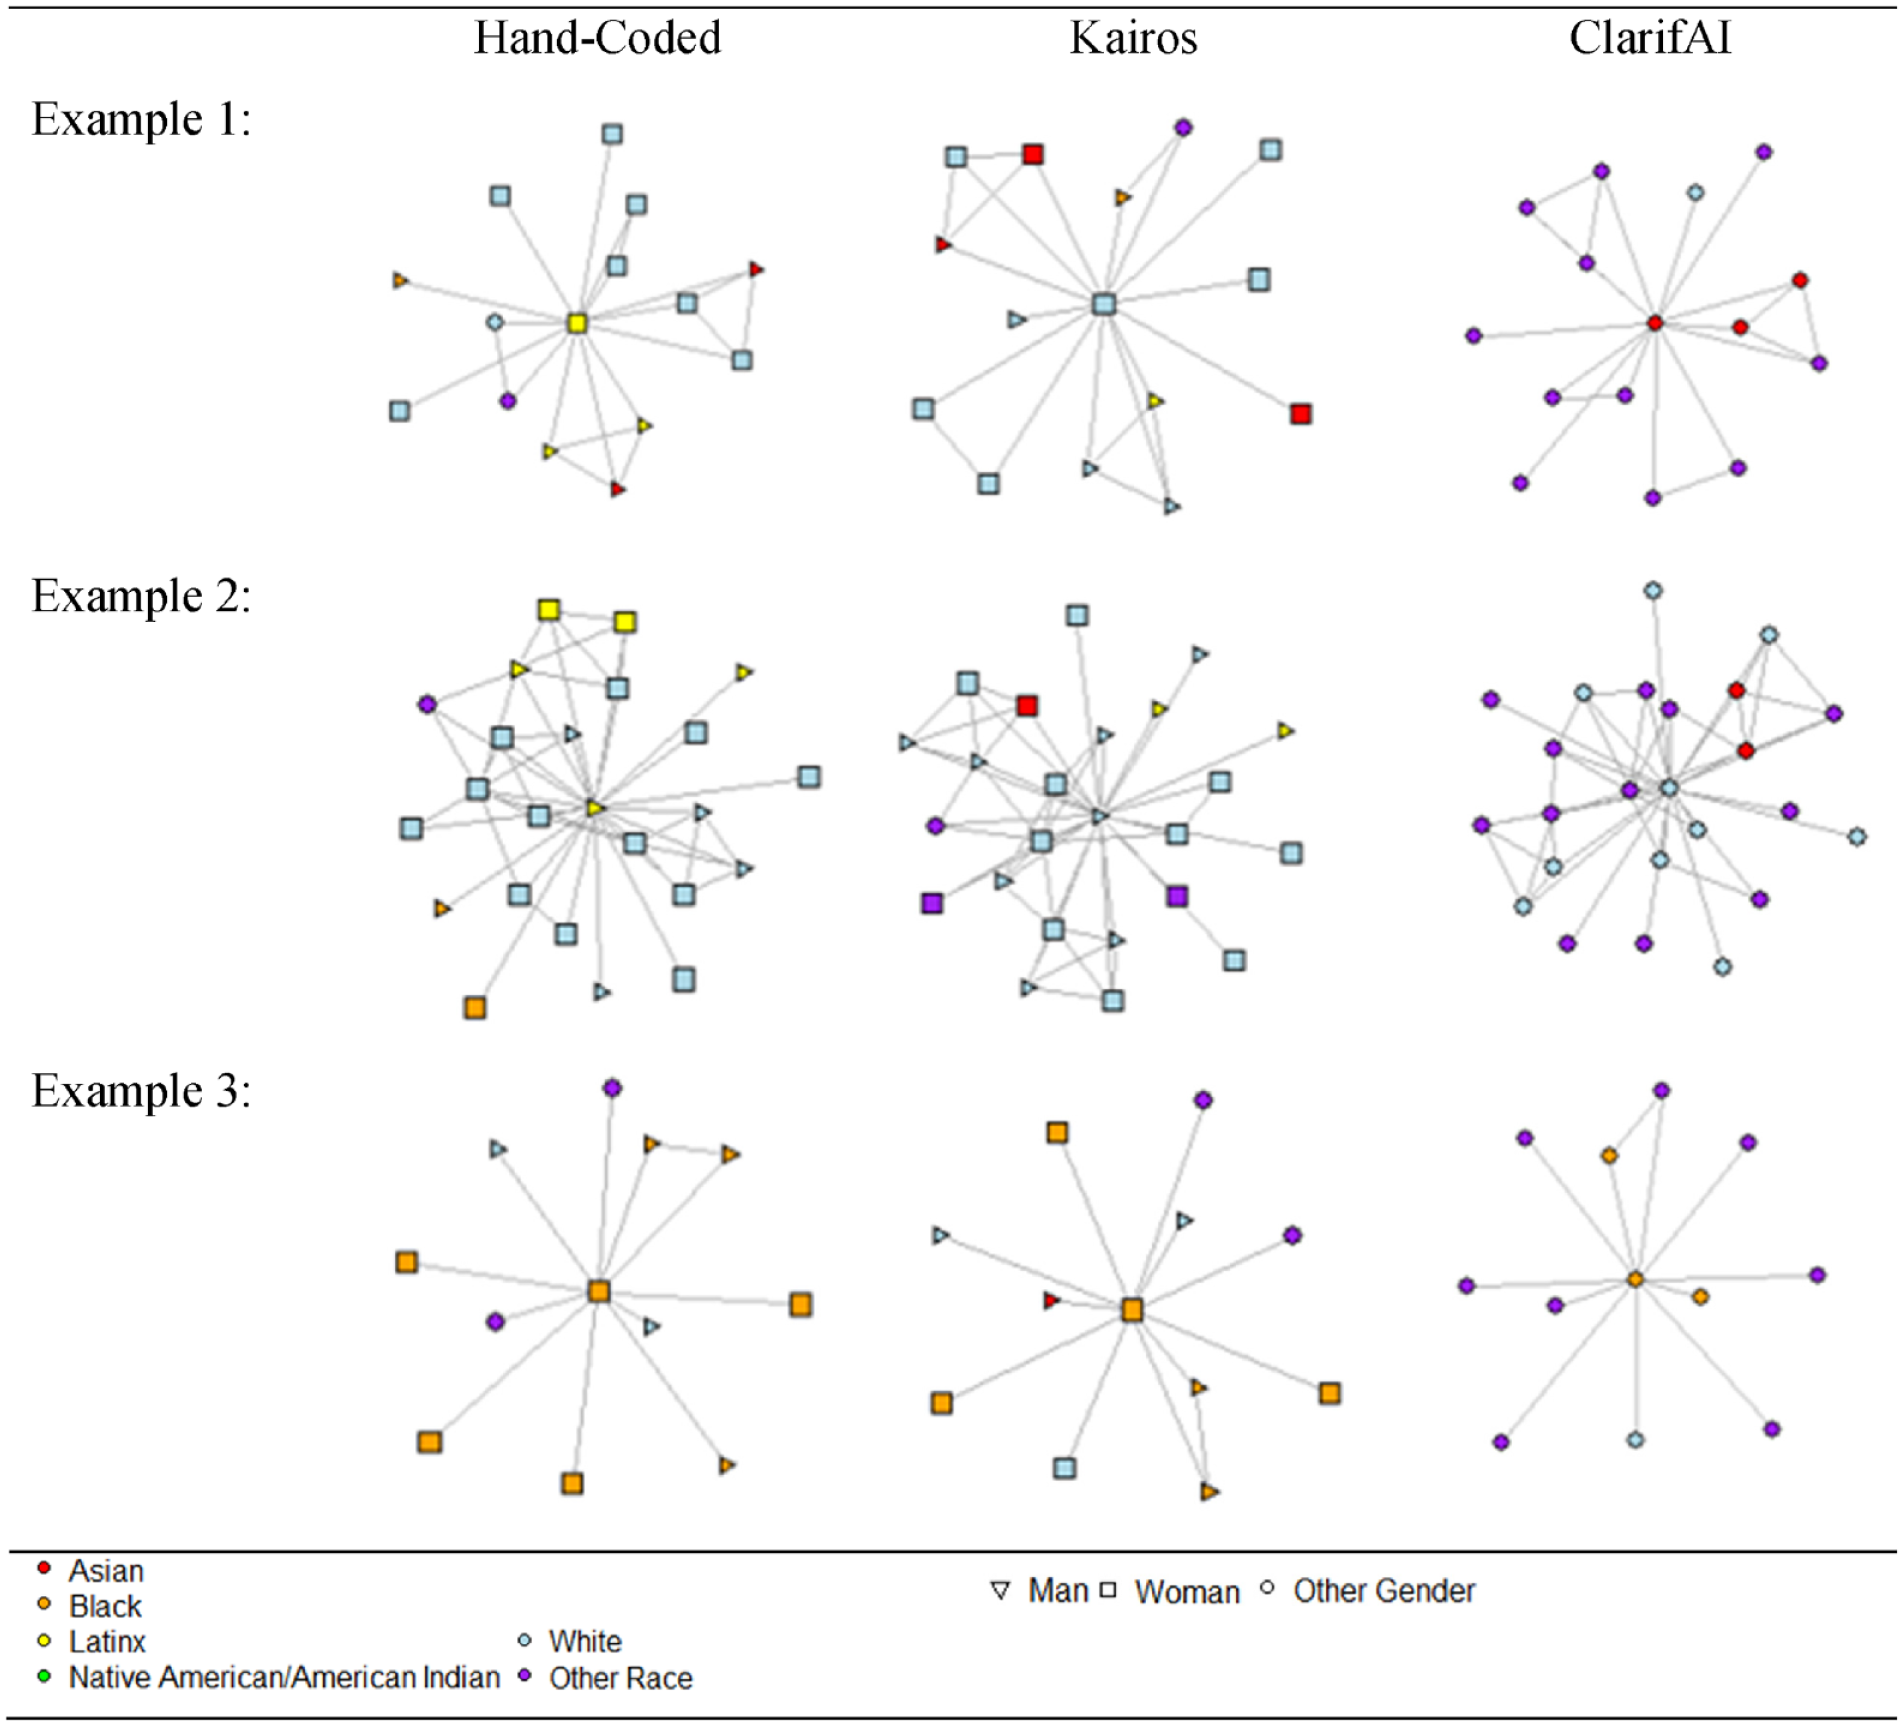
Example ego networks by coding type.
Table 2 shows the results of the racial and gender homophily by racial group for each coding type. Based on the hand-coded data, the ego networks are comprised of only two racial groups: Black and Latinx sociologists. Here, we find that both Black and Latinx sociologists tend toward racial heterophily (p < .001) in their collaboration networks. This finding is contrary to what we would expect given the well-known phenomena of racial homophily across a multitude of networks (for a review, see McPherson, Smith-Lovin, and Cook 2001). However, there are no significant differences between Black and Latinx sociologists in their average racial homophily index (p = .12). From these findings, we would conclude that both Black and Latinx sociologists similarly collaborate with racially diverse groups of scholars in their publishing. However, we draw different conclusions when the data are recoded to the classifications assigned by ClarifAI and Kairos.
Racial Homophily by Racial Group for each Coding Type.
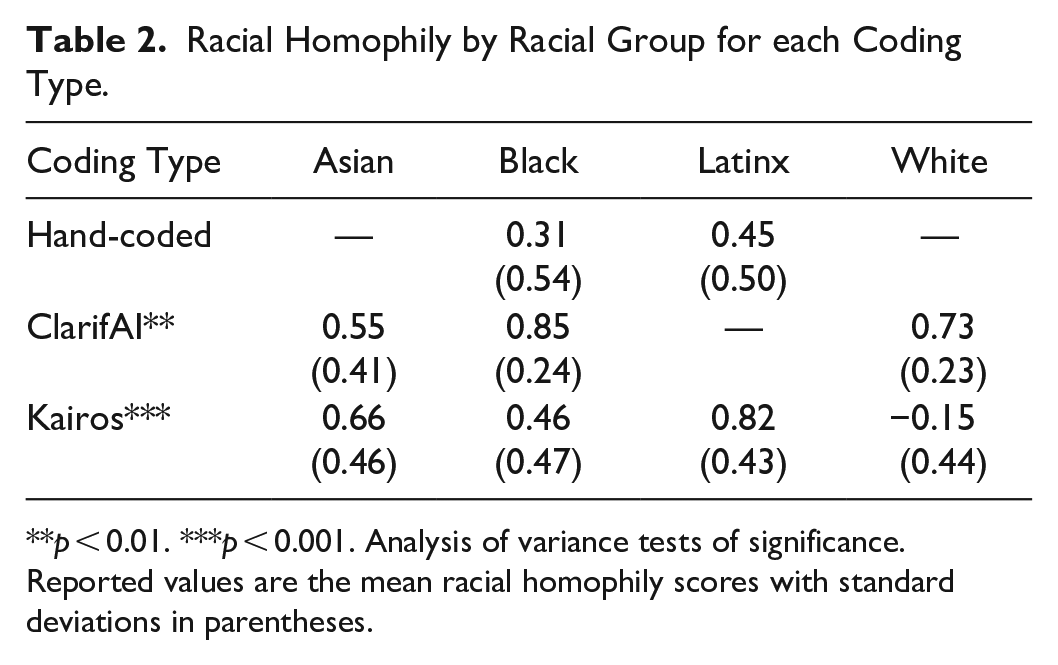
p < 0.01. ***p < 0.001. Analysis of variance tests of significance. Reported values are the mean racial homophily scores with standard deviations in parentheses.
For ClarifAI, there are four racial groups to consider in the ego networks: Asian, Black, Latinx, and White sociologists. However, ClarifAI only identified one Latinx sociologist as being among the egos. Because this was not enough for statistical analyses, this person was dropped from the following discussion. Using the ClarifAI classifications of race, Asian, Black, and White sociologists are all significantly (p < .001) racially heterophilous in their collaboration networks. This finding closely matches what was found in the hand-coded data, yet the racial groups being considered are different. In the prior analyses, we might be led to think that the high rates of racial heterophily in the Black and Latinx sociologists’ networks are due to their low numbers in the academy and, therefore, fewer opportunities to collaborate with others of their same race. However, the ClarifAI data show that Asian and White scholars also tend toward racial heterophily, groups that are not historically underrepresented in higher education. Therefore, the ClarifAI data might lead us to conclude that racial heterophily is the norm in sociologists’ academic publishing. Thus, the high difference rate from ClarifAI would lead to mistaken conclusions about the state of cross-racial collaboration in sociology and likely influence future work in an unproductive direction.
Moreover, using the ClarifAI classifications, we found significant differences (p < .01) in the average racial homophily of the collaboration networks of Asian, Black, and White sociologists. This is, again, contrary to the findings from the hand-coded data. Tukey post hoc tests (see Figure 4) indicated the significantly different pairs of groups are really between Asian and Black sociologists in their collaboration networks. There are no significant differences between Asian and White sociologists or between White and Black sociologists. With these data, we find that Black sociologists have higher rates of cross-racial collaborators than do Asian sociologists. Given the lack of research on race and collaboration patterns in sociology, we might suggest that more research is needed to determine the cases for which this pattern holds. Furthermore, we might develop our own explanation for why there are racial differences between Asian and Black sociologists in their average racial homophily scores. And so, the differences between these groups (generated by ClarifAI) would have important implications on the next steps we and other researchers interested in this topic might take.
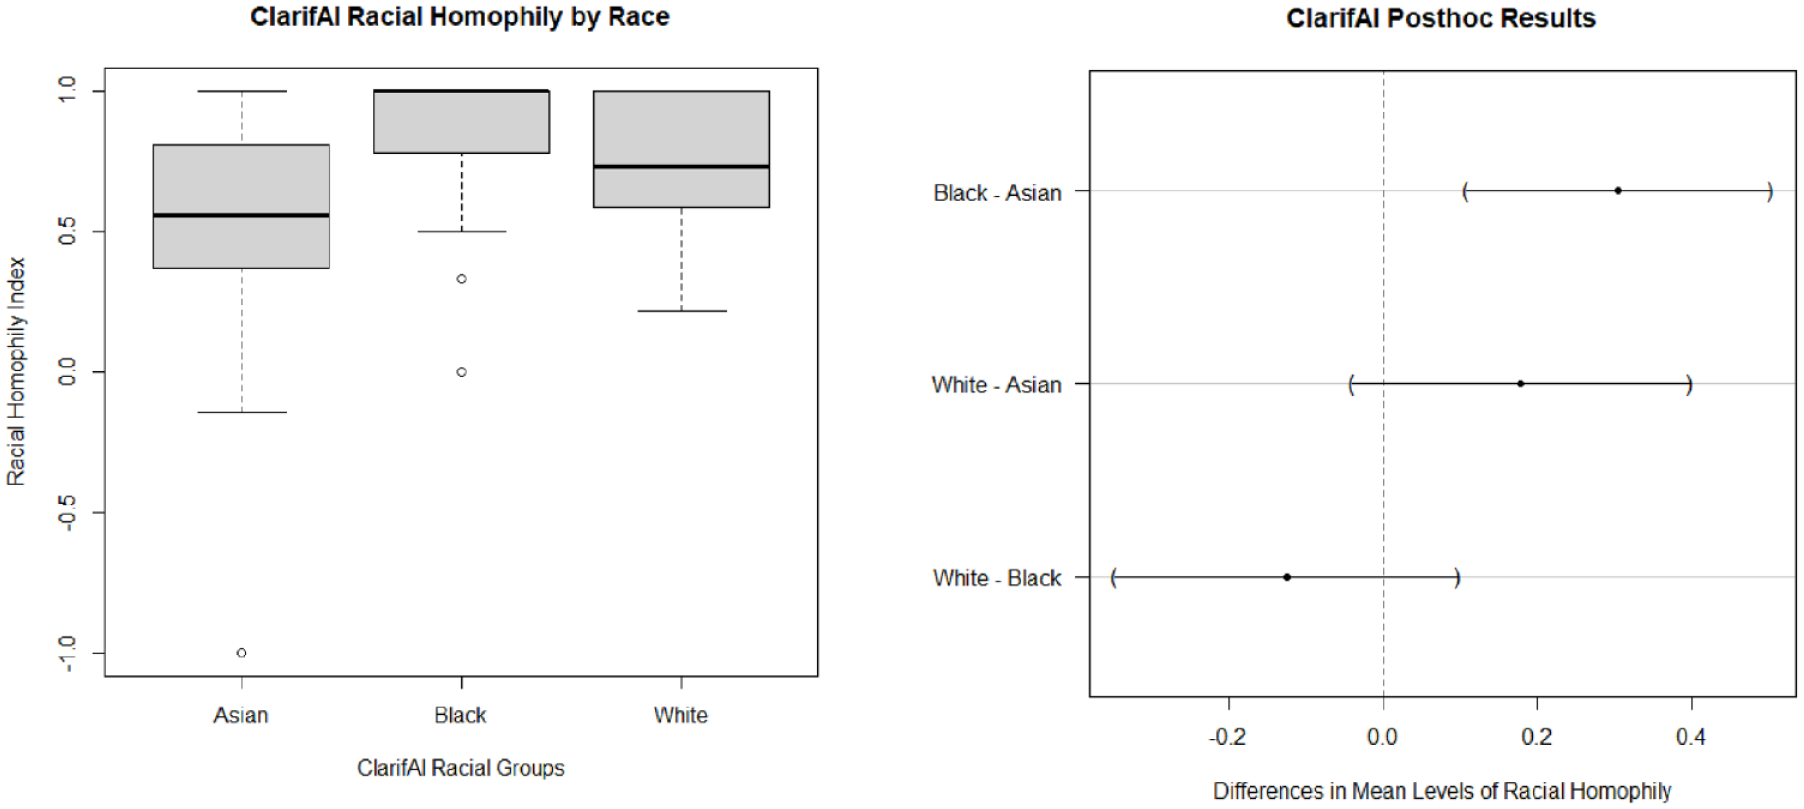
ClarifAI racial group differences in racial homophily.
Kairos also identified four racial groups among the ego data: Asian, Black, Latinx, and White sociologists. Using Kairos classifications, Asian, Black, and Latinx sociologists are significantly (p < .001) racially heterophilous in their collaboration networks. However, White sociologists, with an average homophily index score of −0.15, are significantly racially homophilous (p < .05). From the Kairos classifications, we would conclude that sociologists of color tend to collaborate with more racially diverse groups of scholars in their publications, whereas White sociologists tend to collaborate with other White sociologists. Furthermore, analysis of variance testing revealed significant differences (p < .001) between racial groups on the extent of racial homophily in their collaboration networks. For Kairos, all racial group pairings were sufficiently different from one another except Asian and Latinx sociologists and Asian and Black sociologists (see Figure 5). These conclusions are, again, different from the conclusions drawn from the hand-coded and ClarifAI data and would lead to different future work. Here, we might conclude similarly as we did with the hand-coded data—that sociologists of color tend toward racial heterophily in their collaboration networks because of their smaller numbers in higher education. However, the additional information—that White sociologists tend to publish with other White sociologists—could change that interpretation. Instead, we might rely more heavily on the literature of racial microaggressions in the academy to contextualize our results. Research has found that faculty of color often do not feel safe in academic environments and report higher levels of alienation, marginalization, and even exclusion from their White colleagues (Muhs et al. 2012; Rockquemore and Laszloffy 2008; Stanley 2006; Turner, Myers, and Creswell 1999). Thus, the additional information provided from the Kairos classifications would impact the conclusions drawn from this research.

Kairos racial group differences in racial homophily.
In sum, we found vastly different results about the race of our cohort of sociologists and their collaborators depending on the facial recognition program used. Both ClarifAI and Kairos performed remarkably poorly when identifying Latinx and Native American/American Indian individuals. When the racial (mis)classifications of ClarifAI and Kairos were used in our ego’s collaboration networks, we made different conclusions about the state of racial homophily and collaboration in sociology than we would have made using the hand-coded classifications. These findings suggest that commercial facial recognition programs, as one type of ML, are not ready for deployment in sociological research because their error rates, particularly for historically marginalized groups, can negatively influence the conclusions drawn related to racial group differences.
Limitations
There are several limitations to this study. First, there were only a small number (n = 167) of ego networks studied, and these networks, comprised solely of Black and Latinx sociologists from a certain time frame, are not representative of sociologists as a whole. These data were chosen for convenience; however, we did not attempt to make any definitive claims about the state of racial homophily in the collaboration networks of sociologists in this article. This article’s focus was to understand how facial recognition programs, a type of ML, can and do misclassify demographic information in ways that impact our findings and lead to vastly different sociological conclusions. A related limitation is that when ClarifAI and Kairos further broke these two groups into more racial categories, the resulting number of persons in each group made for small n comparisons. To strengthen the claims found in this article, future work should use a larger sample to promote the robustness of these findings. Finally, although there was substantial agreement between the authors on their individual codes for the race of the sample, there was also some variance. Future work could explore any additional differences found by using different human coders.
Another limitation of this analysis is the photos themselves. For our purposes, we used photos of the highest quality (e.g., lighting, subject as the main object, minimal background) when possible, but there is a large variance in the photos we were able to obtain. Which photos were used and how they were manipulated can have massive impacts on the accuracy and confidence of the facial recognition programs. For both ClarifAI and Kairos, a single model was used to analyze the images. For greater accuracy of identification, multimodal models could be used to compare the results from all the models to find the average result. Future research could compare the findings from the use of a single model and multimodels.
For uniformity, the same images were provided to both programs. However, the opacity of the facial recognition software leaves many questions unanswered on what is being measured. Both ClarifAI and Kairos claim the “best results” are achieved with images above a certain size, but they do not specify if that applies to the area the face takes up or the image overall. Furthermore, ClarifAI claimed to have the greatest accuracy when images were cropped (“Ethnicity-Demographics-Recognition” n.d.); however, it provided no specific information on how images should be cropped to attain that maximized accuracy. This was not an issue for the Kairos classification because they make a template of the face in the program and compare it to the other templates made from the training data. Kairos claims low accuracy, meaning fewer pixels in the image, makes it more difficult to make a template; however, they maintain that their algorithm “can compensate” for low lighting or a bad photo (Virdee-Chapman n.d.). Documentation on the best conditions for analysis is sparse and dependent on a wide array of factors, including lighting, filters used, cropping, and even clothing and hair styles. This makes it difficult to understand how and why certain results are generated. Future research could focus on classifier accuracy when elements of photos are changed, such as cropping or lighting.
Conclusion
In this article, we aimed to open the conversation on the relationship between ML and inequality in sociology, broadly, and the production of sociological knowledge, specifically. To do this, we explored two commercial facial recognition programs that tout their ability to accurately identify a person’s race and gender identity from a photo and compared their results to our hand-coded information. Kairos did not have significantly different distributions of men and women in their classifications than the hand-coded data; therefore, we focused our analyses on racial group differences. Our analyses show that both ClarifAI and Kairos classify the race of subjects differently than hand-coding at notably high rates, 73.9 percent and 30.1 percent, respectively. Both ML programs had the most differences from the hand-coded information for Black, Latinx, and Native American/American Indian individuals.
Moreover, we explored how the different classifications of racial groups could further impact sociological research by exploring the ML-generated differences in racial homophily in sociologists’ collaboration networks. Using the hand-coded data, we found Black and Latinx sociologists are significantly racially heterophilous in their collaboration networks but are not significantly different from each other. Using ClarifAI, we found that Asian, Black, and White sociologists are racially heterophilous but that Black and Asian sociologists are different from one other in their cross-race collaborations. Using Kairos, we found all racial groups are racially heterophilous except White sociologists, who are racially homophilous in their collaboration networks. Each set of results would lead us to make different conclusions, drawing on different sociological literatures, about race and collaboration in sociology. In the context of the (mis)use of ML/AI and racial classification, it is important for researchers to be aware of these differences when using facial recognition and other ML models in research to ensure that existing biases, like a potential mismatch between how the software understands and labels racial groups and how human coders would do this, are not replicated.
This illustrative example of ML-generated differences in race and gender classifications was meant to spark innovation and future work in this area. Given the increasingly big role that classifiers are playing in sociological research, we have argued that sociologists need to seriously consider what impact these technologies will have on the research before implementing them. Facial recognition programs and other ML technologies are an opaque box that continuously push improvements without completely identifying how these improvements come to be. Furthermore, they can also pose dangers due to the secrecy of what is occurring. For example, when individuals hand-label images, they (ostensibly) know about their lived experiences and biases and can use that information to aid in their classifications, although this is also an imperfect process given that individuals with different racial conceptualizations may not be able to reliably identify “race” from an image. However, machines do not provide the same traceability of biases, which makes it difficult to remove them. Thankfully, some sociologists are beginning to address these issues by training algorithms themselves and clearly delineating their classification processes (for examples, see Arseniev-Koehler and Foster 2022; Nelson, Getman, and Haque 2022), but this alone will not address the ways that ML models can encode and reproduce harmful inequities.
Much of the current use of AI/ML in sociology assumes that the knowledge produced is valid with limited consideration for the ethical implications of that knowledge. Bias can be introduced through underrepresentation in training sets, incorrect use of data, the targeting of minority communities for data collection, and emphasis on algorithm design over human consequences. When algorithms are poorly designed and then used in sociological research, the data returned by the algorithms reflect biases present in the algorithm, giving inaccurate and biased results. Because there is not a simple fix, it is important for sociological researchers to understand the implications and possible effects (see Alegria and Yeh 2023).
Sociologists can use ML methods as a tool when appropriate with proper ethical consideration specific to the project. These precautions can include getting explicit consent from participants to use their data, including a way to rectify data to accurately represent participants, disclaimers on limitations of use, protection of participant data, and disclosure of algorithms used. Subjective classifications require more consideration and should employ verification to ensure algorithms are working as expected. If not, sociologists need to be willing to admit limitations of their conclusions or to discontinue the use of the algorithms. Most importantly, sociologists need to ask whether the knowledge they are producing is aiding in the reification of oppression in some way. This needs to be an open discussion in the community, and standards of use should be established on the acceptable use of ML, particularly when used to classify demographic data like race and gender.
Footnotes
Acknowledgements
The authors would like to thank Duke University’s Center for Computational Thinking, the editors, and the anonymous reviewers for their helpful suggestions in the production of this manuscript. Any opinions, findings, and conclusions or recommendations expressed in this material are those of the author(s) and do not necessarily reflect the views of the National Science Foundation.
Funding
This work was supported by the National Science Foundation (under Grant No. 2118453) and Duke University’s Center for Computational Thinking.