
Abstract
Sociological and urban studies have consistently reported that human behavior exhibits a discernible correlation with population size, following a power-law function. Individuals residing in larger communities exhibit significantly higher levels of activity in contrast to their counterparts in smaller communities. However, the underlying processes responsible for such behavioral patterns remain unclear. The authors propose that organizational crowding tends to generate competitive pressure that results in social overload for individuals, who in turn divide time and energy among many groups while reducing the time spent in each. The social overload thesis predicts integration, rather than mutual exclusion of groups, when experiencing competition. A large-scale event participation dataset from 11 major U.S. technology clusters over a period of 10 years is used to test these hypotheses. The results support the mediating role of competition in the relationship between population size and participation intensity. The authors demonstrate the impact of competition on network structure.
Keywords
Sociological and urban studies have documented the phenomenon of size-dependent social behaviors in various human aggregates. For instance, Milgram found that individuals in larger metropolitan areas tend to exhibit a faster walking pace, on average, compared with their counterparts in smaller urban areas (Milgram 1970; Simmel 1950). There appear to be similar patterns of size-dependent behaviors in organizational settings, including innovations in high-tech corporations (West 2018), activities in criminal gangs (Glaeser and Sacerdote 1999; Webb 1972), productivity and student enrollment in universities (Schläpfer et al. 2014), and social activities and network density in virtual groups (Wu, Zhang, and Zhao 2014). Although an individual’s social behavior is largely influenced by the immediate organizational routines and social structure (McPherson, Popielarz, and Drobnic 1992; Pentland and Rueter 1994), it has been often observed that the intensity of social activity is heightened in larger human aggregates (e.g., city, large corporation) compared with smaller aggregates. We pose two questions: do people engage more actively in voluntary groups in larger communities compared with smaller ones, and if this is indeed the case, what underlying social mechanisms can elucidate the connection between individual behavior and the broader context of aggregate size?
Theories of population ecology provide valuable perspectives on organizational behavior within a competitive ecology. In such a context, the initial crowding of organizations within the resource space serves to legitimize emergent organizational forms, ultimately leading to an increase in the number of competitors entering the field (Carroll and Hannan 1989; Hannan and Freeman 1977). Therefore, a resourceful ecology is likely to attract a significant number of competing organizations, resulting in variations in the rates of organizational adaptation and mortality, as organizations constrained by their ability to compete are less likely to survive. However, two conceptual specifications of the population ecology approach restrict its capacity to account for dynamics that link individual behavior and ecological processes.
First, the resources that organizations compete for (e.g., human time or market share) are conceptualized as undifferentiated masses or areas occupied by organizational niches. However, in an ecology composed of both groups and individuals, individuals often maintain extensive social connections with one another through cross-cutting affiliations. Thus, organizational behavior (e.g., implementing restrictive membership standards) in response to changes in ecological conditions not only affects the standing of the organizations within the competitive ecology but also shapes the social fabric in which members are connected. In other words, the dynamics of organizational behavior (e.g., crowding) can have a ripple effect on individuals’ social behaviors through a web of affiliations. This study extends the dual concept of individuals and groups (Breiger 1974) as a methodology for mapping structural properties of individuals and groups through shared affiliational ties. We argue that modeling the dual nature of groups and individuals can unpack the dynamics connecting macro-level ecological processes and micro-level individual behavior.
Second, the ecological approach to membership dynamics (e.g., McPherson 1983, 2004) tacitly assumes organizational affiliations as binary: individuals are either affiliated or not. In reality, individuals can vary greatly in their intensity of participation. When recruited by multiple organizations, an individual can either choose to join a select few and decline the rest, or divide their time and energy among many while reducing the time spent in each. These two adaptation strategies derive empirically incompatible predictions: the former, in line with traditional ecological models (McPherson 2004), implies that organizations will mutually exclude one another because of competition for membership (Popielarz and McPherson 1995; Shi et al. 2017), while the latter strategy suggests integration, as organizations are connected by numerous weak ties via shared affiliations.
To examine size-dependent behavior and adjudicate the competing predictions, we analyze the membership dynamics of interconnected voluntary groups using a large-scale event participation dataset from 11 technology clusters over a 10-year period. With the advent of digital technologies, the financial and informational barriers to creating voluntary groups have been significantly reduced. Platforms such as Meetup.com and Facebook Groups provide a variety of digital tools, including membership rosters, event registration, online networking, and direct messaging, all designed to assist organizers and members in coordinating and participating in real-world, in-person events. Anyone has the freedom to found new groups on a topic of their choice as long as they are able to attract continued participation. With tens of thousands of groups available across a wide array of topics, the competition for members’ participation emerges as a significant and existential challenge for group organizers. Traditional voluntary associations, such as political clubs, religious organizations, and sports groups, are local, in-person, and often goal driven (DiMaggio and Anheier 1990; Knoke 1986; Smith 1975). The factors that influence decisions and rates of participation in traditional voluntary associations are multifaceted and are shaped by individuals’ social, economic, and political standings (Cutler and Hendricks 2000; McPherson and Smith-Lovin 1986; Sigelman et al. 1985); compatibility with organizations’ goals (Knoke 1986; Putnam 2000); and connections with friends, family members, and acquaintances (McPherson et al. 1992). Voluntary associations in the digital era share many similarities with their in-person counterparts, including, at the center of its function, a voluntary basis of participation. However, they also exhibit distinct characteristics that set them apart, including an expansive reach, as evidenced by the wide range of groups, topics, and individuals that can be accessed through digital means. Additionally, these digital associations exhibit a competitive nature, characterized by a high rate of group formation and dissolution, and a tendency toward the survival of the most successful groups. These distinctive features warrant further investigation and understanding in order to grasp the implications of digital voluntary associations.
Herein we define niche positions via collective participation in terms of the dual network of individuals and groups. We concretize the concepts of carrying capacity and organizational crowding, two dimensions characterizing local competitive environments within an ecology. The carrying capacity of a niche position refers to its potential for human resources, while organizational crowding is measured by the total participation opportunities (TPO) imposed on a niche position by organizational entities. We focus on the implications of these dimensions of an ecological niche on the participation behaviors of individuals. Our assumption is that greater competitive pressure will result in individuals simultaneously dividing time to maintain affiliations with multiple organizations. Additionally, we posit that in knowledge communities with a high population density, participants tend to exhibit higher levels of social activity. The implications of these findings are discussed in relation to social integration, diffusion of knowledge and technological innovation, and the knowledge economy.
Competitive Pressure and Social Overload
The Social Overload Thesis Revisited
Classical sociologists called attention to the relationship between individual rates of social behaviors and the stress and competition manifested in large human aggregates (Milgram 1970; Simmel 1950; Wirth 1938). Milgram (1970) made a well-known observation that pedestrians’ average walking pace in a large metropolis is faster than that in small towns, which was later empirically verified in multiple studies as a scaling relation (i.e., power law) of population size (Bettencourt et al. 2007; Bornstein and Bornstein 1976; Li et al. 2017). Social science and recent urban studies have documented similar scaling relations between urban population size and a range of social phenomena, including crime rates, human capital accumulation, creative work, patents and inventions, communication, university enrollment, and new AIDS cases (Bettencourt et al. 2007; Dong et al. 2020; Glaeser and Sacerdote 1999; Schläpfer et al. 2014; Webb 1972; West 2018). Despite the ubiquitous and diverse contexts in which the relationships are found, they all follow a rather simple, law-like pattern: the rates of social behavior follow a power function of population size. Extending this same empirical pattern, we anticipate that individuals living in larger knowledge communities, such as large cities, are more likely to participate in voluntary groups at higher rates than those in smaller communities. This size-dependent relationship follows a power function, leading us to formulate our first hypothesis:
Hypothesis 1: Average participation rates increase as a power function of community size (the size-dependent hypothesis).
Simmel (1950) suggested that in response to the large number of people with which urban dwellers have to come into contact in a metropolis, they tend to conserve mental energy by maintaining superficial relationships with acquaintances. Wirth (1938) further pointed to “the superficiality, the anonymity, and the transitory character of urban social relations.” Building on earlier theorists’ observations, Milgram (1970) provided a social overload explanation in his classic essay “The Experience Living in Cities,” in which social overload is referred to as “the inability of a system to process inputs from the environment because there are too many inputs for the system to cope with.” As an ecology of groups expands in number and degree of heterogeneity, continued social overload in the forms of eventfulness, variety and possibility of choices, and density and heterogeneity of social contacts creates the need for individual adaptation. A primary adaptation strategy, suggested by Milgram (1970:1462), involves the abbreviated quality of attendance at social events. The concept of abbreviated quality of social contacts as a decreasing function of aggregate size in urban life was formalized in a mathematical model by Mayhew and Levinger (1976). The model was based on the premise that individuals have limited time and energy, and an increase in population size and the number of potential interactions would result in a corresponding decrease in the average time allocation per interaction. It should be noted, however, that their model’s underlying assumption, which asserts that every person in an aggregate interacting with every other person, is unrealistic and may not accurately reflect the declining time allocation per interactant.
Building on the social overload thesis, we propose that individuals facing competition from multiple groups are likely to subdivide their time commitment, participating in as many groups that provide the greatest exposure to diverse people and information. Two mechanisms may contribute to this behavioral tendency. The first mechanism, from individuals’ standpoint, is an imitation argument, which posits that individuals in similar structural positions are likely to mimic one another’s decisions and behavior, or risk losing their competitive advantage (Burt 1987; Coleman et al. 1966). Entrepreneurs and knowledge workers tend to participate in multiple groups on the same topics (Zamanillo 2022) to stay informed about technological advancements. The second mechanism is the recruitment efforts of social groups whose survival is dependent on their ability to attract new members (Kanter 1972; Rochford 1985; Shi et al. 2017). For example, many U.S. civic organizations are forced to adopt a “checkbook membership” strategy, whereby individuals have the ability to join a group or organization without significant barriers or restrictions. Although it contributes little to an organization’s day-to-day activities, maintaining a large number of members is crucial for the survival and growth of a voluntary group in facing competitive pressure (Putnam 2000; Skocpol 2003). Thus, we expect the following social overload hypothesis:
Hypothesis 2: Competitive pressure within local niches stimulates increased participation by individuals in groups (the social overload hypothesis).
We offer an ecological explanation for the size-dependent participation behavior. Large communities tend to have more people who can found social groups. For example as our data analysis shows, when a new topic of interest (e.g., cryptocurrency) emerges, a large knowledge community is likely to see the formation of more groups dedicated to this topic compared with a smaller community. The initial clustering of organizations within the resource space legitimizes emerging organizational structures, ultimately resulting in more competitors entering the field (Carroll and Hannan 1989). Hence, a resource-rich environment is likely to draw a substantial number of competing organizations, leading to fluctuations in the rates of organizational adaptation and mortality. Organizations with limited competitive capabilities are less likely to survive in this context (Podolny, Stuart, and Hannan 1996). This observation can be attributed to the fact that the rate of increase in the number of potential group founders is higher in large communities compared with smaller communities. Therefore, within large communities, voluntary groups experience higher levels of competition as a result of organizational crowding, and the competitive pressure can be transferred to individuals through aggressive membership strategies deployed by groups in attempts to recruit and retain members. Combining hypotheses 1 and 2, we hypothesize a mediating role of competitive pressure that explains why individuals in large community participate in more groups:
Hypothesis 3: Competitive pressure mediates the size dependence of participation rates (the mediating hypothesis of size dependency).
Mutual Exclusion or Integration? – Two Competing Hypotheses
A social group’s survival and growth is dependent on both attracting new members and retaining current members. In a competitive environment, social groups may implement strategies aimed at reducing the risk that members will leave for rival groups, even if such strategies come at the cost of hindering the recruitment of new members. One such example is the adoption of formal and informal programs that seek to reinforce social connections among members within a commune and diminish their external ties (Kanter 1972; Shi et al. 2017; Stark and Bainbridge 1980). In extreme cases, organizations establish greedy institutions that force members to cut off ties entirely to the outside world, thus insulating themselves from external influence (e.g., utopian communes, religious cults) (Coser 1974). Another common organizational practice is to increase the cost of membership through the implementation of strict rituals, practices, conventions, or monetary fees (Iannaccone 1994; McAdam 1986; Shi et al. 2017). The use of elevated barriers serves to restrict members’ ability to participate simultaneously in multiple social groups. This is particularly relevant for groups that possess incompatible goals, cultural practices, or activity schedules.
Thus, the ecological theory of membership (McPherson 1983, 2004) predicts a mutual exclusion of membership between competitor groups. Under the assumption of a limited availability of time and energy for individuals, those located in competitive niches are likely to reduce their participation in multiple groups, resulting in a prioritization of time and energy allocation to a select few affiliations and closed social networks over time (Hannan and Freeman 1977; McPherson et al. 1992; Popielarz and McPherson 1995). This is consistent with the competitive exclusion principle in a bioecological system (Gause 1934), which states that two species cannot occupy a same niche indefinitely. 1 Under the assumption of limited time and energy, individuals located in a competitive niche may experience a decline in both the quality and quantity of their participation in social groups. This reduction in participation may result in a decreased level of interconnectivity and social nesting within the group. Although groups that exhibit a high degree of cohesiveness are capable of generating normative, symbolic, and cultural structures that shape individual behavior and commitment, they may impede the dissemination of new ideas and technologies in the larger network. Figure 1b illustrates the process of mutual exclusion and the increased social cohesion within groups as the number of competitor groups (blue squares) increases in a local niche.

Schematic illustration of (a) social overload and (b) mutual exclusion in an organizational niche.
In contrast, as the number of social groups increases (Figure 1a), the social overload thesis predicts that individuals will adopt an adaptation strategy by frequenting as many events as possible, but with a decline in the quality of their attendance at each event (Milgram 1970). In other words, individuals are more likely to have higher participation rates and more expansive social networks in local niches crowded by social groups compared with those that are not as crowded. The implication is that populous and competitive communities are likely to foster social integration rather than segregation. Thus, we present the competing hypotheses regarding the structural conduciveness of competition:
Hypothesis 4a: Social groups whose ecological niches are under heavy competition are more likely to form cohesive networks.
Hypothesis 4b: Social groups whose ecological niches are under heavy competition are more likely to form expansive networks.
Operationalization of Niche and Competition
Rather than projecting the dual relations of individuals and groups to a one-mode network (i.e., either on the individual or group side), we use the multidimensional scaling technique to map the group choice data in a latent space. Each person’s participation in a group is represented as a vector of proportions of time dedicated to the group; we assumed that all events had the same weight for participation. It is then mapped onto a low-dimensional space where one’s relations to other people can be preserved. Multidimensional scaling techniques (Banerjee and Roy 2014) have been widely used in sociology (Shi and Macy 2016; Slez and Martin 2007), political science (Poole and Rosenthal 2011), and economics (Cooper 1983). In this way, each person can be represented as a point in a low-dimensional space. The spatial model of group participation embodies the insight that cultural preferences are fundamentally a form of the “knowledge of what goes with what.” (Converse 1964; Mohr et al. 2020). By representing the relationships between individuals and groups in a spatial model, we can delineate an organization’s niche by the area in the space that it encompasses. This departure from the traditional dual network projection (Breiger 1974) offers an opportunity to study how the overcrowding of social groups in an ecological niche affects human behavior and social network configuration.
The concept of niche has been an integral part of the ecological approach to studying organizational behavior (Hannan, Carroll, and Pólos 2003; Hannan, Pólos, and Carroll 2007; Popielarz and Neal 2007). Our operationalization of niche is in line with earlier measures, but entails several advantages. One is that, rather than indirectly calculating niche properties (e.g., niche overlap) using proxies (Hsu, Hannan, and Koçak 2009; Podolny et al. 1996; Shi, Lim, and Suh 2018), our approach allows us to directly calculate the density of resources concentrated in a unit area of a resource space, from which other properties, such as niche overlap or width, can be derived using simple algebraic calculation.
More importantly, the cultural meaning of space dimensions emerges from the behavioral patterns rather than being selectively assigned by researchers, which is a common practice. In fact, G. Evelyn Hutchinson, whose multidimensional conception of ecological niche remains dominant in bioecology (Chase and Leibold 2009; Hutchinson 1957; Popielarz and Neal 2007), emphasized that when constructing the niche of a species, namely S1, an area encompassing possible environmental states, “we may now introduce another variable x3 and obtain a volume, and then further variables x4 . . . xn until all of the ecological factors relative to S1 have been considered” (p. 416; italics added). Without fully accounting for possible environmental states, it is difficult, and sometimes erroneous, to explain why there are so many types of organisms in any ecology. However, exhausting important environmental states of a niche for social science studies is conceptually difficult and methodologically challenging. For example, Podolny et al. (1996) defines an organizational niche by two properties that characterize a technological network: crowding and status. Although their formulation offers a theoretically innovative explanation for an organization’s life chances, its explanatory power is limited as organizations occupying the same niches may differ in their use of other critical resources, leading to distinct life-chance trajectories.
In a similar vein, McPherson’s (1983, 2004) Blau space, an extension of Hutchinson’s multidimensional space, is constrained in its applicability to the kind of ecological systems where the resource space is not primarily structured by social connections. 2 Although social relationships have been the primary organizing principle of human activities throughout history (McPherson 2004), their importance is waning in the age of social media, where finding social entities (e.g., groups) to join is financially inexpensive and technically convenient. Virtual group affiliations can primarily be driven by individual preferences (Wellman and Haythornthwaite 2008). Hence, the Blau dimensions (e.g., gender, age, race), which structure homophilous social connections in offline voluntary associations, may no longer be the social force influencing the clustering of individual and social organizations in an online knowledge space.
The formulation of ecological niche in a space derived from participation behavior aligns with the ideas of its intellectual progenitors, such as the Hutchinsonian multidimensional niche and McPhersonian Blau space, as both organizational niches and individuals’ positions can be represented in a geometrical manner. A social group sustains itself in the niche space by attracting new members whose interests align with the activities of the group, as well as by retaining current members through information diffusion facilitated by digital technologies. The use of tools such as search engines, topic catalogues, direct messaging, and personal and group profile pages plays a crucial role in matching individuals with groups. These digital technologies complement social connections by preserving the membership continuity, thereby reducing the risk of disruption and preventing its dissolution in the face of external competition. Although the resource space derived from high-dimensional participation behaviors differs from McPherson’s ecology of affiliation in terms of the mechanisms of information diffusion, the underlying ecological processes of variation, selection, and retention of members in groups remain the same (McPherson and Ranger-Moore 1991). In a similar approach, Mohr and Guerra-Pearson (2010) measure the niche width and overlap of organizations in an institutional logic space.
Each individual is represented as a point in the resource space, while each organization’s niche is represented as a rectangle (or a hypervolume in a multidimensional space) that encompasses the area from which it attracts its members. The level of competition within a given area is determined by two factors: the availability of human resources and the participation opportunities provided by underlying organizations. The former, also known as the carrying capacity, refers to the potential pool of individuals in a particular area. The distribution of participants in the resource space is variable, as topical interests constantly emerge, blend, and disappear, and the number of adherents can fluctuate accordingly. In technology clusters, topics such as big data and virtual currency gained popularity in the late 2010s, attracting significant numbers of participants who later became the resource pool from which other technological groups could grow. Conversely, less widely known topics, such as Kanban and LISP, occupy areas of the ecology with relatively low carrying capacity, and as a result, they have a limited population to support membership. In line with the concept of adaptive landscape (McPherson and Ranger-Moore 1991; Wright 1931), social groups will take advantage of temporary opportunities by attracting new members from areas where the carrying capacity is in excess, while social groups situated in areas of high demand will shrink and experience a loss of members.
The latter factor affecting the competitive landscape of a niche area is the extent of participation opportunities offered by groups. The more groups that occupy a particular niche, the higher the overall level of opportunities available for participation. A group’s participation opportunities are a product of the events organized by the group and average event size. Generalist groups appeal to a wide range of participants by having a wide niche, but as a result, they have a lower capacity to maintain a high level of engagement in any unit area they occupy. On the other hand, specialist groups cater to a smaller group of individuals by having a narrow niche and tend to maximize their engagement through frequent events and strong connections among regulars. In our formulation of participation, we take into account not only the number of overlapping organizations but also the extent of their niche engagement. Thus, the competitive pressure in a niche area can be quantified as the ratio of TPO provided by competing groups and the potential human resources available (carrying capacity). 3
Data and Methods
The Meetup.com Dataset
Inspired by Putnam’s (2000) Bowling Alone, Meetup.com was established in 2002 as a response to the increased desire for community in the wake of the September 11 attacks in the United States (Overfelt 2003). The Web site facilitates offline, in-person events for individuals with similar interests. Social events are organized by groups, and groups can be created by any individual user on the basis of their interests and identity (Paxton and Rap 2016). The membership and event participation are voluntary and accessible to anyone who are able to pay the minimal entrance fee. The low membership barriers and voluntary nature of Meetup groups create inclusive spaces for traditionally marginalized groups in the tech sphere, including women (Adams et al. 2019), racial minorities (Curran 2021), and immigrants (Nee and Drouhot 2020), as well as for ordinary knowledge workers, to participate and to learn new technologies.
The dataset was downloaded from Meetup using its application programming interfaces during the summer of 2019, prior to the coronavirus disease 2019 pandemic. Eleven high-tech industrial clusters in the United States were selected for analysis on the basis of variability in size, geographic location, and concentration of technological activities (Kerr and Robert-Nicoud 2020). The list of technology clusters includes Atlanta, Austin, Chicago, Detroit, Minneapolis, New York City (NYC), Phoenix, the San Francisco Bay area (SFBA), Philadelphia, Seattle, and Washington, D.C. To collect the complete lists of the groups within the selected high-tech industrial clusters, we first collected identification numbers of all groups within each ZIP code area, which were then used to collect group information, including a profile summary, the identities of organizers, self-identified topics, membership rosters, and event details, such as event addresses, latitudes and longitudes, time stamps, descriptions, and attendee lists. The data collection period encompasses the inception of the Web site in 2002 up until mid-2019.
As of 2019, Meetup.com boasted more than 44 million users and more than 330,000 groups hosting more than 84,000 events per week. The platform has a global reach in 190 countries and 2,000 cities, with a level of penetration similar to Facebook Groups (PR Newswire 2020). For instance, in NYC, membership and the number of events have both experienced exponential growth since the platform’s inception. In 2019, the total monthly event participation in NYC exceeded 50,000.
The platform compiles a list of thousands of user-generated categories and topics, including conventional voluntary association categories, such as religions, sports groups, and political clubs, as well as a growing list focusing on emergent and less formal types of associations, including technology, identity (e.g., LGBTQ), and environment, among others. Paxton and Rap (2016) compared the categories on Meetup.com to group categories included in the General Social Survey and found that Meetup.com contains more informal associations that are central to studies of small groups in American society (e.g., Wuthnow 1994). In this study of knowledge communities, we limit the scope of the association category to technology, which is one of the most popular categories on Meetup.com. 4 Meetup offers an accessible platform that supports the development of relationships, exchange of ideas, and formation of innovations and startups beyond the bounds of individual groups. Appendix A offers a glimpse of the basic layout of a home page and an event page of a technology Meetup group, NY Tech Meetup.
Formalizing Resource Space and Niche
Instead of explicitly specifying underlying topical dimensions (e.g., software, hardware, and the Internet), we take a bottom-up approach to mapping clusters of people by the groups in which they participated. This alternative construction of resource space underscores the inherent meaning that individuals assign and interpret when they attend group events (Popielarz and Neal 2007). Singular vector decomposition (SVD) (Banerjee and Roy 2014), a multidimensional scaling technique, is applied to extract underlying dimensions for resource space. We first create a yearly topical interest matrix (i.e., individual-by-topic matrix) for all individuals in each city in a given year, with values in the matrix indicating strengths of interest in a given topic (i.e., the number of group affiliations related to the topic). The topical interest matrix is constructed with information related to group affiliations and the topic assignment of groups. We then apply SVD to the matrix and set the reduced dimensionality for the ease of the formalization of niche ecology. Such a formulation allows us to directly measure both individuals’ and groups’ positions in the same space. Similar spatial models have been used in measuring spatial configurations of political ideology using Congress roll-call voting records (Poole and Rosenthal 2001, 2011; Slez and Martin 2007).
Figure 2 illustrates a sketch of a hypothetical topic space after SVD is applied. The latent dimensions (D1, D2) do not imply any predefined meaning. In the topic space, each individual can be represented with coordinates on two latent dimensions (black crosses), and their relative positions indicate similarity in group choices.
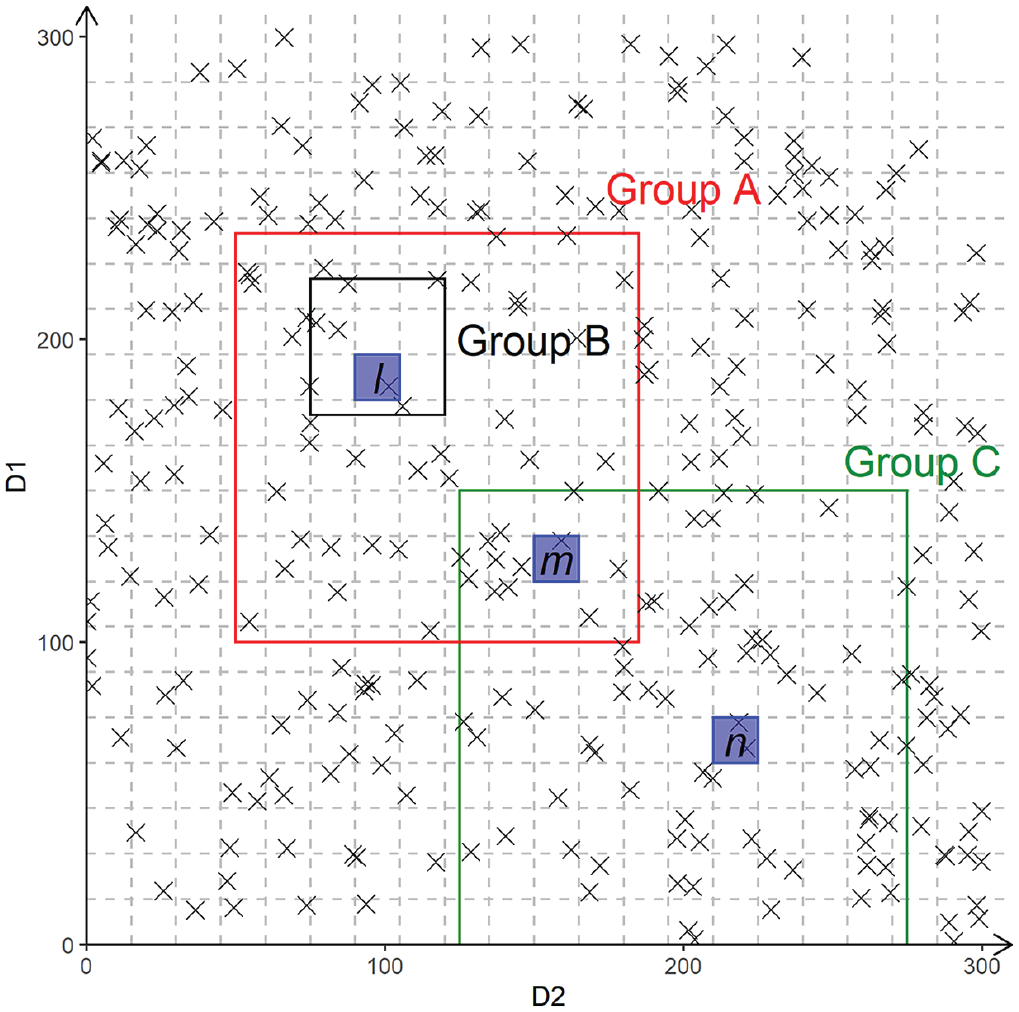
A hypothetical ecological space.
In the derived space, a group’s niche is characterized by the rectangular area that encloses the pool of resources from which its memberships are drawn. Following McPherson’s formulation of a base niche in Blau space (McPherson 1983; Popielarz and McPherson 1995), the central point of an organizational niche is the means of coordinates of its members, and the niche breath is a 1.5-SD window for each dimension. In Figure 2, the hollow rectangles designate the niches in the topic space for groups A (red), B (black), and C (green). The competitiveness that individuals in a unit area k experience is a function of the area’s TPO provided by contesting groups and the potential of human resources (PHR) (i.e., carrying capacity):

In a bioecological niche, the PHR is the upper limit of consumable resource (McPherson 1983). In our derived resource space of Meetup.com, we define the potential as the total number of individuals that a unit area k encompasses in the space. For example, the PHR in the unit area n in Figure 2 is the total number of individuals (black crosses) located within the area, which has two individuals. In the calculation of the potential, we restrict our attention to all the individuals who have ever participated on the platform.
We calculate TPO in the unit area k,

where j indexes groups in set J, which contains all the groups that overlap in area k. The calculation of

where

Outcome Variables
Individual Participation Rates
Individuals’ group participation behaviors are hypothesized to scale with the population sizes of communities. We measure it as the number of events each individual attended during a year in an urban knowledge community. One important point to emphasize here is that the outcome variable and explanatory variables are constructed using separate pieces of information. The outcome variable, which is the number of events an individual attends, is measured at the individual level, whereas the explanatory variables are measured as the properties of the ecology (e.g., competitive pressure, aggregate size), using group-level information, including the number of events a group organizes, event sizes, and niche area.
External Affiliations
As previously discussed, two structural characteristics of crucial importance for information flow are openness to external groups and internal cohesion of the membership networks. For external affiliations, we measure the average number of external group affiliations that members have in a given year. On average, the more external memberships the participating members hold, the more groups to which the focal group is connected. The simple mean metric also accounts for the heterogeneity that is arisen from group size variations. To adjust for the skewness, we also apply a log transformation to the measure.
Internal Group Cohesion
Theoretically, a social group is cohesive if the underlying social or communication network can be held together by its members via a network configuration where any pair of members are connected via multiple independent relational paths (Moody and White 2003). We adopt a network-based approach and quantify group cohesion through the use of the k-component metric, which is defined as a subgraph consisting of at least k nodes, such that removal of these nodes would result in a disconnected graph (Moody and White 2003). This definition also indicates that pairs of nodes in a component are connected by at least k independent paths (or the graph is considered k connected). The higher the level of k, the harder it is to break apart a connected network, as multiple independent paths bind the nodes together; therefore, the level of internal cohesion is also higher.
The first step of quantifying group cohesion is for each group to construct a one-mode coparticipation network with individual members serving as nodes and shared attendance at events as ties. For each group-specific network, we then calculate the proportion of individuals in a 5-component graph. According to Moody and White (2003), a connectivity of 2 (i.e., k = 2) is the threshold for distinguishing weak from strong group cohesion. We set k relatively high because one-mode networks projected from two-mode networks often have higher levels of connectivity (i.e., coparticipation in an event automatically connects all the participants in that event). Varying the value of k does not alter results. Finally, we construct the group-specific networks for a period of six months and repeat the network construction process every three months. The measure of group cohesion is computed as the average over all networks within a given year. To correct for skewness, the internal cohesion measure is transformed to a logarithmic scale.
Results
We first report basic trends of key system characteristics. Then, using mixed-effect models with city and year random intercepts, we report the scaling relation between participation rates at the individual level and the community population sizes at the city level. A following model adds competitive pressure of a niche area as a mediating factor to test the mechanism driving the effect of population size on individual behaviors. Next, we report results from statistical models predicting two structural outcomes, group members’ external affiliations and individual groups’ internal cohesion in mixed effects models with random intercepts of city. Instead of using year random intercepts, we include lagged dependent variables in the regressions, with the expectation being that group structures in the previous year have a positive impact on the structures in the current year. Control variables are logged community population size and logged average group size.
Summary Descriptions of Knowledge Communities
Our dataset contains a total of 1.13 million unique individuals who participated in Meetup events from 2005 to mid-2019. The size of the communities varied, with the SFBA community having the largest number of participants, with a total of 344,040 participants and 88,922 organized events. On the other hand, Detroit had the smallest number of participants, with 14,740 participants and 4,551 organized events. The dataset covers a broad range of technological topics, including those of general interest to knowledge workers, such as computer programming, entrepreneurship, and job interview preparation, as well as highly specialized technological domains, such as Azure, containers, and enterprise blockchain. Additionally, the dataset also encompasses topics that cater to marginalized groups in tech communities, such as women in data science.
Figure 3 illustrates the temporal variations of crucial system-level characteristics, represented on a logarithmic scale, from 2010 to 2019. The data are ordered by technology clusters. 5 Figure 3a shows the growth trends of the total population size from 2010 to 2019. Despite the potential for masking variations between communities through the use of a logarithmic scale, the trends depicted in Figure 3 remain consistent and exhibit similar patterns across the 11 technology clusters analyzed. Community sizes grew substantially from 2010. However, it is worth noting that the rates of growth began to plateau around 2018. The observed decrease in the data during 2019 does not reflect a decrease in the size of the population. Rather, it is because the data collection was performed during the summer of 2019 and only encompasses participation data for half of the year. Figures 3b and 3c present the average number of event participation and group affiliations in which individuals were involved. Two notable patterns regarding event participation are discernible from the data. First, the trends in average event participation exhibited a swift leveling off and reached maximums for most cities after 2013. This is in contrast to the continued growth observed in both population size and average group affiliation until around 2018. Participation in meetup events is limited by individuals’ time and financial conditions, as opposed to population size (which is affected by city scale and the availability of knowledge-based infrastructure) and average group affiliations (which is a nominal count of membership). Second, the ordering of cities in both individual-level trends (Figures 3b and 3c) is congruent with that of the temporal trends of population size, indicating a dependency of individual participation and affiliations on community size. Although these patterns are consistent with the expectation that individuals residing in large metropolitan areas such as SFBA and NYC would be more active in social activities than those living in small towns, it contradicts the assumption that the total amount of an individual’s time and energy is constant and unchanging. Figure 3d presents the trend of average group membership size, which exhibits a similar upward trend as average affiliations.

Trends of key variables by city, 2010 to 2019: (a) population size, (b) average event participation, (c) average affiliations, and (d) group size.
Figure 4 displays low-dimensional configurations of topic structures for SFBA and Minneapolis. We construct topic structures for each city-year, with each vector representing a user and their numbers of participation in groups of each of the topics. The relative positions of points are rendered by the t-distributed stochastic neighbor embedding algorithm (Van der Maaten and Hinton 2008), which embeds high-dimensional points in low dimensions in a way that preserves similarities between points. Each point in Figure 4 represents a technological topic. Figure 4a displays a growing trend in both numbers and diversity of topics in both cities over a period of 10 years. In 2009, for example, SFBA had 818 topics that were listed by at least 5 groups, and 112 active technological groups in total attracted 5,059 participants. In 2018, the number of topics was 818, and the active technological groups grew to 1,490, with a total 105,149 unique participants. The three largest topics in SFBA in 2018 were software development (48,989 participants), open source (42,175), and computer programming (36,371). Clusters of technological topics are demonstrated in Figure 4b. The clustering patterns of topics are derived on the basis of group participation behavior. On one hand, groups of topics such as game design and computer graphics, blockchain and cryptocurrency, Amazon Web Services and data centers, big data analytics, and artificial intelligence, to name a few, are clustered within and separated from others. These are specialized topics and their participants often attend social events with similar groups. On the other hand, technological topics in the center of the structure have a more general appeal, such as e-commerce, SFBA, informatics, and Web analysis, among others, or less serious topics that are often added with other groups, such as data integration, study group, and concurrent programming.
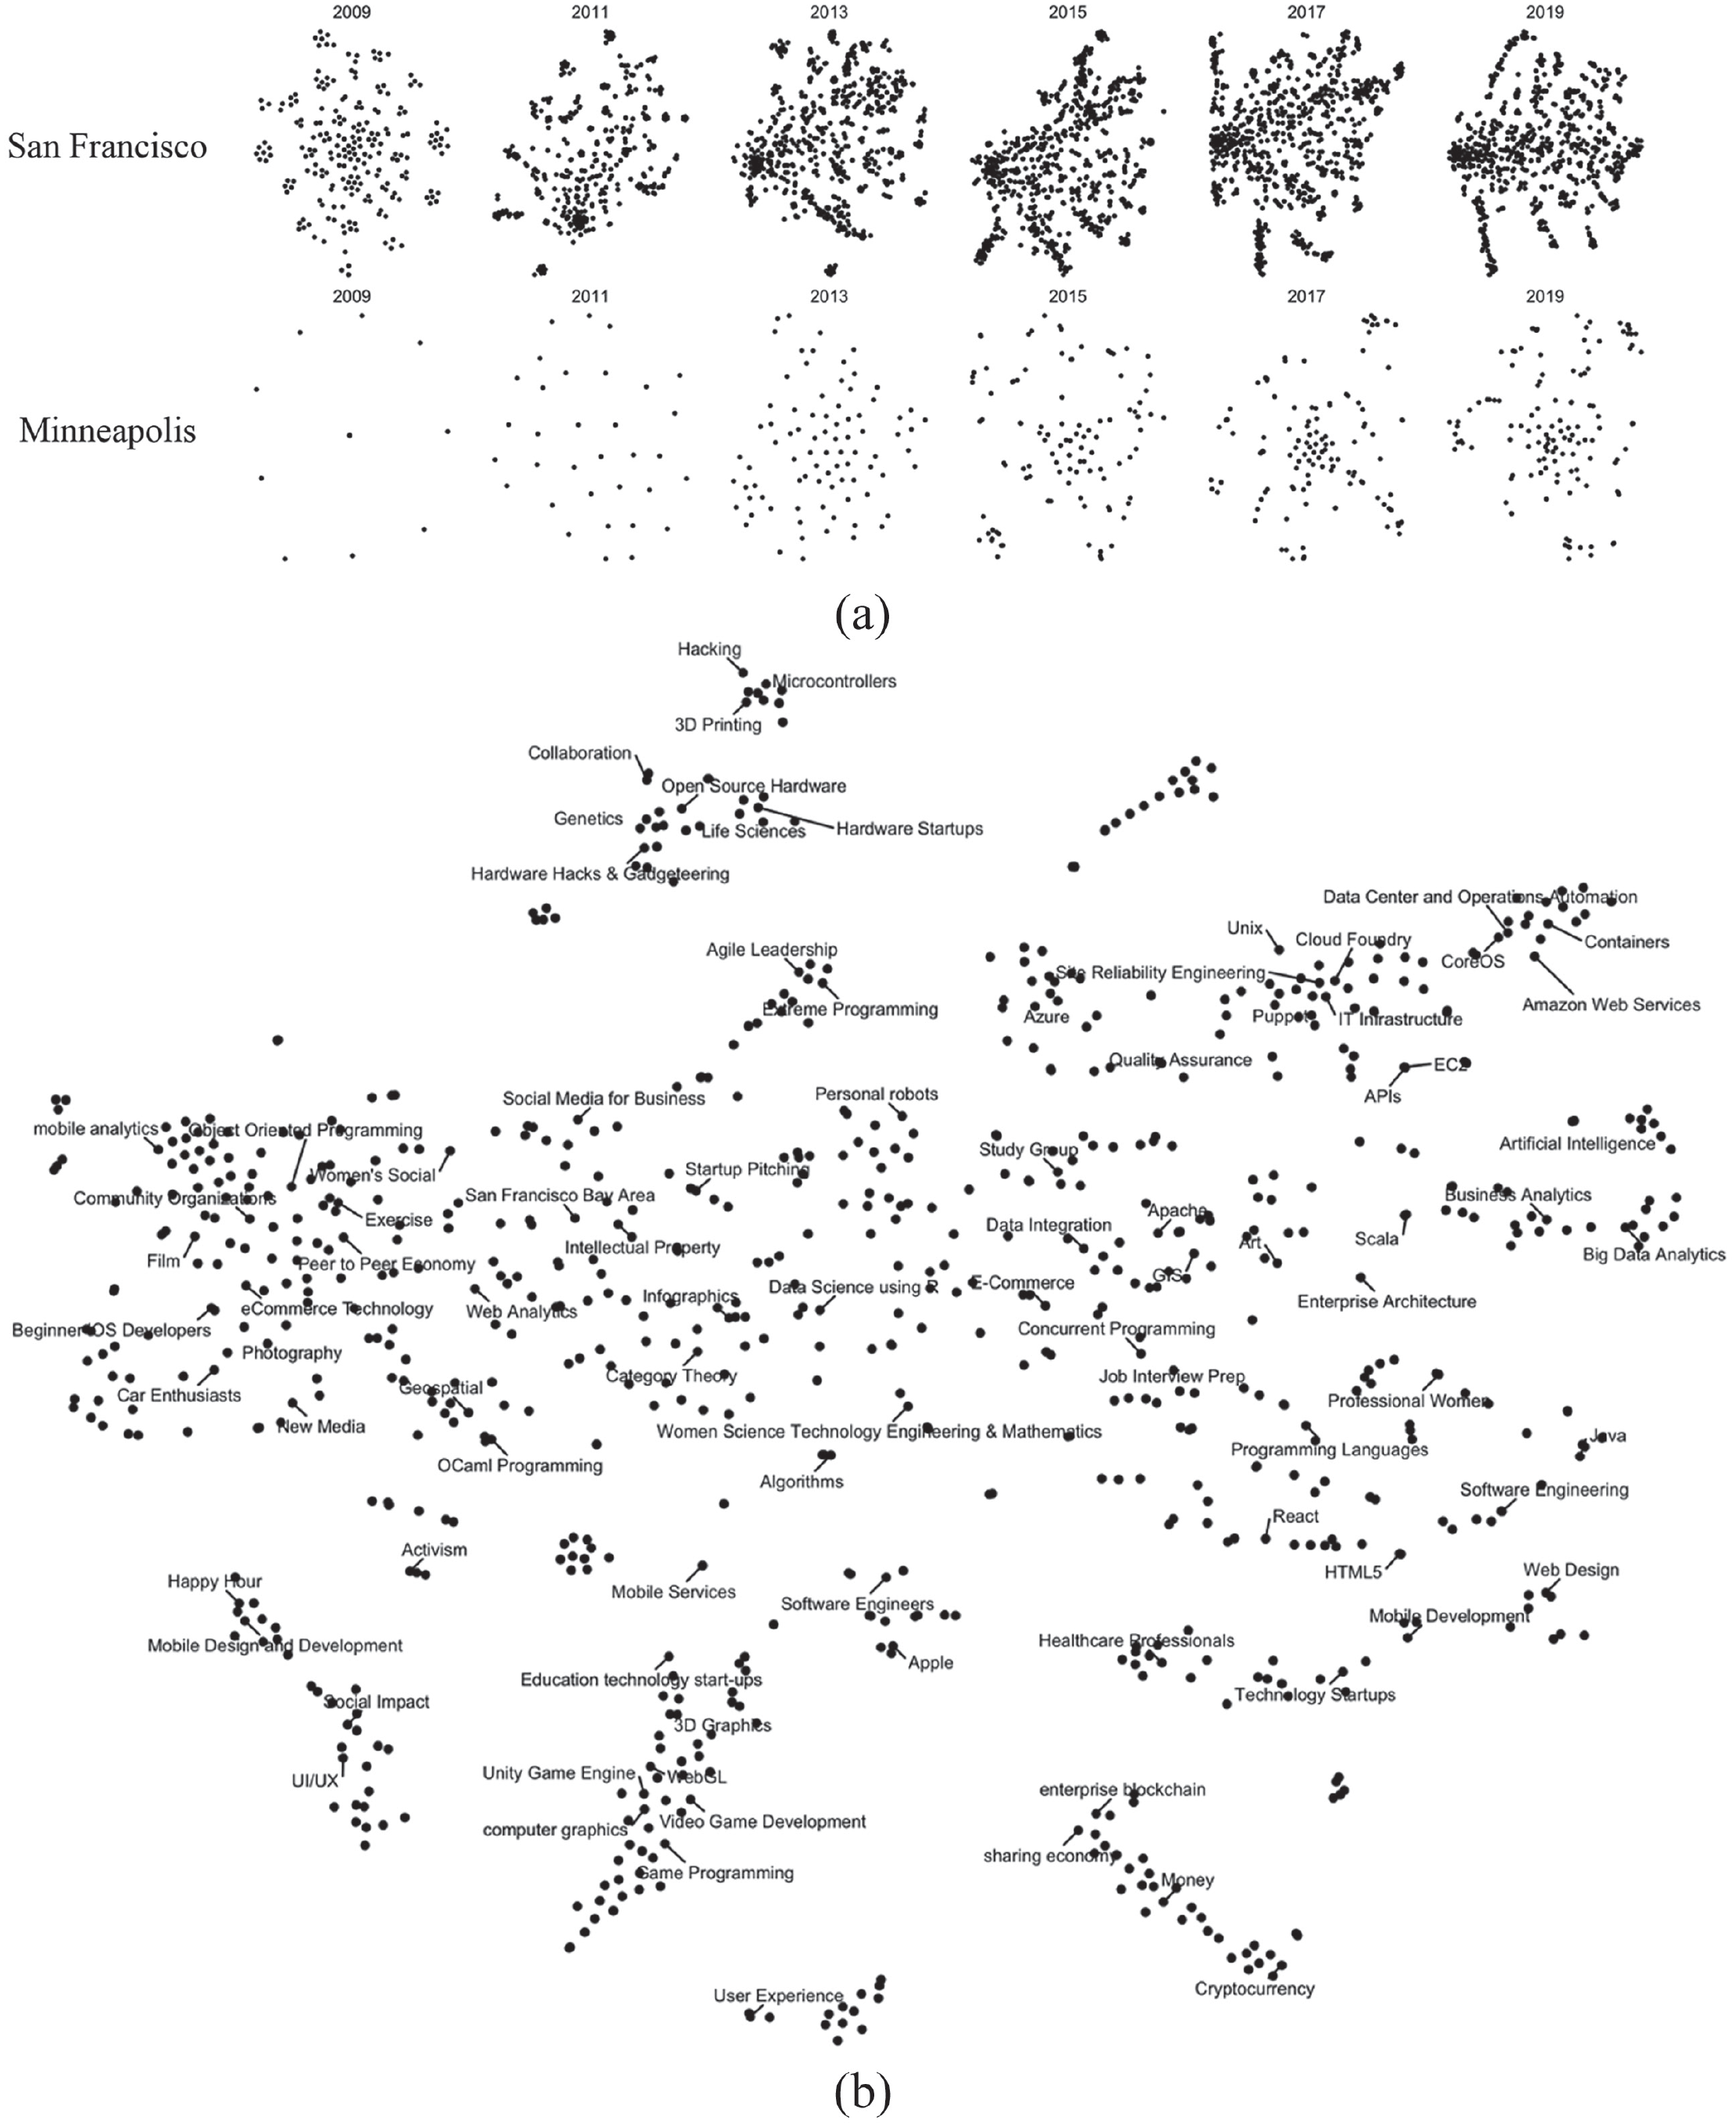
Topic structures of (a) San Francisco and Minneapolis from 2009 to 2019 and (b) San Francisco in 2018 with selected topic labels.
Result 1: Establishing the Size-Dependent Relation of Participation
Our analysis of participation rates in voluntary communities across 11 technology clusters in the United States between 2010 and 2019 supports Hypothesis 1 that the average level of participation increases as a power function of community size. We used a power function

Scaling of per-unit participation activity versus population of active users for selected cities in the United States.
Result 2: The Mediating Mechanism of Niche Competition
The scaling effect of aggregate population size on individual participation rates is hypothesized to be mediated by the level of competition within local niche communities. Specifically, we posit that individuals in large technology communities experience increased rates of participation because of the heightened levels of competition in their local ecology. To test this mediating mechanism, we examine the distribution of potential human resources (carrying capacity) and competitive pressure on a logarithmic scale across local areas in three major metropolitan regions over various years, before turning to regression analyses.
Figure 6 depicts a comparative analysis of population distribution in three urban regions, Minneapolis (2015), Philadelphia (2017), and SFBA (2018), through the use of heatmaps. These maps demonstrate the populations of small (6,135, represented by a log10 value of 3.79), medium (10,212, represented by a log10 value of 4.01), and large (105,149, represented by a log10 value of 5.02) communities. The heatmaps represent resource spaces, with each square denoting a specific niche area and its cell color reflecting the value of the measures being analyzed in that area.
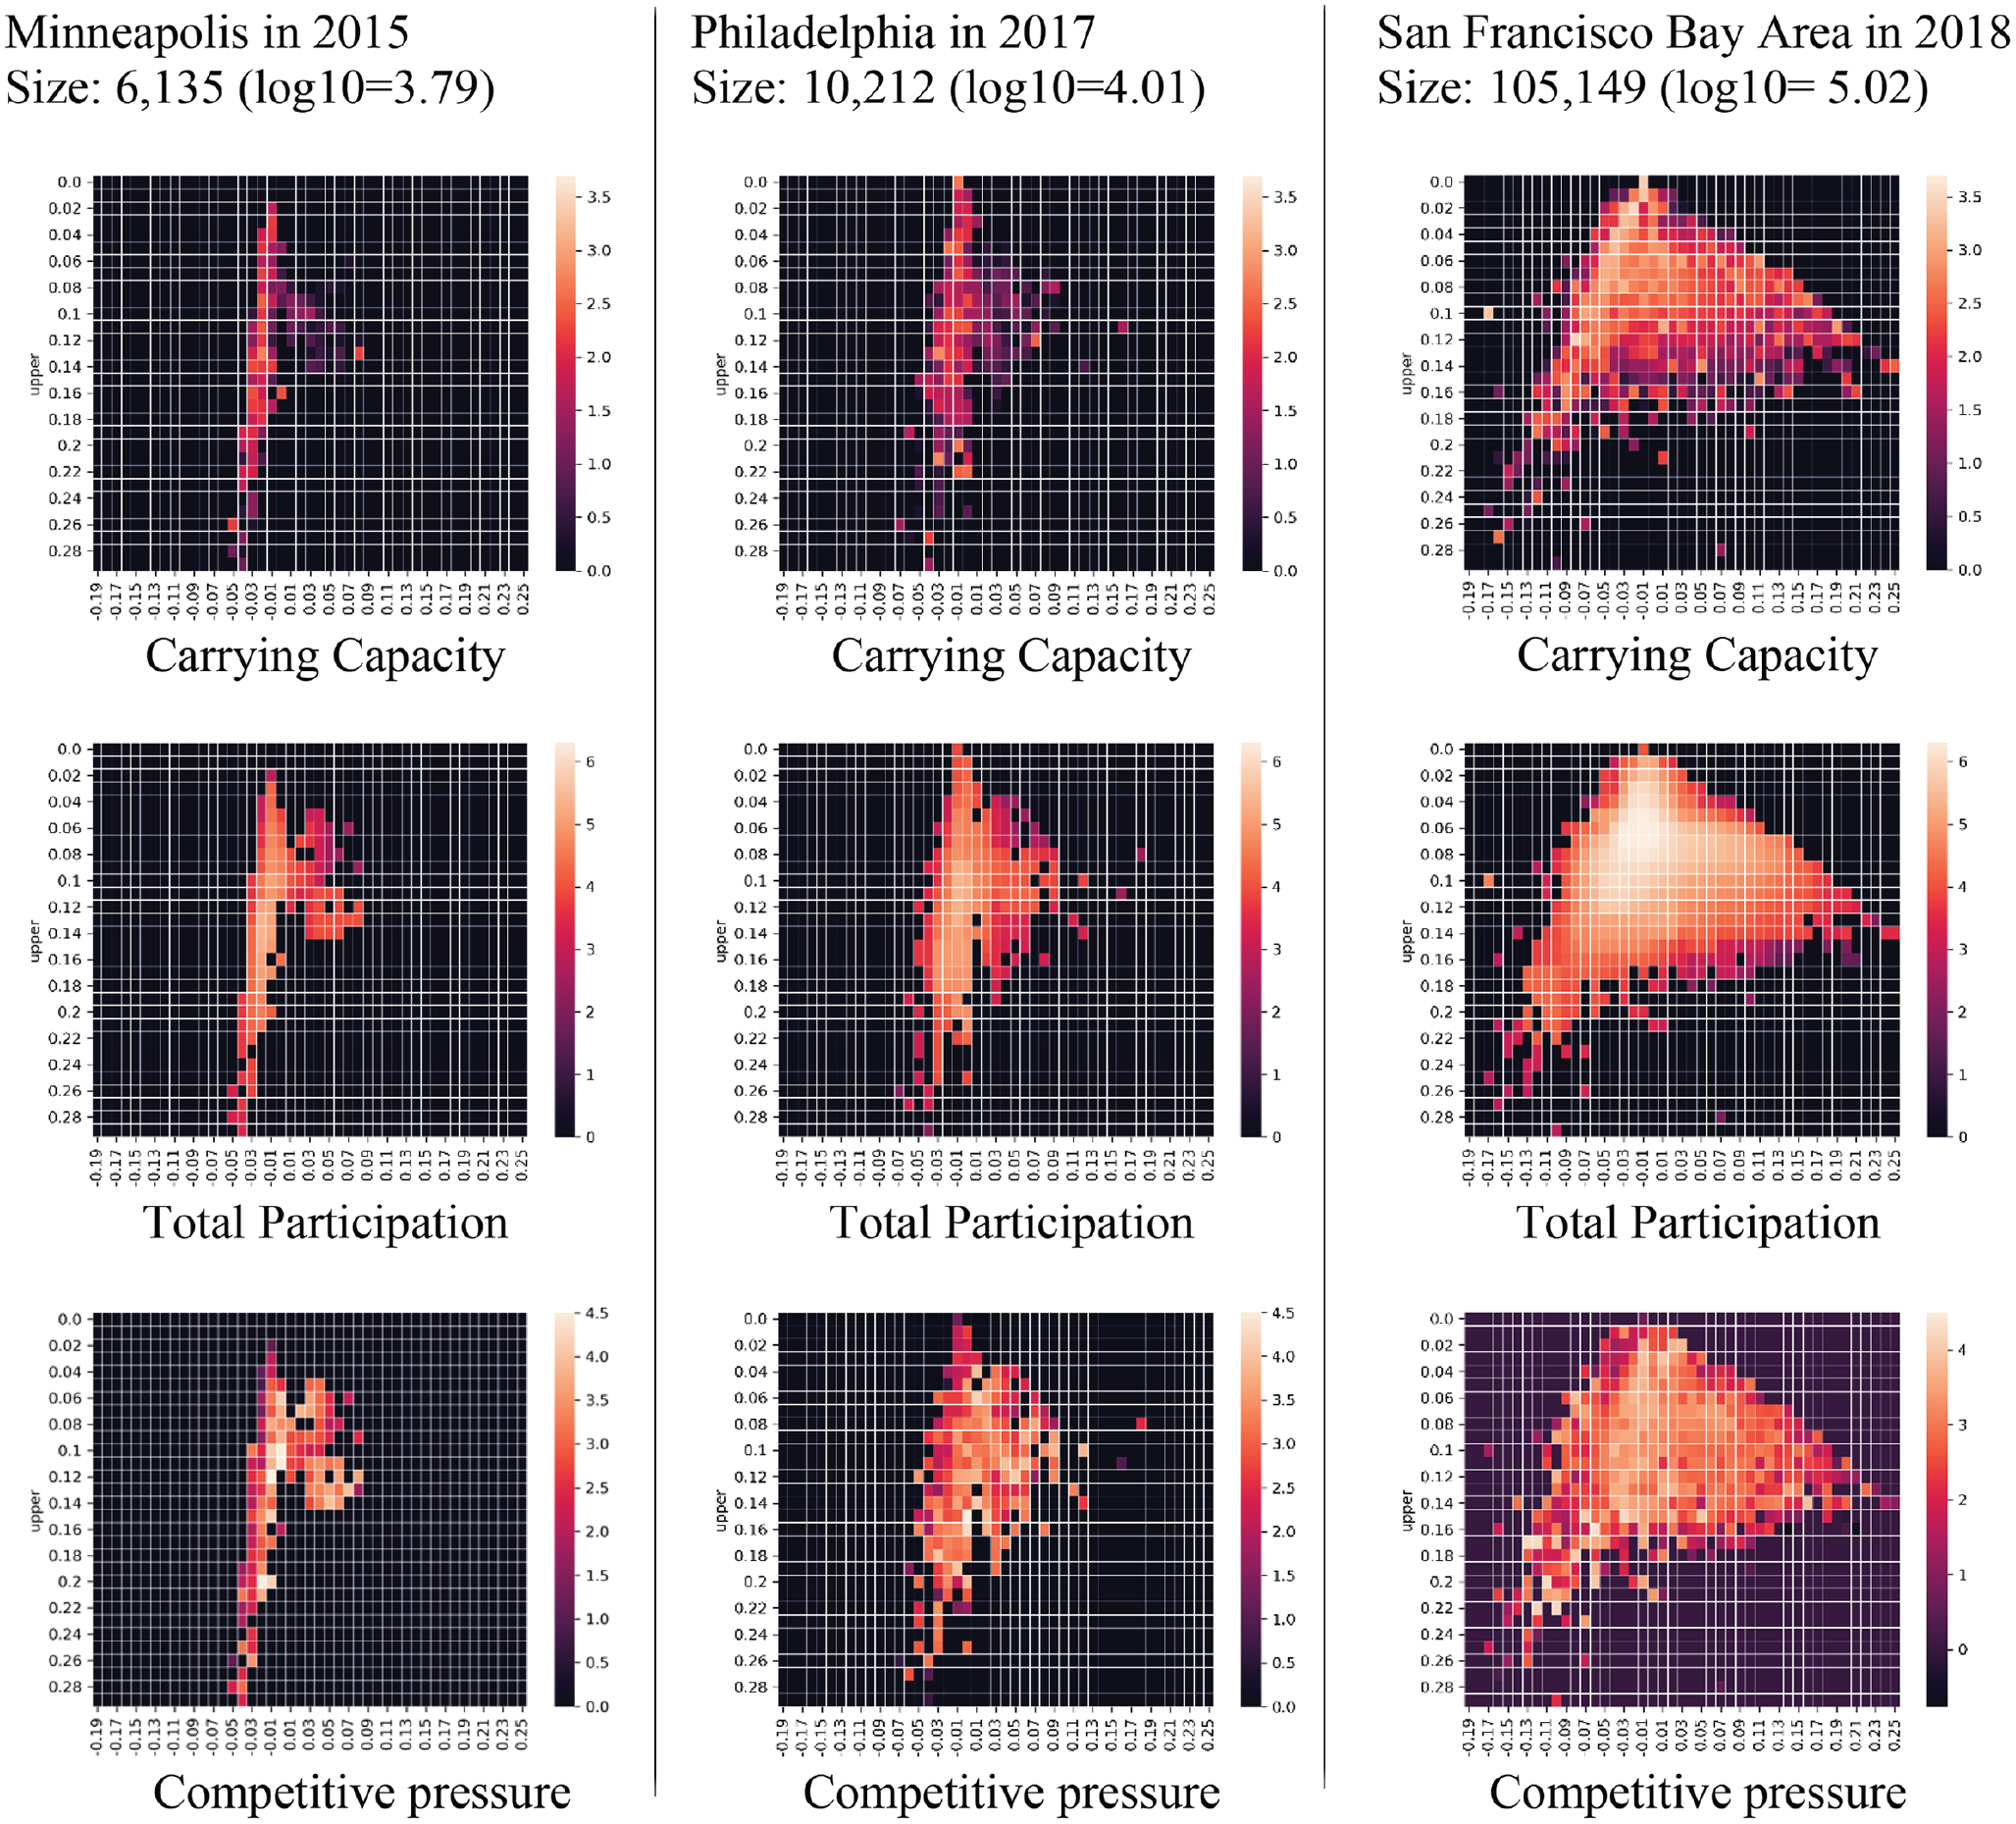
Carrying capacity, total participation, and competitive pressure in resource spaces of three cities.
The distribution of resources across the three ecologies varies significantly. Our first observation is that as population size increases, not only does the niche space expand, but areas with high levels of competition also expand. This pattern provides insight into why individuals in large communities are likely to experience higher levels of competition in general. The size of the ecology space is much larger in SFBA in 2018 than in Minneapolis in 2015 or Philadelphia in 2017, with all areas having greater values in each of the three measures. However, it is important to note that although large cities have a wider spread, the area occupied by larger cities relative to smaller cities is not proportionate to the relative size difference of the communities. For example, SFBA is 10 times more populous than Philadelphia, but the area occupied by SFBA is less than 10 times larger, which suggests that large cities tend to have higher membership density than smaller cities in the resource space.
As outlined in the “Data and Methods” section, the level of competitive pressure in local areas, as illustrated in Figure 6 (third row), is determined by the ratio of TPO (second row) to the carrying capacity (first row). A notable distinction among the competitive pressure heatmaps is that the areas with high levels of competitive pressure in the three panels exhibit distinct patterns. In small communities, such as Minneapolis in 2015 and Philadelphia in 2017, areas of high competitive pressure are correlated with low carrying capacity. Conversely, in the heatmap for SFBA in 2018, areas of high competitive pressure are associated with high levels of TPO. These observations suggest that as a community increases in size, more social groups will form and compete for resources in the most resource-rich areas, resulting in higher competition. In contrast, in small communities, competition in a local area is more likely to be driven by a limited potential pool of participants, or low carrying capacity. It is noteworthy that the upper and lower bounds of the TPO, carrying capacity, and competitive pressure are consistent in scale across all ecologies in the dataset.
To summarize, the analysis of the three resource spaces reveals a positive correlation between community size and the extent of high competitive pressure in their respective ecologies. This correlation can be attributed to the presence of a high density of groups in areas rich in human resources.
In this section, we apply statistical models to evaluate hypotheses. Table 1 presents three models, formally testing the first three hypotheses. The unit of analysis is the person-year. Model 1 formalizes the intuition observed in Figure 6 for a power relationship between the total population size and individual participation rates, with a 10-fold increase in population resulting in a 68 percent increase in the number of events participated in. Model 2, regressing individual activity on competitive pressure, confirms Hypothesis 2, which asserts that individuals located in a competitive niche are more likely to engage in group events, compared with those in a less competitive niche.
Mixed-Effects Models Predicting Individual Participation Rates with City and Year Random Effects.

p < .005.
In model 3, we add competitive pressure as a mediator in addition to the main predictor of aggregate size. Comparing model 1 with model 3 shows a significant decrease in the coefficient of total population size, dropping from 0.225 to 0.100 when competitive pressure is considered. This decrease indicates that a 10-fold increase in population results in a 26 percent increase in participation numbers, representing a 62 percent decrease in comparison with model 1. Additionally, the coefficient of competitive pressure exhibits a positive correlation with individual participation rates and is statistically significant. Appendix B presents a formal mediation analysis (Baron and Kenny 1986). These results support Hypothesis 3, which suggests that competition mediates the impact of the total population size on individual participation rates. Essentially, an increase in number of groups in Meetup communities elevates competitive pressure that individuals face, resulting in an overwhelming number of potential events for individual members to attend.
Result 3: Structural Conduciveness of Social Overload
To adjudicate Hypotheses 4a and 4b, Table 2 presents the results of mixed-effects models that predict two structural properties of groups: external affiliations (i.e., the average number of external memberships) and internal cohesion (i.e., the proportion of individuals in a k-connected component). The unit of analysis is the group-year. A mixed-effects model with random intercepts for each city was used, and lagged dependent variables were included to eliminate autocorrelation. Competitive pressure was calculated at the group level by taking the mean of all participants within a group. Model 2 demonstrates a positive relationship between logged competition that a group experiences and the average number of external affiliations that group members have, while controlling for other variables. Specifically, a 10-fold increase in group competition corresponds to a 25 percent increase in the number of external affiliations that an average member holds. This finding does not support Hypothesis 4a, which posits that greater competitive pressure is associated with rigid boundaries and strengthened membership demand as predicted by the mutual exclusion thesis. Instead, it supports Hypothesis 4b, that is that members of groups under severe competition tend to divide their time, maintaining as many group affiliations as possible. As a result, knowledge groups on Meetup.com are more connected with their competitors as local competition intensifies.
Coefficients of Random-Effects Models Predicting Groups’ External Affiliations and Internal Cohesion.

p < 0.05. **p < 0.01. ***p < 0.001.
Model 4 examines the effect of competition on group cohesion and reveals a negative correlation between the two variables. As the competition faced by a group intensifies, the proportion of members within a highly cohesive network decreases. A 10-fold increase in competition corresponds to an 11 percent reduction in the proportion of members who belong to a five-component graph. These findings are consistent with Hypothesis 4b (but not Hypothesis 4a), which posits that groups experiencing intense competition exhibit reduced levels of cohesion. Additionally, the lagged k-component ratio term is found to be significantly and positively associated with the current k-component ratio, and this association remains unchanged after adjusting for the group’s average competitive pressure.
In summary, the results of our statistical analysis support the hypothesis that increased competition in local areas is associated with reduced group cohesion and increased external affiliations among group members. Specifically, as the level of competition faced by a group increases, we observe a decrease in the proportion of members who are in a highly cohesive network and an increase in the average number of external affiliations held by group members. These findings provide evidence that as competition intensifies, individuals tend to subdivide their time among multiple groups, resulting in less cohesive networks and greater interconnectedness with competitors.
Discussions and Conclusions
We have proposed a dynamic theory of niche competition that integrates the systemic dynamics and individual behavior in voluntary associations. A new formulation of niche ecology based on event participation data has been developed. Our findings indicate a positive relationship between community size and individual participation in knowledge communities, with a power function describing this relationship. Furthermore, we examined a mediating mechanism for this size dependency of participation and found evidence supporting the role of local niche competition as a mediating factor. Furthermore, our analysis revealed the impact of niche competition on network structure, where networks among individual members in a highly competitive organizational niche tend to be expansive toward external groups but lack internal cohesion. Taken together, these results provide support for the social overload explanation, but not the mutual exclusion thesis, for the differential patterns of participation in voluntary knowledge groups in large and small metropolitan areas.
Implications for Sociology of Voluntary Associations
These findings have the potential to shape new lines of inquiries in sociological studies of voluntary associations and organizational ecology by raising new questions about social and ecological processes. McPherson’s (1983) Blau space was an early attempt to examine the dynamic relationship between organizational form and underlying niche positions, rather than treating one as a proxy for the other (Hannan and Freeman 1986). However, Blau space relies heavily on a model of “social space” in which organizational membership diffuses. Although social connections (as approximated by closeness on Blau dimensions) may have been the primary means of accessing information in primitive and industrial societies, their effectiveness and role in information diffusion have diminished in an era where novel information is easily accessible through computer-mediated means. Our approach broadens the applicability of ecological thinking to a wider range of membership ecologies in which searching, imitating, and adopting new knowledge through digital channels have become the primary mode of information diffusion. In such ecosystems, the meaning of knowledge topics and groups is recognized and enacted through the collective attention and selective participation (Mohr et al. 2020), and individual participants learn and acquire the meaning of and preferences toward topics and groups through direct interactions with the content (and to a much less extent through social networks) (Shi and Shi 2023). In this sense, our approach of mapping behavioral data of actual event participation is consistent with the notion of a “logic space” (Friedland and Alford 1991; Mohr and Guerra-Pearson 2010) in which the location and width of niches are emergent from collective behavior. Thus, future research can explore how cultural processes shape both individual adaptation to new organizational forms that are, to some extent, influenced by the cultural activities of members.
Our methodology contributes to the ecology approach of voluntary associations as it does not rely on predetermined structure of the ecology (unlike Blau space, where sociodemographic attributes are preselected). Instead, the latent dimensions are co-constituted by individual participants collectively enacting a field that is meaningful in relation to the inherent relationship among topics. This bottom-up method aligns with the growing interest in the sociology of culture in measuring cultural meanings in objects through collective attention (Mohr et al. 2020).
The primary focus of this study is to gain an understanding of size-dependent individual behavior, a topic concerning classic sociologists such as Simmel, Wirth, and Milgram. Research has shown that individuals living in large metropolises often experience higher levels of anxiety, loneliness, and violent crime but also exhibit higher levels of innovation and better connectivity. Although the scaling of social behaviors in urban environments has been widely documented in recent studies, the underlying mechanisms remain unclear. Our meso-level approach offers a potential framework for explaining a range of scaling phenomena. To gain insight into this phenomenon, we propose examining the position and characteristics of the ecological niches occupied by individuals. By identifying the factors that determine the level of competitiveness and resource availability within a local niche, and how individuals within that niche respond to these pressures, we may be able to gain a deeper understanding of the mechanisms underlying the observed scaling of social behaviors in urban environments.
One limitation of this study is its focus on the ecological processes arising from social actions, without accounting for the geographic factors that may shape group formation and competition. For instance, cities such as San Francisco tend to be divided into multiple clusters, with fewer joint events taking place between them than within them. While our methods of coparticipation can consider various crucial factors, such as interests, identity, geography, and social connections, that contribute to the innate similarity between social groups, future studies should aim to isolate and analyze these factors, specifically exploring how the geographic distribution of institutional resources shape the formation of voluntary associations of knowledge workers (Saxenian 1996).
Implications for Studies of Knowledge Economy
Our ecological approach has the potential to revise the understanding of the dynamics of the knowledge economy, where informal associations of knowledge workers have become crucial foci for the diffusion of knowledge, including know-how, technology fads, entrepreneurial skills, and social capitals. This knowledge is a valuable asset for individuals’ advancement in the labor market and for the research and development of high-tech companies (DellaPosta and Nee 2020; Owen-Smith and Powell 2004; Powell and Snellman 2004). Over the past two decades, the proliferation of digital technologies has had a significant impact on the knowledge economy by empowering a large number of individuals through the formation of communities, enhancement of knowledge sharing and integration, and emergence of new forms of social organization of knowledge (Lin and Maruping 2022). Online collaborative platforms such as GitHub and Stack Overflow, as well as platforms that facilitate both in-person and virtual events, have become popular venues for knowledge workers to share information, find collaborators, and engage in networking and socialization. These digital platforms are designed to break down barriers in specialized knowledge domains and formal organizations, and provide access to essential resources for marginalized groups who have traditionally been excluded from institutionalized knowledge systems (Adams et al. 2019; Curran 2021; Nee and Drouhot 2020). The focus of this study is on the informal channels of knowledge diffusion and entrepreneurship among ordinary knowledge workers, rather than institutionalized players such as CEOs, managers, scientists, and professors. Our work offers a new perspective on understanding the dynamics of the knowledge economy and the role of digital technologies in facilitating knowledge sharing and integration. The findings of this study have implications for social policy and interventions aimed at enhancing communication and productivity within a knowledge economy. This can be achieved through not only increasing overall competition but also by creating a network structure that facilitates the cascading of information and innovation across boundaries of technological communities.
Footnotes
Appendix A: Description of the Meetup.com Dataset
Figure A1 illustrates the basic layout design of the home page of the technology Meetup group NYC Open Data. The home page includes group-level information such as the group name (also the group ID provided by the Web site), the organizers, a profile summary (i.e., “What we’re about”), and group topics (i.e., “Related Topics”), which were collected for the analysis. However, other information displayed on the home page, such as photos, group discussion, and event recommendations were not included in the data collection process.
At the event level, we collected information on past events up to the time of data collection. Figure A2 shows an example of a past event hosted by NYC Open Data. The information collected for each event includes event time, location (address and geolocation), and attendees (individuals who responded “Attend” to the event). We use a user’s “yes” response to the RSVP as a proxy of participation. Although we do not have information on a participant’s actual attendance, it is possible to confirm the reliability of this measure as participation. A previous study interviewing the organizers of selected groups on Meetup.com suggests that approximately two-thirds of people who had RSVP’d would attend the event (Ricken, Barkhuus, and Jones 2017). Additionally, organizers would come up with strategies to prevent “no-shows,” such as temporary suspension or membership removal (Ricken et al. 2017).
Appendix B: Mediation Analysis for Table 1
We conducted a four-step Baron-Kenny procedure, and the results confirm the mediation effect of competitive pressure on mediating the independent and dependent variables.
In step 1, we used a model with aggregate size (logged) as the predictor and participation rates as the outcome variable. The analysis yields an effect coefficient of 0.56 (t = 19.30, p < .001), indicating a significant relationship between aggregate size and participation rates. This step establishes that there is an effect that may be mediated.
Moving to step 2, we used another model, using aggregate size (logged) as the predictor and competitive pressure (logged) as the outcome variable. This analysis results in an effect coefficient of 0.818 (t = 55.0, p < .001), establishing a significant association between aggregate size (logged) and competitive pressure (logged). In essence, this step treats the mediator as if it were an outcome variable.
In step 3, we constructed a multiple regression model with both aggregate size (logged) and competitive pressure (logged) as predictors and participation rates as the outcome variable. The analysis reveals an effect coefficient of 0.149 (t = 535.27, p < .001). The mediation effect estimate is calculated as 0.818 × 0.149, resulting in 0.122.
In step 4, on the basis of the findings from step 3, we ascertained that the direct effect of 0.100 (t = 18.1, p < .001) is also statistically significant. Consequently, we concluded that there exists a situation of partial mediation.
Acknowledgements
Preliminary versions of this article were presented at the annual meeting of the American Sociological Association in Los Angeles. We would like to thank Freda Lynn, Jennifer Glanville, Bogdan Ion Vasi, and Elizabeth Menninga for their helpful suggestions. All remaining errors are strictly the responsibility of the authors.
Funding
The author(s) disclosed receipt of the following financial support for the research, authorship, and/or publication of this article: This research was supported by grant 2048670 from the National Science Foundation.