
Abstract
Sociologists and demographers often use Lexis diagrams to visualize temporal data. However, the traditional Lexis plot arranges the data in a matrix of right triangles, with age on the vertical axis and period on the horizontal axis. This representation of the data subordinates cohort to an off-diagonal of unequal length. Not only does this violate the proportionality principle of effective statistical graphics, but it implicitly treats cohort as a residual or epiphenomenal dimension and makes it difficult to compare variation within and across cohorts. As an alternative, the author introduces the Ryder plot, a novel graphical tool that displays cohort, age, and period data as a grid of equilateral triangles, thereby providing an unbiased representation of all three dimensions and facilitating the analysis of intra- and intercohort variability. The author uses Ryder plots to chart the rise and fall of verbal ability in the United States, revealing two epochs of social change across three centuries of cohorts.
Researchers frequently use Lexis plots to visualize temporal data organized by age, period, and cohort. The conventional Lexis plot, named after the German demographer and social scientist Wilhelm Lexis, displays temporal data as a rectangular grid of right triangles with age on the vertical axis and period on the horizontal axis (Keiding 1990). These right triangles form squares that are typically labeled or shaded on the basis of values in the data, thereby enabling the identification of overall trends and patterns within a multidimensional coordinate system (see, e.g., Jolley and Giles 1992).
It is not generally recognized, however, that the conventional Lexis plot violates a fundamental principle of effective statistical graphics, namely, that of the proportionality between the data and the graphical elements used to represent the data (see Tufte 2001:56). This criticism has been eloquently articulated by the sociologist and demographer Norman Ryder. 1 As he put it, there is a “geometric problem” in a typical Lexis plot because “a rectangular grid makes the hypotenuse [of each right triangle] appear to have a length which is the length of a horizontal or vertical side multiplied by the square root of two” (Norman Ryder Papers [NRP], Box 4, June 1979). In reality, however, the “units of length of all three—period, age, and cohort—are the same” (NRP, Box 4, June 1979). 2
A related problem is that, by relegating cohort to an off-diagonal of unequal length, the conventional Lexis plot introduces a systematic bias against cohort, notwithstanding “its theoretical cogency” (NRP, Box 5, April 7, 1978). 3 In practice, this means that researchers end up “highlighting the row and column” dimensions of the Lexis plot, “forgetting the implicit diagonal” (Ryder 1981:127). Likewise, cohort is frequently modeled as a residual or tertiary axis of variation, subordinate to the age and period dimensions (see, e.g., Keyes and Li 2010; Ohtaki, Kim, and Munaka 1990).
To overcome these limitations, Ryder proposed what may be termed a Ryder plot, which “sets the three kinds of lines at 60 degrees to one another” so that each temporal dimension is represented “symmetrically” (NRP, Box 5, July 23, 1976; see also NRP, Box 4, June 1979; NRP, Box 3, 1992; NRP, Box 3, n.d.). Instead of a rectangular grid of right triangles, a Ryder plot consists of a rhombus-shaped lattice of equilateral triangles (NRP, Box 4, n.d.; cf. Keiding 1990:488–89). 4 This not only faithfully represents the underlying time scales but also facilitates the analysis of “intra-cohort temporal development,” or life-cycle change, as well as “inter-cohort temporal differentiation,” or social change (Ryder 1965:861; see also Fosse 2023).
Figure 1 shows Ryder plots of verbal ability in the United States across three centuries of cohorts. The top plot in Figure 1a shows estimates from a regression model with age, period, and cohort parameters that have been reindexed in terms of age and cohort, while the bottom plot in Figure 1b shows the corresponding estimates purged of the overall (cohort-invariant) age curve (see Fosse 2023). 5 The numbers in the triangles indicate the average number of words correct on a 10-item vocabulary test, with higher values indicating greater verbal ability. Horizontal lines (0°) represent ages, positive diagonals (60° counterclockwise from horizontal) represent cohorts, and negative diagonals (120° counterclockwise from horizontal) represent periods. Variability within the positive diagonals indicates shifts in verbal ability as cohorts age (or life-cycle change), and variability across the positive diagonals indicates shifts across cohorts (or social change).
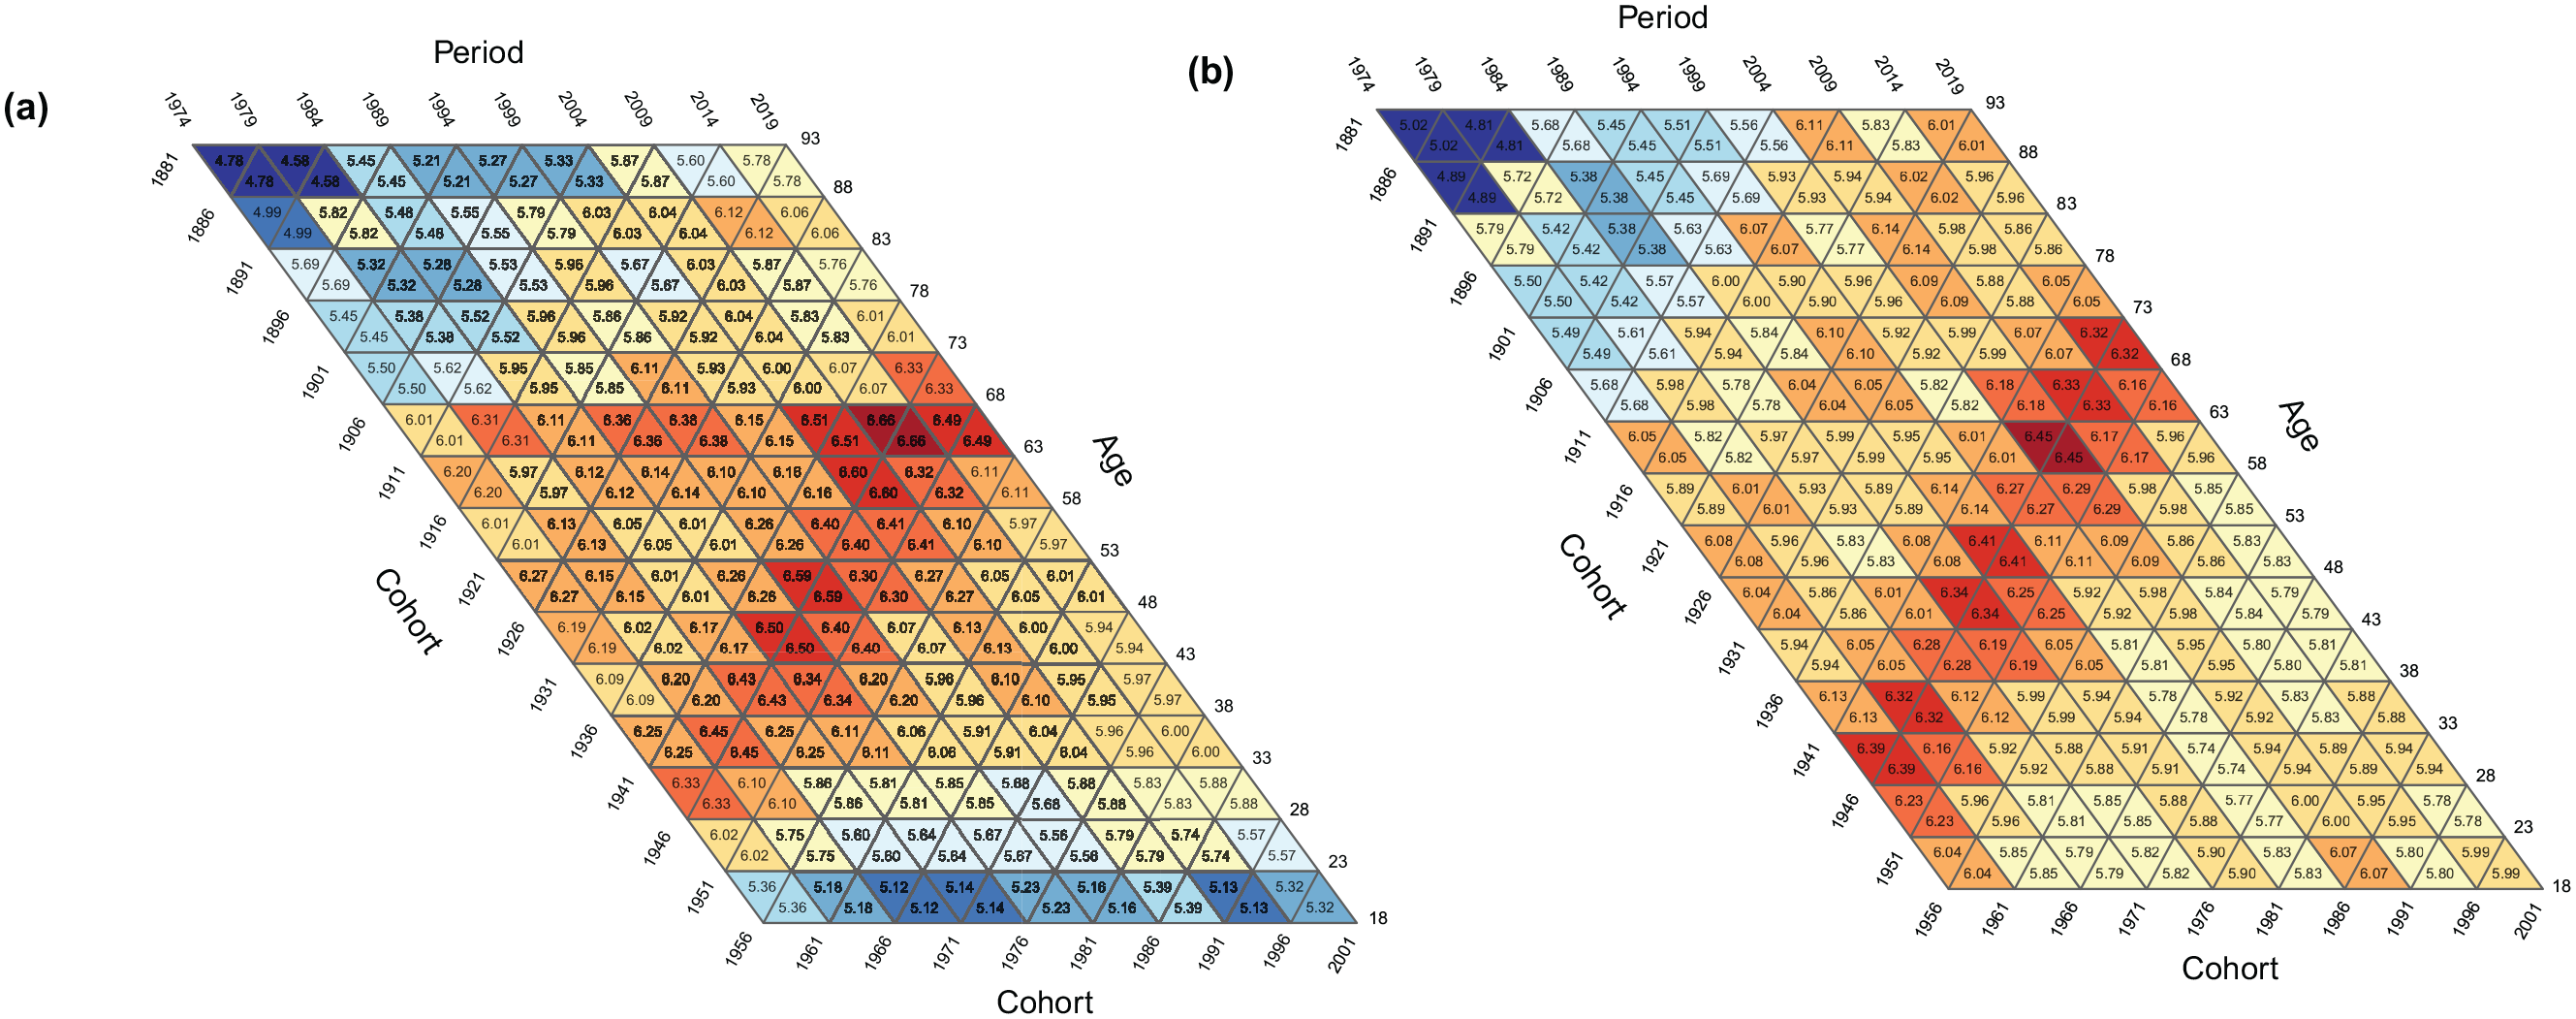
Ryder plots of verbal ability in the United States. (a) Estimates of verbal ability across age, period, and cohort dimensions. (b) The same estimates purged of the overall age curve.
Three important findings are revealed by Figure 1. First, some of the observed decline in verbal ability among more recent cohorts, as shown by the concentration of blue cells in the lower part of Figure 1a, is artifactual, reflecting the fact that more recent cohorts are also observed at younger ages. This is revealed by the absence of a steep decline among the youngest age groups in Figure 1b, which, as noted above, is based on estimates that have been purged of the overall age curve. Second, both plots show that verbal ability increased substantially across cohorts until those born in the mid–twentieth century. The peak appears as a red positive diagonal corresponding to the 1941 to 1950 cohort group, which had the highest overall level of verbal ability. Finally, both plots show that verbal ability declined significantly after the cohorts born in World War II, falling to levels roughly equivalent to those of the cohorts born in the 1910s. This profound social transition aligns with the narrative of two distinct epochs of verbal ability: an initial rise prior to World War II, fueled by advancements in education and public health investments (e.g., see Alwin and McCammon 2001), followed by a subsequent post–World War II decline due to the widespread adoption of television and other new media (e.g., see Glenn 1994).
In summary, the Ryder plot is a useful, highly informative tool for visualizing temporal data that overcomes the limitations of the traditional Lexis plot. By adhering to the proportionality principle, which states that the visual size of graphical elements should correspond directly to the numerical quantities they represent, it provides an unbiased representation of each dimension and facilitates the comparison of intra- and intercohort variability. It is expected that the widespread application of Ryder plots will provide new insights into the scale and scope of social change across a range of phenomena.
Supplemental Material
sj-pdf-1-srd-10.1177_23780231231197302 – Supplemental material for Visualizing Social Change with Ryder Plots: The Rise and Fall of Verbal Ability in the United States
Supplemental material, sj-pdf-1-srd-10.1177_23780231231197302 for Visualizing Social Change with Ryder Plots: The Rise and Fall of Verbal Ability in the United States by Ethan Fosse in Socius
Footnotes
Supplemental Material
Supplemental material for this article is available online.
Notes
Author Biography
References
Supplementary Material
Please find the following supplemental material available below.
For Open Access articles published under a Creative Commons License, all supplemental material carries the same license as the article it is associated with.
For non-Open Access articles published, all supplemental material carries a non-exclusive license, and permission requests for re-use of supplemental material or any part of supplemental material shall be sent directly to the copyright owner as specified in the copyright notice associated with the article.