
Abstract
Generalized trust has been one of the most frequently examined constructs since researchers first introduced measures of it in the 1940s. Despite its significance, there is a growing consensus that traditional measures of generalized trust are prone to measurement invalidity and nonequivalence, calling into question sociological knowledge about generalized trust. In this article, I advance trust research in sociology by (1) refining two new self-report measures of generalized trust—the Stranger Face Trust scale (SFT) and the Imaginary Stranger Trust scale (IST)—and (2) assessing their empirical performance on a nationally representative probability sample (N = 1,264). I compare the reliability and validity of SFT, IST, and traditional measures of generalized trust across a range of measurement validation tests. Results suggest that SFT provides the most accurate and consistent measure of generalized trust.
In the study of beliefs and values, generalized trust has been one of the most continuously examined constructs since researchers first introduced measures of it in the 1940s. Rotter (1967:653) defined generalized trust early on as a “generalized expectancy” of a certain level of reliability from strangers that is learned over a lifetime. More recent definitions view generalized trust as the optimism and unconditional faith people have in unknown others (Uslaner 2002; Yamagishi and Yamagishi 1994) or the baseline starting point at which people (dis)trust strangers for any number of matters (Bauer and Freitag 2018; Colquitt, Scott, and LePine 2007; Erikson 1950; Robbins 2016b). Simply put, generalized trust is the idea that people possess a “standard estimate of the probability of trustworthiness, p*, for the average person he [or she] meets” (Coleman 1990:104; see also Hardin 2002:116–26).
Throughout this literature, leading scholars consider trust in generalized others as a core feature of civil society, political culture, and social capital (Coleman 1990; Fukuyama 1995; Inglehart 1997; Paxton 2007; Putnam 2000; Uslaner 2002; Verba, Scholzman, and Brady 1995). In modern society, generalized trust is the “basis of reciprocity, social connectedness, peaceful collective action, inclusiveness, tolerance, gender equality, confidence in institutions, and democracy itself” (Delhey, Newton, and Welzel 2011:787). Because of this—and the fact that generalized trust “lubricate[s] the inevitable frictions of daily life” (Putnam 2000:135)—countless studies are published annually on the causes and consequences of generalized trust at multiple levels of analysis (for reviews, see Dinesen, Schaeffer, and Sønderskov 2020; Nannestad 2008; Schilke, Reimann, and Cook 2021; Smith 2010; Uslaner 2018), with some pointing to the deterioration of community and politics as a result of declining generalized trust (Paxton 1999; Putnam 2000).
Notwithstanding its importance, problems of measurement invalidity and nonequivalence plague studies of generalized trust. Due to these measurement problems, “it is difficult for researchers to identify whether scientific discoveries using [traditional measures] are—or will be—a function of true patterns and relations or an artifact of measurement” (Robbins 2021:30). According to some scholars, these issues of validity are so grim that the accumulation of sociological knowledge about generalized trust will undoubtedly suffer if sociologists continue to use traditional measures (Bauer and Freitag 2018; Hardin 2002; Robbins 2021, 2022). Despite attempts by researchers to correct this deficiency over the past two decades (Bauer and Freitag 2018; Delhey et al. 2011; Miller and Mitamura 2003; Reeskens and Hooghe 2008; Sturgis and Smith 2010; Torpe and Lolle 2011; van Hoorn 2014), major advances in the measurement of generalized trust have been rare.
Recently, however, trust scholars have proposed a solution. To properly measure generalized trust, Bauer and Freitag (2018:29) argue that it is necessary to average trust “across many situations that [entail] a variety of trustees, expected behaviors, and contexts. To avoid confusion, we suggest using the term ‘cross-situational trust.’” In a series of articles, Robbins (2021, 2022, 2023) actualized Bauer and Freitag’s (2018) vision by designing two new measures of generalized trust: a Stranger Face Trust Scale (SFT) and an Imaginary Stranger Trust Scale (IST). The first scale, SFT, shows respondents the faces of six strangers drawn from the Chicago Face Database (Ma, Correll, and Wittenbrink 2015), strangers who vary in their perceived gender (men and women) and race (White, Black, Latinx). Respondents then rate the degree to which they trust each stranger on four matters (e.g., looking after a loved one, repaying a loan, etc.). The second scale, IST, asks respondents to imagine meeting a complete stranger for the first time and then to indicate the extent to which they would trust this imaginary stranger on the four aforementioned matters. SFT was designed as a long-form questionnaire, and IST was designed as a short-form questionnaire for easy administration by the research community.
With these newly proposed scales, Robbins (2021, 2022, 2023) assessed their face validity and content validity and performed various measurement validation tests. Using a mix of cross-sectional and two-wave convenience samples from the general population and a behavioral economics subject pool, Robbins (2021, 2022, 2023) found strong empirical support for the reliability, validity, and measurement invariance of SFT and IST. Robbins (2021, 2022, 2023) also detailed how traditional measures of generalized trust are less valid and exhibit greater measurement nonequivalence than SFT and IST.
The current study develops broader versions of SFT and IST and demonstrates their utility as standard measures of generalized trust. I improve on previous research by including two new racial categories (East Asian and South Asian) and two new low-cost matters, resulting in short- and long-form versions of SFT and IST: SFT-24 (6 faces, four matters), SFT-60 (10 faces, six matters), IST-4 (four matters), and IST-6 (six matters). Analyses of a nationally representative probability sample (N = 1,264) and a follow-up study of a one-shot investment game (N = 600) support the conclusions of Bauer and Freitag (2018) and Robbins (2021, 2022, 2023): Operationalizations of “cross-situational trust” provide reliable and valid measures of generalized trust. Specifically, SFT-24 and SFT-60 are more reliable (internal consistency) and valid (convergent, discriminant, and predictive) than IST-4 and IST-6, which are, in turn, more reliable and valid than traditional measures of generalized trust. The consistency of results across studies indicates the quality of SFT and IST in measuring generalized trust. Widespread use of SFT and IST will (1) ensure that researchers are validly and reliably measuring the concept of generalized trust, (2) reduce measurement error on the left and right sides of statistical models, and (3) increase our ability to compare results across groups and over time.
A Brief History of Measuring Self-Reports of Generalized Trust
One of the first measures of generalized trust was a single-item “most-people trust” question developed by the Office of Public Opinion Research (1942) in the United States. The survey question asked: “Do you think most people can be trusted?” with response options of “yes,” “no,” and “no opinion.” A decade and a half later, Rosenberg (1956) refined this measure and developed a balanced version of the question: “Some people say that most people can be trusted. Others say you can’t be too careful in your dealings with people. How do you feel about it?” This question, along with four other items, was used by Rosenberg (1956) in a “faith in people” Guttman scale. About a decade later, Almond and Verba (1963) used Rosenberg’s questions in their pioneering comparative study of civic culture. Almond and Verba’s (1963) study subsequently laid the groundwork for contemporary research on political culture, social capital, and trust.
Modified versions of these questions have been used for decades in some of the largest general population surveys, including the U.S. General Social Survey, the European Values Study, the Gallup World Poll, and the World Values Survey. These data sets inform much of what we know about generalized trust, such as the positive correlation between age and trust (Clark and Eisenstein 2013; Putnam 2000; Robinson and Jackson 2001), ethnoracial differences in generalized trust (Douds and Wu 2018; Evangelist 2022; Wilkes 2011), the links between personality and generalized trust (Andersson 2012; Freitag and Bauer 2016; Uslaner 2002), and contextual effects like ethnic heterogeneity, intentional homicide, and income inequality (Alesina and La Ferrara 2002; Marschall and Stolle 2004; Messner, Rosenfeld, and Baumer 2004; Putnam 2000, 2007; Rosenfeld, Baumer, and Messner 2007; Rothstein and Uslaner 2005; Uslaner 2002, 2012).
Since Rosenberg’s (1956) seminal work, interest in the self-report measurement of generalized trust has grown dramatically, with important lines of research addressing (1) the number of items to include, (2) the unidimensionality or multidimensionality of generalized trust, (3) the length of answer scales, and (4) the extent to which scales and concepts in questions about generalized trust are interpreted the same way across respondents. I review this work in more detail below.
First, there is considerable debate over whether to use single-item measures of generalized trust or multiitem scales. Uslaner (2011, 2015) strongly defends the use of standard single-item measures such as the “most people trust” question, whereas others—who draw on classical test theory—claim that multiitem scales increase reliability and allow for the correction of measurement error (Freitag and Bauer 2013; Glanville and Paxton 2007). Assuming that a set of indicators is a valid measure of a latent construct, multiitem scales should be used over single-item measures. In sociology and political science, for instance, generalized trust is often measured using a modified version of Rosenberg’s (1956) “faith in people” scale, known as the “misanthropy scale” (Brehm and Rahn 1997; Paxton 1999; Reeskens and Hooghe 2008; Zmerli and Newton 2008), or a multiitem generalized social trust scale that asks about trust in people of another nationality, another religion, and people one meets for the first time (Delhey et al. 2011; Freitag and Bauer 2013; Newton and Zmerli 2011; Robbins 2016a). The advantage of these well-known multiitem generalized trust scales is that they adjust for measurement error with a limited number of survey items, making them attractive for large-scale population surveys with limited space. Despite these advances, a substantial body of work in the social sciences continues to use single-item measures of generalized trust (Alesina and La Ferrara 2002; Kiley and Vaisey 2020; Knack and Keefer 1997; La Porta et al. 1997; Nunn and Wantchekon 2011; Paxton 2007; Paxton and Glanville 2015; Tabellini 2010).
The second historical development in the measurement of generalized trust concerns its dimensionality, that is, whether there are different forms of generalized trust that can be captured by measurement models (Delhey et al. 2011; Freitag and Bauer 2013; Freitag and Traunmüller 2009; Newton and Zmerli 2011; Whiteley 2000). For instance, if a subset of indicators (among a larger set) correlates with each other but not with others, this suggests that the subset of indicators captures something other than generalized trust, such as particularized trust (Freitag and Traunmüller 2009; Glanville and Paxton 2007), identity-based trust (Freitag and Bauer 2013), or in-group/out-group trust (Delhey et al. 2011). Identifying these alternative forms of trust has allowed scholars to further refine the measurement of generalized trust and improve statistical estimates.
A third, more recent, development concerns the use of different answer scales (Lundmark, Gilljam, and Dahlberg 2016; Uslaner 2011, 2015), that is, whether indicators of generalized trust should use binary response options (e.g., “yes” or “no”) or longer answer scales (e.g., “do not trust at all,” “do not trust very much,” “trust somewhat,” etc.). Evidence suggests that longer answer scales are less prone to error than dichotomous or binary response options (Krosnick and Fabrigar 1997). For example, Lundmark et al. (2016) find that longer answer scales tend to produce stronger correlations with criterion measures than dichotomous answer scales and increase the level of detail with which latent factors of generalized trust can be measured.
The fourth and perhaps most contentious debate concerns equivalence of measurement, that is, whether the answer scales and terms used in questions about generalized trust are interpreted the same way across groups, respondents, and time (Bauer and Landesvatter 2022; Delhey et al. 2011; Dinesen 2011; Freitag and Bauer 2013; Reeskens and Hooghe 2008; Sturgis and Smith 2010; Torpe and Lolle 2011; Uslaner 2002). Issues of measurement equivalence are of fundamental importance. If one group of respondents interprets survey questions about generalized trust differently than another group of respondents, then an observed difference between the two groups would not be a function of true differences in generalized trust. Instead, these differences would be an artifact of measurement. As Reeskens and Hooghe (2008:516) ask: “Does the concept of ‘most people’ have the same meaning for a respondent in the middle of the metropolitan areas in London or Paris, as it has for a respondent in some remote village in the north of Sweden?”
Most research in this area suggests that traditional measures of generalized trust exhibit measurement nonequivalence (or measurement noninvariance). Although early research using think-aloud approaches and open-ended questions found that the “most people trust” question “brings up general evaluations of society” (Uslaner 2002:19), later research has shown that the concept of “trusting most people” means different things to respondents (Bauer and Landesvatter 2022; Miller and Mitamura 2003) and that the interpretation of “most people” can lead to biased responses (Sturgis and Smith 2010; see also Bauer and Freitag 2018). Similarly, research using multigroup confirmatory factor analysis has found that the three-item misanthropy scale is not sufficiently equivalent across European societies (Reeskens and Hooghe 2008), whereas items from the generalized social trust scale exhibit measurement equivalence across some ethnic groups and countries (Freitag and Bauer 2013). Relatedly, research by Delhey et al. (2011) and Torpe and Lolle (2011) shows that the radius of generalized trust—or how wide a circle of generalized others respondents imagine as “most people”—varies considerably across countries (see also van Hoorn 2014).
In summary, ever since the original “most people trust” question, measures of generalized trust have gone through phases of refinement. In spite of these developments, issues of reliability, validity, and measurement nonequivalence remain, casting doubt on the associations and trends observed in the literature and the scientific community’s ability to make comparisons across studies, countries, and time.
Recent Advances in the Measurement of Generalized Trust
In a series of recent articles, Robbins (2021, 2022, 2023) offers solutions to many of the debates surrounding the measurement of generalized trust. Inspired by the idea that generalized trust is best measured as “an average across many situations that entails a variety of trustees, expected behaviors, and contexts” (Bauer and Freitag 2018:29), Robbins (2022) proposes two new self-report measures of generalized trust: a Stranger Face Trust scale (SFT) and an Imaginary Stranger Trust scale (IST). The first scale, SFT, shows respondents the faces of six strangers drawn from the Chicago Face Database (Ma et al. 2015) and asks respondents to assess each stranger on four matters for which trust is placed. The faces vary by gender (men and women) and race (White, Black, Latinx), and the matters concern pecuniary and nonpecuniary behaviors of general interest to individuals (e.g., looking after a loved one, repaying a loan, etc.). The second scale, IST, asks respondents to imagine meeting a total stranger for the first time and to indicate the extent to which they would trust the imaginary stranger on the four matters previously mentioned (e.g., repaying a loan). SFT was designed as a long-form questionnaire, and IST was fashioned as a short-form questionnaire for ease of administration by the research community.
Robbins (2022) bases the development of SFT and IST on two key assumptions:
Generalized trust is best assessed in a person-specific manner: If person A is a high generalized truster, he or she should trust persons C, . . . Z, regardless of the trust object, more than person B, who is a low generalized truster (Bauer and Freitag 2018; Coleman 1990; Cook, Hardin, and Levi 2005; Hardin 2002; Robbins 2016b).
Generalized trust is best assessed in an object-specific manner: If person A is a high generalized truster, he or she should trust person C more for any trust object than person B, who is a low generalized truster (Bauer and Freitag 2018; Coleman 1990; Cook et al. 2005; Hardin 2002; Robbins 2016b).
With these two assumptions and ideas from classical test theory, Robbins (2022:8) treats “generalized trust as a latent construct in which observed indicators of generalized trust manifest as assessments of trustworthiness for particular matters (in the case of SFT and IST) regarding specific strangers (in the case of SFT).” If generalized trust is a baseline starting point from which people (dis)trust strangers for any number of matters (Bauer and Freitag 2018; Colquitt et al. 2007; Erikson 1950; Robbins 2016b), then “the average of the assessments of trustworthiness across particular matters and specific strangers is the ideal measurement of generalized trust” (Robbins 2022:312). By providing respondents with specific strangers and particular matters, Robbins (2022) argues that issues of measurement equivalence, such as the interpretation of “most people” (Bauer and Freitag 2018; Miller and Mitamura 2003; Reeskens and Hooghe 2008; Sturgis and Smith 2010), the “radius of trust” problem (Delhey et al. 2011; Torpe and Lolle 2011; van Hoorn 2014), and what respondents trust “most people” to do (Robbins 2016b), are mitigated.
Robbins (2022) contends, as a result, that SFT and IST have greater face validity and content validity than traditional measures of generalized trust. Through a series of measurement validation tests, Robbins (2021, 2022, 2023) establishes the reliability (internal consistency, test-retest reliability), validity (factorial, convergent, discriminant, concurrent, predictive, known groups), and measurement equivalence of SFT and IST across demographic groups, samples, and time. He also shows that common generalized trust scales—the Misanthropy Scale (MST) and Generalized Social Trust Scale (GST)—appear to be less valid, less reliable, and less equivalent across demographic groups than SFT and IST. Finally, Robbins (2021, 2022) shows that social desirability bias has minimal influence on SFT and IST and that evaluations of SFT are not driven by cultural stereotypes or identity effects. 1
In spite of these advances, a number of questions and tests remain. MST and GST are well-established measures of generalized trust that have been used for decades in representative random samples, both nationally and cross-nationally. The representation of SFT and IST has not been established to the same degree. A key question is whether the findings of Robbins (2021, 2022, 2023) hold when applied to a representative probability sample of U.S. respondents. For instance, is the observed negative correlation between age and SFT representative of U.S. adults or a product of sampling bias (see Robbins 2022)? Another key question is whether SFT and IST correlate with state-level measures of intentional homicide, ethnic fractionalization, and income inequality, as previously observed in the literature using traditional measures of generalized trust (Dinesen et al. 2020; Messner et al. 2004; Putnam 2000; Rosenfeld et al. 2007; Rothstein and Uslaner 2005; Uslaner 2002). Investigating whether these state-level correlations hold for SFT and IST is an important research endeavor that will help adjudicate between existing accounts of generalized trust.
Beyond sample representation, previous validation tests supporting SFT and IST are limited to three racial categories (White, Black, Latinx) and/or high-cost pecuniary and nonpecuniary matters (e.g., keeping a secret, watching after a loved one, etc.). Expanding the ethnoracial diversity of faces is important for measuring generalized trust because “trust in other people is general when it includes remote and dissimilar others (i.e., outgroups)” (Delhey and Welzel 2022:46, emphasis added). As Delhey et al. (2011:786) argue, a valid measure of generalized trust will predominantly connote out-groups more than in-groups. With respect to trust objects, many of the previous indicators concern matters about which people trust proximal and similar others, such as friends and family. Adding two new trust objects about matters for which people commonly (dis)trust strangers, such as returning a lost wallet or purse, should strengthen face validity and content validity. To address these issues, the current article extends the empirical scope of SFT and IST by increasing the diversity of faces (in the case of SFT) and trust objects (in the case of SFT and IST).
Finally, although the validity of SFT and IST has been established, Robbins (2022) assessed the discriminant validity of his measures on a small number of variables and tested the predictive validity of his scales on a small sample of university students (Robbins 2021). Given that generalized trust is a belief (Bauer and Freitag 2018; Coleman 1990; Hardin 2002; Robbins 2016b), do SFT and IST discriminate from a broader set of psychological variables that measure attitudes and preferences, such as unconditional altruism and betrayal aversion (Falk et al. 2018)? And does the predictive validity of SFT and IST replicate in a larger, general population probability sample of U.S. respondents?
Data and Methods
Sample
An online survey and a behavioral economics experiment were coded and administered by the University of Chicago’s National Opinion Research Center (NORC). A general population probability sample of U.S. adults age 18 years and older was selected for this study from NORC’s AmeriSpeak Panel. The sample was selected using sampling strata based on age, race/Hispanic ethnicity, education, and gender (48 sampling strata in total). The size of the sample selected per sampling stratum was determined by the population distribution of each stratum. In addition, sample selection took into account expected differential survey completion rates by demographic groups so that the set of panel members with a completed interview for the study was a representative sample of the target population. NORC invited 3,727 panelists to complete the online survey on May 21, 2020. A total of 1,264 panelists completed the survey by June 17, 2020, for a survey completion rate of 33.9 percent and a weighted cumulative response rate of 6.8 percent. 2 Panelists who completed the online survey were compensated with 3,000 AmeriPoints (or the cash equivalent of USD $3). On June 12, the incentive was increased to 5,000 AmeriPoints (or USD $5) to encourage completion of the remaining cases. The median time to complete the online survey was 16 minutes. 3
Six and a half months after the survey field period, a subsample of 875 panelists who completed the online survey were invited to participate in a one-shot online investment game (Berg, Dickhaut, and McCabe 1995). A total of 604 panelists participated in the investment game between the dates of January 4 and January 27, 2021, for a survey completion rate of 91.9 percent and a weighted cumulative response rate of 15.5 percent. Panelists who completed the online investment game were compensated based on the choices they made in the game. Incentives ranged between 1,000 and 24,000 AmeriPoints. All panelists, including those who scored 0 points in the game, received at least 1,000 AmeriPoints. The median time to complete the online investment game was 5 minutes.
Participants
Although there are slight differences, benchmark comparisons with the February-March 2020 Current Population Surveys indicate that the sample characteristics are representative of the U.S. population from which the AmeriSpeak panelists were randomly drawn (see Tables S1 and S2 in the Supplemental Material online). In terms of relative majorities, 51.9 percent of the participants who completed the online survey were female, 44.1 percent had an associate’s degree or some college, 63.5 percent were non-Hispanic White, and 32.3 percent were between the ages of 18 and 34 (M = 47.46, SD = 17.05, minimum = 19, maximum = 95). Relative majorities were about the same for respondents who participated in the online investment game. For more information about demographic characteristics and summary statistics for all variables used in the present study, see Table A1 in the Appendix.
Online Survey
The AmeriSpeak survey consisted of 10 blocks: 2—an introductory screen and a debriefing screen—were anchored at the beginning and end of the survey, respectively, while the remaining 8 blocks were presented in random order from respondent to respondent. Each block contained a thematic set of questions, ranging from the traditional generalized trust questions to dispositional optimism scales to social value orientation scales to Big 5 personality scales. Within each block, I randomized the order of questions, the order of grid items, and the order of response scales (e.g., agree-disagree vs. disagree-agree). Demographic characteristics were collected by NORC prior to participation in the online survey and provided as a deliverable preload to the data set.
The first goal of this survey is to establish the internal consistency, factor structure, and convergent validity of SFT and IST. I do this for (a) the original scales developed by Robbins (2021, 2022, 2023), where SFT and IST consist of four trust objects (or matters of trust) and SFT consists of six faces (male and female White, Black, and Latinx faces), and (b) new long-form versions of SFT and IST that include two new trust objects (TIRE, WALLET) and four new faces (male and female East and South Asian faces). Following previous research, I use MST and GST as benchmarks for convergent validity and discriminant validity. The second goal of this survey is to investigate the discriminant validity of SFT and IST with a broad range of psychological variables, including measures of economic preferences, particularized trust, and political trust. The third goal of the survey is to explore known-groups validity, with personality traits and demographic characteristics measured at the individual level and intentional homicide, ethnic heterogeneity, and income inequality measured at the state level. Known-groups validity is the degree to which scores on a newly proposed scale confirm hypothesized differences between known groups (e.g., confirming gender differences in self-reports of depression). The fourth and final goal is to replicate Robbins (2021) and investigate the measurement invariance of SFT-60 and IST-6 across demographic groups. In the following, I review and summarize the survey items and scales measured in this survey.
Stranger trust measures
In a recent set of articles, Robbins (2021, 2022, 2023) developed and validated two new generalized trust scales: the SFT and the IST. SFT, in its original structure, consists of six faces with neutral facial expressions drawn from the Chicago Face Database (Ma et al. 2015; https://chicagofaces.org/). Robbins (2022) selected the six faces based on four criteria: age (median U.S. ages), race (Caucasian, African American, and Latino/a), gender (male and female), and perceived trustworthiness (neutral evaluations) normed by an independent rater sample. 4
For each human face, respondents are asked, “Imagine meeting the following stranger for the first time. Please identify how much you would trust this stranger for each of the following.” For IST, respondents are not shown human faces. Instead, respondents are asked, “Imagine meeting a total stranger for the first time. Please identify how much you would trust this stranger for each of the following.” SFT and IST contain four objects (or matters) of trust for which respondents would rate each of the six human faces (SFT) and the imaginary stranger (IST): (a) “To keep a secret that is damaging to your reputation” (SECRET); (b) “To repay a loan of one thousand dollars” (LOAN); (c) “To look after a child, family member, or loved one while you are away” (CHILD); and (d) “To provide advice about how best to manage your money” (ADVICE). 5 Each trust object is measured using a 4-point scale, ranging from do not trust at all to trust completely, with do not trust very much and trust somewhat in between, and a don’t know option at the end of the scale.
In the present article, I modify the original SFT and IST scales in two ways. First, I add four new faces to SFT: male and female East and South Asian faces. Note that SFT was originally developed for respondents in the United States. The three predominant ethnoracial groups in the United States are non-Hispanic White, Hispanic, and Black. Although a strength in the U.S. context, these three racial categories may limit the generalizability of SFT to the Americas and Europe. With the inclusion of East Asian and South Asian ethnoracial groups, the five racial categories (White, Black, Latinx, East Asian, and South Asian) encompass the majority of ethnoracial groups observed in the world, strengthening the cross-cultural equivalence of SFT. The two East Asian faces were drawn from the Chicago Face Database. The neutral expression photographs used were AF-200 (age = 32, number of raters = 28, perceived Asian = 100 percent, perceived trustworthiness = 3.92 on 7-point scale) and AM-205 (age = 34, number of raters = 24, perceived Asian = 96 percent, perceived trustworthiness = 3.87 on 7-point scale). For South Asian faces, I selected two faces from the FaceResearch.org data base (DeBruine 2021). 6 The Face Research lab does not norm photographs using an independent rater sample; however, they do provide the gender and self-reported race of each photographed face. Photographs of all 10 human faces are available online in the Supplemental Material.
Second, I add two new trust objects to SFT and IST. Three criteria were used to select the four original trust objects (Robbins 2022): generality, commonality, and cost. Given these three criteria, the four trust objects were intended to (1) span specific instances of a particular matter (generality); (2) cover matters that people have trusted, often trust, or can easily imagine trusting others to maintain (commonality); and (3) capture matters that are salient to respondents when trust is broken or betrayed (costly). By using four trust objects that are general, common, and costly, Robbins (2022:42) argues that “the research community can better discriminate between high and low social trusters” while maintaining measurement equivalence (Robbins 2021). Despite these criteria, one drawback of the four trust objects is that they concern matters for which people typically trust friends, family, and acquaintances, not necessarily strangers. I thus add two new trust objects that concern matters for which people commonly (dis)trust strangers (Cohn et al. 2019): one explicitly pecuniary object, “To return a lost wallet or purse” (WALLET), and one nonpecuniary object, “To help change a flat tire on your passenger car” (TIRE).
Measures of convergent validity
Convergent validity is determined by assessing (a) the degree of confidence we have that a latent construct is well measured by its observed indicators (Campbell and Fiske 1959) and (b) the degree to which an operationalization is similar to (or converges on) other operationalizations to which it should theoretically be similar (Pedhazur and Schmelkin 1991). Factorial validity (i.e., internal consistency, reliability, and factor structure) is often used to establish the former, and correlations between latent constructs are often used to determine the latter. Two instruments common to the General Social Survey and the World Values Survey were used as benchmark comparisons for SFT/IST and to establish convergent validity between closely related latent constructs: a three-item Misanthropy Scale (MST; Brehm and Rahn 1997; Glanville, Andersson, and Paxton 2013; Mewes et al. 2021; Paxton 1999) and a three-item Generalized Social Trust Scale (GST; Delhey et al. 2011; Newton and Zmerli 2011; Robbins 2016a).
Measures of discriminant validity
Discriminant validity is determined by assessing the degree to which an operationalization is not similar to (or diverges from) other operationalizations to which it should not theoretically be similar (Pedhazur and Schmelkin 1991). Strictly speaking, discriminant validity requires that “a test not correlate too highly with measures from which it is supposed to differ” (Campbell 1960:548). If the evidence for discriminant validity is weak, then other constructs account for variation in the observed variables and researchers cannot be certain that statistical estimates are real or an artifact of measurement.
Four instruments capturing particularized trust, political trust, economic preferences, and social value orientations were used to assess discriminant validity: a three-item Particularized Social Trust scale (PST; Freitag and Bauer 2013; Freitag and Traunmüller 2009), a four-item Political Trust scale (POT; Newton and Zmerli 2011; Zmerli and Newton 2008), nine items capturing economic preferences (Falk et al. 2018), and a nine-item Prosocial Orientation scale (Van Lange et al. 1997).
In terms of expectations, previous research shows that measures of generalized trust and particularized trust are moderately correlated (Freitag and Traunmüller 2009; Glanville and Shi 2020; Newton and Zmerli 2011). Recent models, however, suggest that generalized trust and particularized trust are distinct constructs with different roots and should, in theory, be weakly correlated (Cao and Galinsky 2020; Robbins 2022, 2023). 7 With respect to political trust, research and theory suggest that generalized trust and political trust are strongly related (Almond and Verba 1963; Dinesen et al. 2022; Putnam 1993; Sønderskov and Dinesen 2016; Uslaner 2002). 8 Other research, however, has found weak to moderate correlations between GST and POT across countries (Newton and Zmerli 2011; for similar strengths of association using different generalized trust measures, see also Zmerli and Newton 2008). 9 Likewise, Robbins (2022) showed that POT was moderately correlated with SFT-24 (r = .345), IST-4 (r = .416), MST (r = .454), and GST (r = .435). Given prior empirical research—and that generalized trust and political trust are distinct, theoretical constructs—I expect a valid measure of generalized trust to yield a weak to moderate correlation with POT.
With respect to economic preferences and social value orientations, many theories in the social sciences assume that a set of preferences motivates individual behavior and actions. These include preferences for risk, the timing of costs and benefits, and reciprocity and altruism. Falk et al. (2018) recently showed that there is heterogeneity in economic preferences between and within countries. The authors also found that different economic preferences are correlated, leading to distinct “preference profiles” of groups of countries (e.g., prosocial traits of positive reciprocity, unconditional altruism, and trust are correlated in some countries but not in others). Nevertheless, Falk et al. (2018) show that their single-item measure of trust (“I assume that people have only the best intentions” on an 11-point scale) is weakly correlated with individual-level measures of positive reciprocity and unconditional altruism (see Falk et al. 2018:Online Appendix C). This finding is intuitive because trust is a belief, not a preference. For instance, scholars often conflate trust with perceptions of risk (Gambetta 1988). Yet preferences for risk are theoretically distinct from perceptions of risk (Hardin 2002; Robbins 2016b). As a result, generalized trust should be weakly correlated with preferences for risk and other economic preferences such as negative reciprocity and unconditional altruism (Robbins 2016b, 2022).
Measures of known-groups validity
Known-groups validity (or known-groups differences) is determined by assessing the degree to which an operationalization can discriminate between two groups known to differ on the variable of interest (Davidson 2014). It is, in other words, the degree to which scores on latent constructs differ between known groups. In this approach to construct validation, measurement items are administered to groups “that are known to have . . . different levels of the construct to confirm whether the hypothesized difference is reflected in the scores” (Davidson 2014:3481) of the different groups. Given that knowledge about differences between known groups is a function of traditional measures that may be biased and invalid, known-groups validity is not a test of validity per se. It is an assessment tool used to confirm or reject previous findings. It should be used if and only if new instruments demonstrate superior validity and reliability over traditional measures. Past and current findings suggest that this is the case (see Robbins 2021, 2022). I examine known-groups validity at the individual and state levels.
At the individual level, I included a number of measures to explore their associations with SFT/IST and MST/GST because previous studies suggest that personality traits (Freitag and Bauer 2016) and demographic characteristics (Alesina and La Ferrara 2002) predict levels of generalized trust. In terms of personality traits, I use a 5-item Life Orientation Test-Revised Scale to measure dispositional optimism (Scheier, Carver, and Bridges 1994) and a 15-item short-form version of the Big 5 Personality Scale (Hahn, Gottschling, and Spinath 2012). I investigate the effects of dispositional optimism on generalized trust because theories suggest that trust is a function of optimism (Uslaner 1998, 2002), with recent empirical research supporting this proposition (Andersson 2012). Given prior research, I expect the personality traits of conscientiousness (–), openness (+), and agreeableness (+) to correlate with generalized trust (Freitag and Bauer 2016); that is, individuals who differ in their levels of conscientiousness, openness, and agreeableness should differ in their levels of generalized trust.
With respect to demographic characteristics, I included measures of age (in years), gender (female, male), race-ethnicity (non-Hispanic White, Black, Hispanic, other race), education (no high school diploma, high school diploma, some college or associate’s, bachelor’s and beyond), marital status (married, widowed, divorced, separated, never married, living with partner), employment status (paid employee, self-employed, not working), household income (logged per capita household income), region (Northeast, Midwest, South, West), and metro area (metro area, nonmetro area). Previous research shows that all of these demographic characteristics have yielded statistically significant associations with generalized trust (Alesina and La Ferrara 2002; Evangelist 2022; Freitag and Traunmüller 2009; Hooghe et al. 2009; Mewes et al. 2021; Paxton 2007; Robbins 2011). To save space, I review one consistent finding. A robust observation in the literature is that age and generalized trust—particularly in the United States—are positively correlated (Clark and Eisenstein 2013; Robinson and Jackson 2001; Schwadel and Stout 2012; Wilkes 2011), suggesting that generalized trust is higher for older cohorts than for younger cohorts. I seek to replicate these and other findings with MST/GST and assess the extent to which they hold for SFT/IST.
At the state level, I include three common correlates of generalized trust to explore their associations with aggregate measures of SFT, IST, MST, and GST: intentional homicide, ethnic heterogeneity, and income inequality. I focus on these state-level correlations for two reasons. First, safety and security (Messner et al. 2004; Putnam 2000; Rosenfeld et al. 2007), diversity (Cao and Galinsky 2020; Dinesen et al. 2020), and fairness (Rothstein and Uslaner 2005; Uslaner 2002) have featured prominently in theoretical models of generalized trust for decades. Second, there is strong empirical support for the negative effects of intentional homicide, ethnic heterogeneity, and income inequality on generalized trust (Dinesen and Sønderskov 2015; Hastings 2018; Smith 1997; Uslaner 2002).
Intentional homicide for each state is measured by averaging the number of deaths (all homicides) per 100,000 over a seven-year period (2013–2019). Data were drawn from the Centers for Disease Control and Prevention’s National Center for Health Statistics. For ethnic heterogeneity, data were obtained from the Integrated Public Use Microdata Series USA, which integrates data from the U.S. census and the American Community Surveys. Using these data, I computed the ethnic fractionalization index (Alesina et al. 2003). This measure is interpreted as the probability that two randomly selected individuals within a state do not belong to the same ethnic group. For each state, I took the average of the ethnic fractionalization index over a five-year period (2014–2018). Finally, I use the Gini coefficient to measure income inequality. The Gini coefficient ranges from 0, which indicates perfect equality, to 100, which indicates perfect inequality. Data for the Gini coefficient were obtained from the U.S. Census Bureau and averaged over a five-year period for each state (2014–2018).
Online Investment Game
I use the investment game to assess the predictive validity of the four generalized trust scales. Prior to the online experiment, respondents provided their informed consent, read instructions, and were asked to complete a few exercises to confirm their understanding of the game. Respondents then played one round of the classic investment (or trust) game (Berg et al. 1995). At the beginning of the experiment, respondents were randomly assigned to one of two roles: player A or player B. Respondents were informed of these two roles and were told that they would be randomly paired with another AmeriSpeak participant. Both players started the experiment with 6,000 AmeriPoints (hereafter “points”). Respondents were told that player A would move first and that player A had the option to transfer all, some, or none of their 6,000 points to player B in increments of 500 points. Each point that player A sent to player B was tripled. If player A sent 500 points to player B, for example, player B would receive 1,500 points. The amount player A sent to player B would be displayed on both players’ screens. Player B then had the option to return points to player A. Player B could choose any amount between zero and the tripled amount that player A sent to player B in increments of 500 points. The amount returned to player A by player B would not be tripled. The 6,000 points that player B started the game with could not be sent to player A. All respondents were informed of these rules. The experiment ended after player B had indicated the amount of points he or she wished to return to player A.
Measures of predictive validity
Trust and trustworthiness are two distinct constructs. Trust is often conceptualized as person A’s belief about person B’s competence and motivation with respect to matter Y (i.e., what is of interest to person A), whereas trustworthiness is person B’s actual degree of competence and motivation to achieve matter Y on behalf of person A (Bauer 2021; Cook et al. 2005; Hardin 2002; Robbins 2016b). Thus, a valid measure of generalized trust should positively predict trust as measured in an investment game and predict trustworthiness to a negligible or small degree. Trust in the investment game was measured as the proportion of points sent to player B. Trustworthiness in the investment game was measured as the proportion of points returned to player A. Trust measured in the investment game was used as a criterion variable for validating SFT, IST, MST, and GST. Trustworthiness measured in the investment game was used to assess discriminant validity.
Results
For all measurement validation tests presented in the following, analyses were estimated in Mplus 8.5 (Muthén and Muthén 2017) or Stata 17. Robust full information maximum likelihood (MLR) estimation was used throughout. Because models estimated with MLR are relatively robust to violations of the normality assumption (Allison 2001), I model all indicators as continuous variables. With respect to item nonresponse, MLR for missing data provides asymptotically unbiased estimates under the assumption that data are missing completely at random or missing at random (Allison 2001). I have no reason to believe that the data are missing not at random given the nonsensitive nature of the questions. Finally, all models are estimated without the poststratification survey weights provided by NORC because weight association tests show that the survey weights risk inefficient estimates without reducing bias (see Bollen et al. 2016). I do, however, estimate supplemental models with poststratification survey weights to ensure that the results are robust to nonresponse error and adjustment error (Groves et al. 2009). The results are largely consistent with the unweighted estimates presented in the main text (see the Supplemental Material online).
Convergent Validity
Robbins (2021, 2022, 2023) found that SFT was best represented by a single latent factor. For SFT, a higher-order confirmatory factor analysis (CFA) in which trust object indicators (SECRET, LOAN, CHILD, ADVICE) loaded on first-order factors for each stranger’s face—White female (WF), White male (WM), Black female (BF), Black male (BM), Latin female (LF), Latin male (LM)—which, in turn, loaded on a second-order factor (SFT), yielded model fit similar to a single-factor model. In a departure from Robbins (2021, 2022), I use latent factor scores for WF, WM, BF, BM, LF, and LM instead of row-mean scales. I use this alternative estimation strategy to adjust for measurement error and the smaller factor loadings of some indicators. 10 I refer to this original scale as SFT-24 and treat it as a six-item single factor in which SFT-24 loads on the latent factor scores of WF, WM, BF, BM, LF, and LM in the present article.
I also follow this measurement strategy for the two new matters (WALLET, TIRE) and four new faces: East Asian female (EF), East Asian male (EM), South Asian female (SF), and South Asian male (SM). For this new single-factor model—which I refer to as SFT-60—the six trust objects (SECRET, LOAN, CHILD, ADVICE, WALLET, TIRE) of each face (WF, WM, BF, BM, LF, LM, EF, EM, SF, SM) were used to estimate latent factor scores. Thus, I treat SFT-60 as a 10-item single factor in which SFT-60 loads on the latent factor scores of WF, WM, BF, BM, LF, LM, EF, EM, SF, and SM (with each face representing a 6-item scale). Results using Robbins’s (2021, 2022) original estimation strategy yield similar findings (see the Supplemental Material online).
Robbins (2021, 2022, 2023) also found that IST was best represented by a single-factor latent construct in which the four trust object indicators (SECRET, LOAN, CHILD, ADVICE) loaded on IST. To distinguish the original IST measurement model from the new measurement model, I refer to the former as IST-4 (SECRET, LOAN, CHILD, ADVICE) and the latter as IST-6 (SECRET, LOAN, CHILD, ADVICE, WALLET, TIRE).
To establish convergent validity of the two old (SFT-24, IST-4) and two new (SFT-60, IST-6) latent factors, I first assess the degree to which all four are well measured by their observed indicators. This is done by examining the factorial validity of SFT-24, SFT-60, IST-4, and IST-6 (i.e., internal consistency, factor loadings, average variance extracted, etc.). I then assess the degree to which all four are similar to (or converge on) other operationalizations of generalized trust (i.e., MST and GST). I examine correlations between latent constructs to gauge convergent validity. In the following, I review and then execute these various tests.
I first examine Cronbach’s α, which assesses the internal consistency of the observed indicators. Cronbach’s α values range from 0 to 1, with values greater than .70 indicating acceptable reliability (Nunnally 1978). I then test the four-factor structure of SFT-24, IST-4, MST, and GST with a CFA, followed by a separate test of the four-factor structure of SFT-60, IST-6, MST, and GST. To do this, I examine the standardized factor loadings. Factor loadings greater than .70 indicate acceptable convergent validity because more than 50 percent (i.e., .702) of the variance in an indicator is explained by the latent construct to which the indicator is theoretically related (Campbell and Fiske 1959; Kline 2005). I then calculate the average variance extracted (AVE). The AVE measures the amount of variance captured by a latent construct relative to the amount due to measurement error (Fornell and Larcker 1981). The AVE for a latent construct is calculated by summing the variances extracted (i.e., r2) from each indicator over the total number of indicators. AVE values greater than .50 are considered acceptable (Fornell and Larcker 1981).
Several fit indices were used to assess the overall model fit and factorial validity of each four-factor CFA, including the root mean square error of approximation (RMSEA), the comparative fit index (CFI), and the standardized root mean square residual (SRMR). The RMSEA is a sample-free index that measures the difference between the estimated model and the population covariance matrix. RMSEA ranges from 0 to 1, with values less than .08 indicating adequate model fit (Hu and Bentler 1999). The CFI, in contrast, adjusts for sample size issues inherent in the χ2 test of model fit and examines the difference between the data and the estimated model. CFI ranges from 0 to 1, with values greater than .90 indicating adequate model fit (Hu and Bentler 1999). The SRMR is a standardized measure of the square root of the difference between the sample covariance matrix and the model covariance matrix. Like the RMSEA, SRMR ranges from 0 to 1, with values less than .08 indicating adequate model fit.
Next, I evaluate the correlations between latent constructs. Correlations greater than .85 indicate convergence, whereas correlations less than .85 indicate that two latent constructs diverge and likely measure different underlying concepts. New measures should correlate with existing measures, but not above a correlation of .85, which would indicate that the new measure may not be an improvement over the old one (Kline 2005). Following Fornell and Larcker (1981), I also establish discriminant validity by comparing AVEs to squared correlations between latent constructs. According to the Fornell-Larcker criterion, the AVE of each latent construct must be greater than or equal to the squared correlations with other constructs in the model. If this is not the case, then the two measures may be measuring the same underlying construct.
Descriptive statistics and reliability
Item means, standard deviations, number of observations, and Cronbach’s αs are presented in Table 1. For SFT-24 and SFT-60, Cronbach’s α was .970 and .983, respectively, indicating good internal consistency; the four to six trust objects of each face (e.g., WF) also showed good internal consistency, with Cronbach’s α between .860 and .884. IST-4 (α = .829) and IST-6 (α = .822) yielded similar levels of internal consistency. The Cronbach α’s for MST (α = .744) and GST (α = .760) also yielded acceptable internal consistency.
Descriptive Statistics of SFT-24, SFT-60, IST-4, IST-6, MST, and GST.

Note: For SFT-24 and SFT-60, face scales (e.g., White female) were generated using row-mean methods. In the analysis, I use latent factor scores of each face.
Factorial validity and intercorrelations between latent constructs
In order to identify a CFA, I constrained the first unstandardized factor loading of each factor to 1. Factor variances and intercepts and residual variances of the observed indicators were freely estimated and statistically significant (not shown, but available on request). The results are presented in Table 2. In Model 1, the four-factor CFA of SFT-24, IST-4, MST, and GST provided a good fit to the data, χ2(98) = 351.586, RMSEA = .045, CFI = .966, and SRMR = .054. For SFT-24 and IST-4, all standardized factor loadings were equal to or greater than the standard cutoff value of .70 (except for IST-4 on ADVICE). The AVEs for SFT-24 and IST-4 were also above standard cutoffs (>.50). In contrast, some standardized factor loadings for MST and GST were below .70, whereas others were above .70. Likewise, the AVE for GST was above the acceptable cutoff of .50, although MST was not. This suggests that the amount of variance captured by MST due to measurement error is greater than the standard cutoffs. Overall, the convergent validity of the observed indicators of SFT-24 and IST-4 was superior to that of MST and GST.
Confirmatory Factor Analysis Assessing Convergent and Discriminant Validity.

Note: Standardized factor loadings. Indicators for SFT-24, SFT-60, IST-4, IST-6, MST, and GST are treated as continuous (factor variances, item intercepts, and residual variances freely estimated but not shown). All correlations between latent constructs were statistically significant at the p < .05 level. VE = variance extracted (i.e., the R2 or the squared multiple correlation); AVE = average variance extracted (the average of the VEs for each latent construct); SFT = Stranger Face Trust Scale; IST = Imaginary Stranger Trust Scale; WF = White female; WM = White male; BF = Black female; BM = Black male; LF = Latin female; LM = Latin male; EF = East Asian female; EM = East Asian male; SF = South Asian female; SM = South Asian male; MST = Misanthropy Scale; GST = Generalized Social Trust Scale; RMSEA = root mean square error of approximation; CI = confidence interval; CFI = comparative fit index; SRMR = standardized root mean square residual.
p < .001.
In terms of discriminant validity, the intercorrelations between latent constructs were all less than .85, whereas the AVEs for each latent construct were greater than the squared correlations between latent constructs. 11 This set of results demonstrates latent construct discrimination between SFT-24, IST-4, MST, and GST. Replicating Robbins (2022), the correlations between SFT-24 and IST-4 (r = .737) and MST and GST (r = .537) were greater than all other correlations between latent constructs, indicating that both sets of constructs have more conceptual overlap with each other than the other set. Overall, the findings indicate discriminant validity between the latent constructs.
In Model 2, the four-factor CFA of SFT-60, IST-6, MST, and GST provided a good fit to the data, χ2(203) = 800.705, RMSEA = .048, CFI = .950, and SRMR = .065. Overall, the analysis of convergent and discriminant validity yielded similar results to those found in Model 1, with three key differences. First, two factor loadings for IST-6, WALLET and TIRE, were below the standard cutoff of .70, although both were near the lowest acceptable limits. Second, the AVE for IST-6 was slightly below .50, showing some measurement error. Third, the squared correlation between SFT-60 and IST-6 (r2 = .538) was slightly greater than the AVE for IST-6 (AVE = .458). Taken together, the results suggest that SFT-60 and IST-6 have considerable construct overlap but do not exhibit convergent validity.
Given the comparable factorial validity and convergent validity between SFT-24 and SFT-60 and IST-4 and IST-6, all remaining measurement validation tests—discriminant validity, known-groups validity, and predictive validity—will include only SFT-60 and IST-6, with MST and GST serving as benchmarks. Validation tests for SFT-24 and IST-4 and indicators of MST (TRUST, FAIR, and HELP) can be found in the Supplemental Material online.
Discriminant Validity
To assess discriminant validity, I used structural equation models (SEMs) to analyze the extent to which SFT-60, IST-6, MST, and GST correlate with PST, POT, indicators of economic preferences, and the Prosocial Orientation Scale. In these SEMs, a single endogenous latent factor (SFT-60, IST-6, MST, GST) is regressed on a single exogenous latent factor (PST, POT) or observed indicator (e.g., risk taking). Standardized path coefficients are used to estimate the strength of association.
Figure 1 presents the standardized path coefficients—or correlations—and their respective 95 percent confidence intervals (CIs) for SFT-60 and IST-6. Overall, the results show that SFT-60 and IST-6 are significantly and positively correlated with PST, POT, patience, and risk taking, albeit weakly. For SFT-60 and IST-6, most measures of positive reciprocity and negative reciprocity are statistically nonsignificant (with some exceptions), whereas SFT-60 and IST-6 are weakly correlated with some measures of unconditional altruism and the Prosocial Orientation Scale. Taken together, the various tests of association indicate that SFT-60 and IST-6 exhibit discriminant validity.

Standardized coefficients between generalized trust scales (SFT-60 and IST-6) and measures of economic preferences.
Figure 2 presents the standardized path coefficients—or correlations—and their respective 95 percent CIs for MST and GST. Unlike SFT-60 and IST-6, MST and GST are moderately to strongly correlated with PST and POT. For all other variables, MST and GST reveal negligible to weak correlations but do exhibit statistically significant associations with more criterion variables than SFT-60 and IST-6 (e.g., measures of positive and negative reciprocity). In short, MST and GST discriminate on some criterion variables but converge on others (PST, POT), suggesting that SFT-60 and IST-6 have greater discriminant validity than MST and GST.

Standardized coefficients between generalized trust scales (MST and GST) and measures of economic preferences.
Note that SFT-24 and IST-4 yield comparable estimates. These additional tests can be found in the Supplemental Material online.
Known-Groups Validity
Individual level
At the individual level, I estimated four SEMs in which the endogenous latent factors of SFT-60, IST-6, MST, and GST were regressed on dispositional optimism, Big 5 personality scales, demographic characteristics, and controls. Table 3 presents the results of the estimated models.
Structural Equation Models Assessing Known-Groups Validity of SFT-60, IST-6, MST, and GST.

Note: Standardized coefficients (robust standard errors). Indicators for all latent factors are treated as continuous (factor variances, item intercepts, and residual variances freely estimated but not shown). Exogenous latent factors and observed covariates were allowed to freely covary (not shown). Control variables included household internet access, home ownership, building type of residence, telephone service for the household, survey duration, and survey mode device. SFT = Stranger Face Trust Scale; IST = Imaginary Stranger Trust Scale; MST = Misanthropy Scale; GST = Generalized Social Trust Scale.
p < .05. **p < .01. ***p < .001.
Models 1 and 2 reveal strikingly consistent findings. Conscientiousness (–) and agreeableness (+) are significantly related to SFT-60 and IST-6 in the expected direction (Freitag and Bauer 2016), whereas both latent constructs show variation across regions of the United States (the West has the highest levels of generalized trust). All other key individual-level variables are statistically unrelated to SFT-60 and IST-6. This is a significant finding, demonstrating that generalized trust, measured as SFT-60 and IST-6, does not differ by age (Clark and Eisenstein 2013; Putnam 2000; Robinson and Jackson 2001), gender (Alesina and La Ferrara 2002; Mewes 2014), race and ethnicity (Douds and Wu 2018; Evangelist 2022; Wilkes 2011), and socioeconomic status (e.g., education; Oskarsson et al. 2017).
Although Model 3 shows that MST is significantly correlated with conscientiousness (–) and agreeableness (+), it also differs from the estimates found in Models 1 and 2. Notably, MST is correlated with dispositional optimism (+), age (+), race and ethnicity (non-Hispanic White > Black and Hispanic), region (the Northeast has the highest levels of generalized trust), and metro area (nonmetro area > metro area). I do not observe these associations for SFT-60 and IST-6. Although Model 3 replicates many of the known group differences found in the literature, Model 4 does not. In fact, the only variable that is significantly correlated with GST is dispositional optimism (+). All other variables render statistically nonsignificant effects.
Taken together, no single variable is consistently associated with the four generalized trust scales. In spite of this heterogeneity, there are some noticeable patterns. Two of the Big 5 personality scales—conscientiousness and agreeableness—are associated with three of the four generalized trust scales, SFT-60 and IST-6 show similar regional patterns, and MST and GST are both positively correlated with dispositional optimism. In other words, there are important similarities between the two new scales of generalized trust and clear differences between the old and new scales. All of this suggests that some previous findings, such as the positive correlation between age and trust (Clark and Eisenstein 2013; Putnam 2000; Robinson and Jackson 2001) or ethnoracial differences in generalized trust (Douds and Wu 2018; Evangelist 2022; Wilkes 2011), should be reevaluated in light of the superior validity and reliability of SFT/IST (see current measurement validation tests and previous findings by Robbins 2021, 2022, 2023).
These estimates largely parallel those found using SFT-24 and IST-4 (see the Supplemental Material online).
State level
At the state level, I estimated a series of correlations between state-level indicators (intentional homicide, ethnic fractionalization, and income inequality) and aggregated state-level latent factor scores of SFT-60, IST-6, MST, and GST. In Figure 3, I present scatterplots, 95 percent confidence intervals, and tests of association.
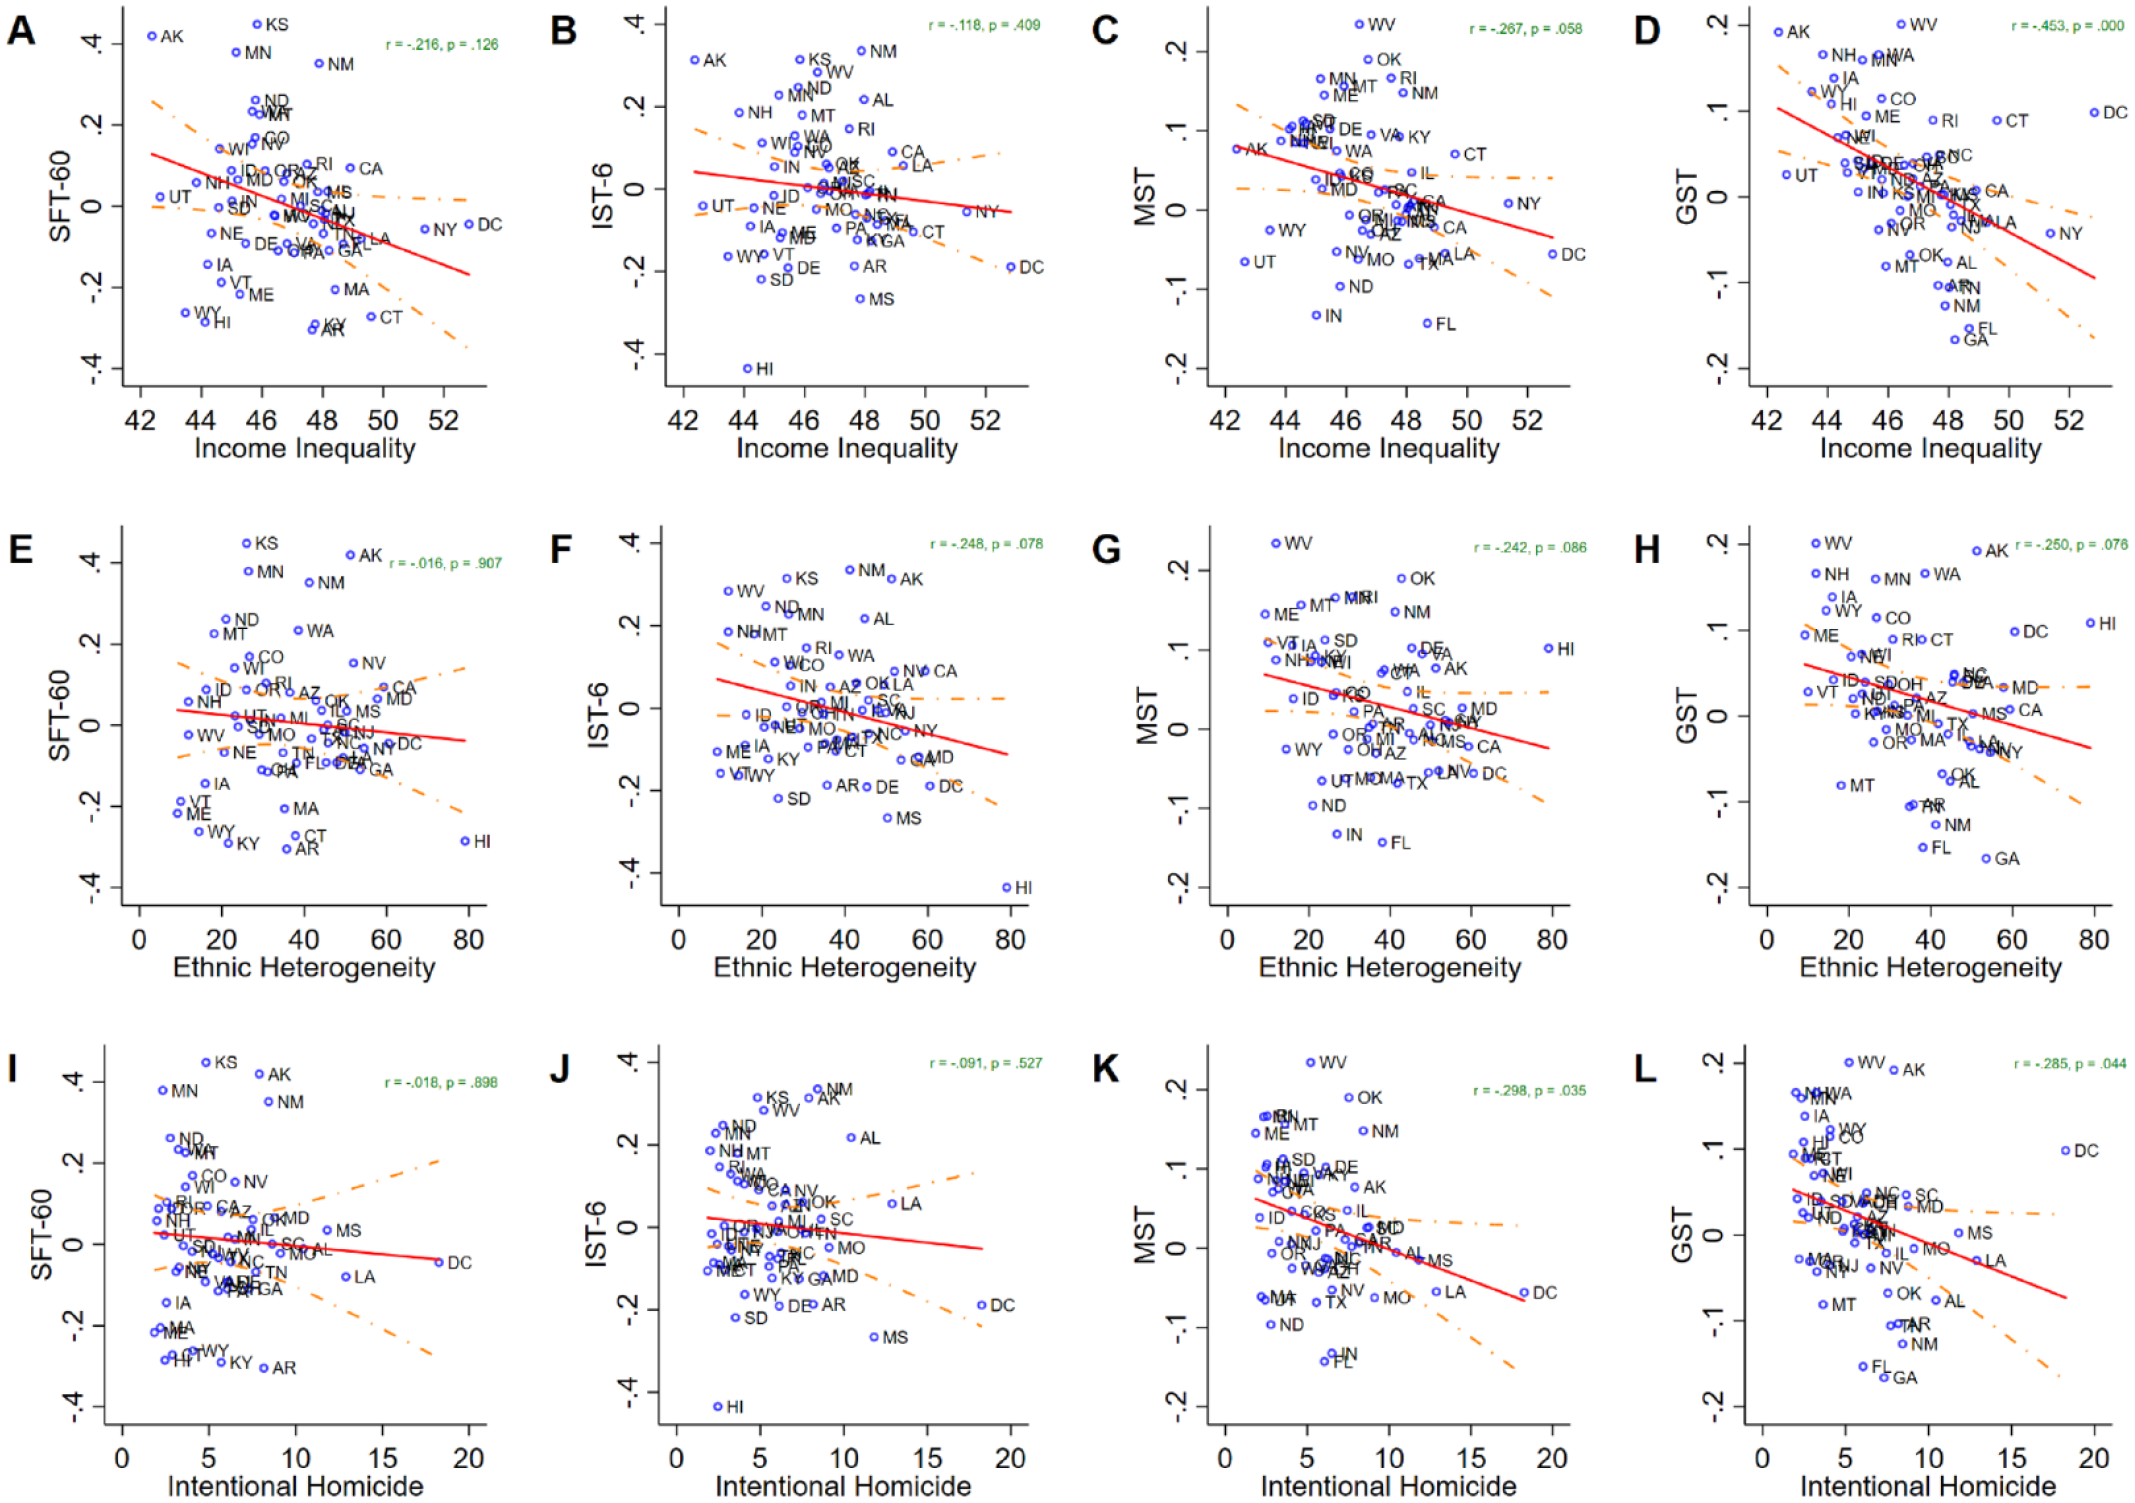
Scatter plots of state-level indicators and generalized trust scales.
The first row of Figure 3 (Panels A–D) shows that all four generalized trust scales are negatively correlated with income inequality (Gini coefficient). Although there is variation in the strength of the associations (weak to moderate correlations) and statistical significance across scales, the results nonetheless support the classic proposition that social cleavages and class divisions make it difficult for generalized trust to flourish in society (Rothstein and Uslaner 2005; Uslaner 2002).
In the second row (Panels E–H), Figure 3 shows that SFT-60 is statistically unrelated to ethnic heterogeneity (r = −.016), whereas the other three scales appear to be negatively correlated with ethnic heterogeneity (r > −.240 but < −.250), albeit weakly at the p < .10 level. This is an important finding that is likely due to measurement nonequivalence and confounding. In other words, the people who come to mind when answering IST-6 (“imagine a complete stranger”), MST (“most people”), and GST (“people of”) might vary systematically across levels of ethnic heterogeneity. Or some unobserved confounder is biasing the negative relationship between IST/MST/GST and ethnic heterogeneity. This evidence, however tentative, suggests that the diversity-trust relationship may be an artifact of measurement (Dinesen et al. 2020).
In the third row (Panels I–L), Figure 3 shows that SFT-60 and IST-6 are negatively correlated with intentional homicide, but to a negligible degree (r = −.018 for SFT-60; r = −.091 for IST-6). In comparison, MST (r = −.298, p = .035) and GST (r = −.285, p = .044) are both negatively correlated with intentional homicide, but to a greater degree. These results cast doubt on Putnam’s (2000:317) classic observation that places with low levels of generalized trust can become trapped in a “vicious circle in which low levels of trust and cohesion lead to higher levels of crime, which lead to even lower levels of trust and cohesion.” What my results suggest is that once measures of generalized trust consider specific strangers (e.g., White female) and particular matters (e.g., keeping a secret), respondents tend to trust at similar levels regardless of heterogeneity in the degrees of exposure to state-level violence.
State-level correlations for SFT-24 and IST-4 are comparable to that of SFT-60 and IST-6, respectively. These additional tests can be found in the Supplemental Material online.
Predictive Validity
To assess predictive validity, I used SEMs to analyze the degree to which SFT-60, IST-6, MST, and GST correlate with the proportion of tokens sent and returned in an investment game. In these SEMs, a single endogenous observed indicator (proportion of tokens sent and returned) is regressed on a single exogenous latent factor score (SFT-60, IST-6, MST, GST). Standardized path coefficients serve as an estimate of the strength of association.
Figure 4 shows that all four generalized trust scales are positively correlated with the proportion of points sent in the investment game but that SFT-60 (β = 0.20) and IST-6 (β = 0.12) are the only statistically significant scales at the p < .05 level. In contrast, the positive correlation between MST/GST and the proportion of tokens sent was weak and statistically nonsignificant (p > .05). Figure 5 shows that SFT-60, IST-6, and GST are negatively correlated with the proportion of points returned in the investment game, while MST is positively correlated with the proportion of tokens returned. Of the four scales, only IST-6 and MST were significantly correlated with the proportion of tokens returned at the p < .05 level. Taken together, SFT-60 fully meets expectations (positively predicts trust but not trustworthiness), IST-6 partially meets expectations (positively predicts trust and negatively predicts trustworthiness), and neither MST nor GST meet the criteria for predictive validity.

Standardized coefficients between generalized trust scales and proportion of points sent by player A.
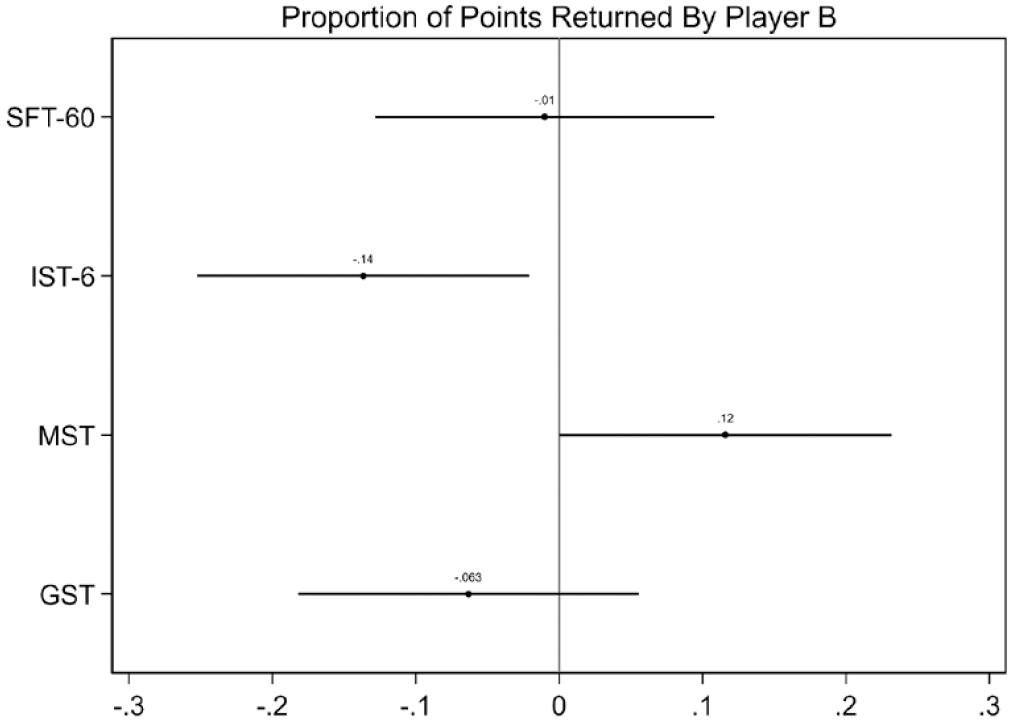
Standardized coefficients between generalized trust scales and proportion of points returned by player B.
The findings presented here are robust to statistical controls, execpt for IST-6. 12 Furthermore, SFT-24 and IST-4 yield comparable, albeit weaker, estimates. These additional tests can be found in the Supplemental Material online.
Measurement Invariance
Although not a central focus of the article, given that Robbins (2021) has established the measurement invariance of SFT-24 and IST-4 across demographic groups, I replicate his analysis for SFT-60 and IST-6. Results confirm the measurement invariance of SFT-60 and IST-6 across gender, race, education, and age groups. See the Supplemental Material online for this additional analysis of measurement invariance.
Discussion and Conclusion
Summary of Results
To investigate generalized trust, social scientists from a variety of disciplines rely on a small set of measurement tools, operationalizations that are largely built from the classic “most people trust” question. These tools inform most of what we know about the causes and consequences of generalized trust (Abascal and Baldassarri 2015; Fairbrother and Martin 2013; Glanville et al. 2013; Herreros 2004; Messner et al. 2004; Mewes 2014; Rosenfeld et al. 2001; Paxton 2002, 2007; Robbins 2012, 2016a), and trends in generalized trust over time (Clark and Eisenstein 2013; Mewes et al. 2021; Paxton 1999; Putnam 2000; Robinson and Jackson 2001; Schwadel and Stout 2012; Uslaner 2002; Wilkes 2011). Traditional measures of generalized trust, however, have come under increasing empirical scrutiny, with some scholars suggesting that they bias statistical estimates and compromise tests of sociological theory. As a solution, Robbins (2021, 2022, 2023) proposed two new self-report measures of generalized trust—SFT and IST—which have been shown to be more valid and to have greater measurement equivalence than traditional measures.
I argue that SFT and IST are needed to rigorously test theories of and advance sociological knowledge about generalized trust, both of which require further refinement and validation. To this end, I first expand the ethnicity of the faces shown in SFT and the matters of trust under evaluation in IST and SFT. This results in four short- and long-form versions of the scales: SFT-24 (6 faces, four matters), SFT-60 (10 faces, six matters), IST-4 (four matters), and IST-6 (six matters). Second, I test the validity of these new scales alongside traditional measures of generalized trust in a nationally representative probability sample (N = 1,264) and a follow-up study of a one-shot investment game (N = 600).
My results support the proposition that the most accurate and consistent measures of generalized trust constitute “an average across many situations that entails a variety of trustees, expected behaviors, and contexts” (Bauer and Freitag 2018:29). I find that the long- and short-form versions of SFT are more reliable and valid than IST (-4 and -6), which, in turn, are more reliable and valid than MST and GST. The evidence in favor of SFT and IST is particularly strong given that both sets of scales discriminate from economic preferences and other forms of trust, exhibit convergent validity across a range of tests, display measurement equivalence across demographic groups, and predict measures of behavioral trust. The fact that the performance of SFT and IST is consistent with previous research indicates just how well they measure generalized trust.
Traditional measures of generalized trust fare much worse. I found that MST and GST discriminate weakly from scales of particularized trust and political trust and are significantly correlated with a number of economic preferences. MST and GST are also imperfectly measured by their observed indicators, and neither predicts measures of behavioral trust. In spite of some differences, the present findings largely replicate and strengthen previous research (Robbins 2021, 2022, 2023) and—taken together—suggest that sociologists using MST and GST cannot be sure whether their statistical estimates are real or an artifact of measurement.
This raises the question of how to interpret previous findings based on traditional measures of generalized trust. My analysis of known-group differences provides preliminary and tentative answers. At the individual level, it may be worth reconsidering prior findings linking generalized trust to age (Clark and Eisenstein 2013; Putnam 2000; Robinson and Jackson 2001), race-ethnicity (Douds and Wu 2018; Evangelist 2022; Wilkes 2011), and dispositional optimism (Andersson 2012; Uslaner 2002). The state-level analysis suggests that previous estimates of ethnic heterogeneity (Alesina and La Ferrara 2002; Marschall and Stolle 2004; Putnam 2007; Uslaner 2012) and intentional homicide (Messner et al. 2004; Putnam 2000; Rosenfeld et al. 2007) might be exaggerated. Other individual- and state-level variables, however, appear to yield relatively consistent results across the four generalized trust scales, namely, Big 5 personality (Freitag and Bauer 2016) and income inequality (Rothstein and Uslaner 2005; Uslaner 2002). In what follows, I consider the implications of these results for trust research.
Implications for Sociological Research
The implications of this study for sociological research are abundant. First, the results provide strong support for previous findings while challenging others. In his seminal book, The Moral Foundations of Trust, Uslaner (2002) argues that generalized trust is a moral value—or stable disposition—that solidifies in early adulthood (see also Kiley and Vaisey 2020; Vaisey and Lizardo 2016). According to Uslaner (2002), generalized trust is a core personality trait that depends more on early childhood experiences and the intergenerational transmission of values (Erikson 1964; Rotenberg 1995) and less on the major events or everyday occurrences that one experiences throughout life. Uslaner (2002) also contends that declining optimism and growing economic inequality account for the well-documented decline in generalized trust in the United States over the past 50 years (see also Andersson 2012; Paxton 2002; Putnam 2000; Robinson and Jackson 2001).
Using newly validated measures of generalized trust, the present article tackles some of Uslaner’s (2002) central claims. Robbins (2022) and I find that SFT and IST are weakly correlated with measures of moral motivation and dispositional optimism (the opposite is true for MST and GST). We also show that SFT and IST are statistically unrelated to age (i.e., older people are not more trusting than younger people), that the new scales are equivalent across age categories (Robbins 2021), and that generalized trust is malleable and open to change (Robbins 2021). These findings, by contrast, do not hold for MST or GST. Taken together, this evidence casts doubt on Uslaner’s (2002) core propositions, with one exception: the link between generalized trust and income inequality. The robustness of the inequality-trust link suggests that rising income inequality is responsible for the decline in generalized trust in the United States (Hastings 2018). However, the severity of this decline is relatively unknown because the scientific community has relied on MST and the “most people trust” question for the past 50 years. In all likelihood, traditional measures of generalized trust have measured declines in moral values, optimism, trustworthiness, and generalized trust. Because of such confounding and the weak correlations I observe between SFT/IST and income inequality, the decline in generalized trust may not be as severe as previously observed (Mewes et al. 2021; Paxton 1999; Putnam 2000; Robinson and Jackson 2001). To the extent that cooperation and generalized trust are related, a recent meta-analysis of experimental research on social dilemmas from 1956 to 2017 in the United States further supports this claim (Mingliang et al. 2022): The authors find no evidence of a decline in cooperation over the 61-year period.
The current study also recommends new theoretical and empirical possibilities for understanding ethnoracial differences in generalized trust. Along with age and education, scholars have focused on race as “the life experience that has the biggest impact on trust” (Uslaner 2002:91). As such, many studies find significant ethnoracial gaps in generalized trust (Alesina and La Ferrara 2002; Douds and Wu 2018; Evangelist 2022; Nunnally 2012; Smith 1997; Uslaner 2002; Wilkes 2011), with Black-White differences being the most striking and prominent. Smith (2010) attributes these gaps to historical and contemporary discrimination, neighborhood context, and ethnoracial socialization. Using MST and GST, Robbins (2022) and I replicate the finding that Black individuals have lower levels of trust than White individuals. But when employing more valid and reliable scales, SFT and IST fail to produce similar ethnoracial differences in generalized trust.
Why might this be the case? The main reasons have to do with measurement. First, traditional measures of generalized trust capture more than just the “standard estimate of the probability of trustworthiness . . . for the average person he [or she] meets” (Coleman 1990:104) and fail to distinguish from other closely related but fundamentally different concepts that may be driving the previously observed ethnoracial gaps in generalized trust. When Uslaner (2002:107) claims that Black individuals trust other Black individuals much more than “most people” (70 percent vs. 23 percent), I contend that the source of these ethnoracial differences in trust is an unobserved stable attitude or disposition that is (a) a product of systemic racism and histories of discrimination and (b) correlated with traditional measures of generalized trust but not with SFT or IST. Second, SFT and IST provide respondents with a standardized set of trust objects (or matters of trust), thereby mitigating a possible source of measurement nonequivalence: unobserved heterogeneity in what respondents would trust strangers to do. This is a persistent problem with traditional measures of generalized trust (see Schilke et al. 2021:249). When respondents evaluate MST, for instance, the terms “trusted,” “fair,” and “helpful” evoke unobserved matters that are likely to vary systematically across ethnoracial groups. This is one possible explanation for why ethnoracial differences in generalized trust disappear when SFT and IST are used.
Beyond ethnoracial differences in trust, a large literature has also tackled the question of whether ethnic diversity undermines generalized trust (Abascal and Baldassarri 2015; Dinesen and Sønderskov 2018; Putnam 2007; van der Meer and Tolsma 2014). A recent review and meta-analysis by Dinesen et al. (2020) clarifies some of the core findings of this body of research. Dinesen et al. (2020:441) find a consistent negative relationship between ethnic diversity and trust and show that this “relationship is stronger for trust in neighbors and when ethnic diversity is measured more locally.” Using traditional measures of generalized trust, I am able to replicate this negative association at the state level. But when using SFT, I find that the association between ethnic diversity and generalized trust is negligible, suggesting that social scientists should be cautious about the relationship between diversity and trust.
Like the ethnoracial gap in trust, I contend that this null effect is an artifact of measurement: People living in ethnically homogeneous communities may interpret traditional measures of generalized trust in systematically different ways than people living in diverse communities. The ambiguity of the “most people” or “people of” referent categories leads to different interpretations—and ultimately different levels of generalized trust—in ethnically homogeneous and heterogeneous social contexts. SFT overcomes this measurement problem by standardizing the strangers and matters of trust under evaluation. As Dinesen et al. (2020) point out, there is a great deal of variation in local levels of ethnic diversity within states, and the relationship between diversity and trust becomes stronger as geographic units become smaller (see also Dinesen and Sønderskov 2015). Thus, my results are preliminary. Although they call into question the diversity-trust link previously observed at the state level, a more fine-grained evaluation with local-level measures of diversity is needed to contest whether ethnic diversity undermines generalized trust.
Other findings, such as differences in measurement across U.S. regions, are noteworthy. But for the sake of space, I mention them to illustrate the fundamentally generative nature of this study. For the current project, the relationship between theory and empirics is synergistic, with theoretical insights stimulating new empirical tools, which, in turn, spur new hypotheses and propositions. My hope is that these novel measurement tools will provide a variety of ways for sociologists to engage with and advance our thinking about generalized trust.
Second, this study discourages the use of traditional measures of generalized trust, namely, MST, GST, and the “most people trust” question. Although these traditional measures likely capture generalized trust to some degree, they risk failing to (a) discriminate from other psychological mechanisms and (b) measure trust the same way across groups. MST and GST, for instance, require researchers to control for measurement confounding by including additional—sometimes burdensome—measures and scales in surveys and statistical models. They also force researchers to confront a finding and justify whether it is real or a function of measurement nonequivalence. An important implication of this study is that both of these hurdles are not only difficult to justify but also difficult to overcome.
Consequently, the present study provides a compelling case for incorporating SFT and IST into research on generalized trust. In light of the magnitude of the gains in reliability, validity, and measurement equivalence, SFT-60 should be used whenever generalized trust is treated as a key independent or dependent variable. The gains in statistical precision are too great to sacrifice in favor of MST, GST, or any of their respective indicators. When survey length is an issue, SFT-24 is an equally reliable and valid substitute. A potential drawback is that aspects of these measures are difficult to implement in some survey modes. SFT requires survey takers to view pictures of faces, the order of which should be randomly assigned along with the order of trust objects for each face. Although these requirements can be accommodated in most survey modes, telephone surveys present a significant hurdle. In the case of telephone surveys, my suggestion is to use IST-6 rather than MST or GST because IST-6 is a more valid and reliable measure of generalized trust than common alternatives. This is also true in situations where generalized trust is a mere control variable. Another possible drawback is that some survey modes, such as face-to-face interviews, may pose significant challenges for SFT. If interviewer effects are a concern, I suggest using tools that help overcome social desirability bias, such as computer-assisted interviewing, or using IST-6 instead. Overall, the benefits of SFT and IST far outweigh the potential costs.
Directions for Future Research
Important work has been done to examine the reliability, validity, and measurement equivalence of SFT and IST, but more work is needed. Three avenues of research would further solidify SFT and IST as the standard tools for measuring generalized trust. First, MST and the “most people trust” question have been used in general population surveys for decades, both nationally and cross-nationally. The representation of SFT and IST has not yet been established to such a degree. This will require a major research program with the primary goal of establishing the reliability and validity of SFT and IST in representative samples from countries around the globe. This is an important endeavor, given the nonequivalence of traditional measures of generalized trust both within and between regions of the world (Delhey et al. 2011; Torpe and Lolle 2011; Reeskens and Hooghe 2008). As Davidov et al. (2014:55) write: “Determining whether people in certain countries score differently in measurements of interest or whether concepts relate differently to each other across nations can indisputably assist in testing theories and advancing our sociological knowledge.” At present, it is an open question whether and to what extent SFT and IST are valid and reliable outside of Western contexts.
Second, it remains to be seen whether the present findings on generalized trust hold when applied to general population surveys outside of the United States. For instance, is the negative correlation observed between age and SFT-60 unique to the United States, or does it exist in other cultural contexts? Another key question is whether SFT and IST correlate with social, political, economic, and cultural indicators of a country. For instance, safety and security (Messner et al. 2004; Putnam 2000), diversity (Cao and Galinsky 2020; Dinesen et al. 2020), and fairness (Rothstein 2011; Uslaner 2002) figure prominently in theoretical models of generalized trust. Investigating whether country-level correlations between generalized trust and intentional homicide, ethnic fractionalization, and income inequality hold for SFT and IST is an important next step. The results will help to adjudicate between classical theoretical accounts of generalized trust.
Third, according to the theory of trust developed by Yamagishi and Yamagishi (1994), Yamagishi, Cook, and Watabe (1998), and Yamagishi, Kikuchi, and Kosugi (1999), high levels of generalized trust allow people to leave the security of their long-standing relationships and seek better opportunities in other contexts. Yamagishi and Yamagishi (1994) call this “emancipation” and see it as a profitable strategy to invest “cognitive resources” in cultivating the “social intelligence” needed to identify untrustworthy actors (Yamagishi et al. 1999). Counterintuitively, these authors show that generalized trust and gullibility—or insensitivity to signals of untrustworthiness—are negatively related: “high trusters are more vigilant in dealing with other people in socially uncertain situations” (Yamagishi et al. 1999:150) than low trusters. An open question is the extent to which SFT and IST measure gullibility rather than generalized trust. This is an important question for future research, although there is empirical evidence in the current article and in Robbins (2021, 2022) that the association between SFT/IST and gullibility may be weak: The correlation between SFT and behavioral trust is much stronger than traditional measures, and SFT/IST is not significantly correlated with measures that on their face imply gullibility, namely, dispositional optimism, social preferences, and moral motivations.
Conclusion
Social scientists have made significant contributions to the measurement of generalized trust. Most of these methodological innovations, however, have yet to match concept and theory with operationalization and measurement. In an effort to bridge this gap, Robbins (2021, 2022, 2023) developed two new measures of generalized trust—SFT and IST—that take the average values of trust in particular matters and specific strangers. In the present study, I provide support for the reliability and validity of these new measures with a nationally representative survey and a behavioral economics experiment. In light of the current and previous findings, my recommendation is to minimize the continued use of traditional measures in favor of SFT and IST so that future theories of generalized trust can rest on a solid empirical foundation.
Supplemental Material
sj-docx-1-srd-10.1177_23780231231192841 – Supplemental material for Valid and Reliable Measures of Generalized Trust: Evidence from a Nationally Representative Survey and Behavioral Experiment
Supplemental material, sj-docx-1-srd-10.1177_23780231231192841 for Valid and Reliable Measures of Generalized Trust: Evidence from a Nationally Representative Survey and Behavioral Experiment by Blaine G. Robbins in Socius
Footnotes
Appendix
Summary Statistics and Descriptions of Variables.
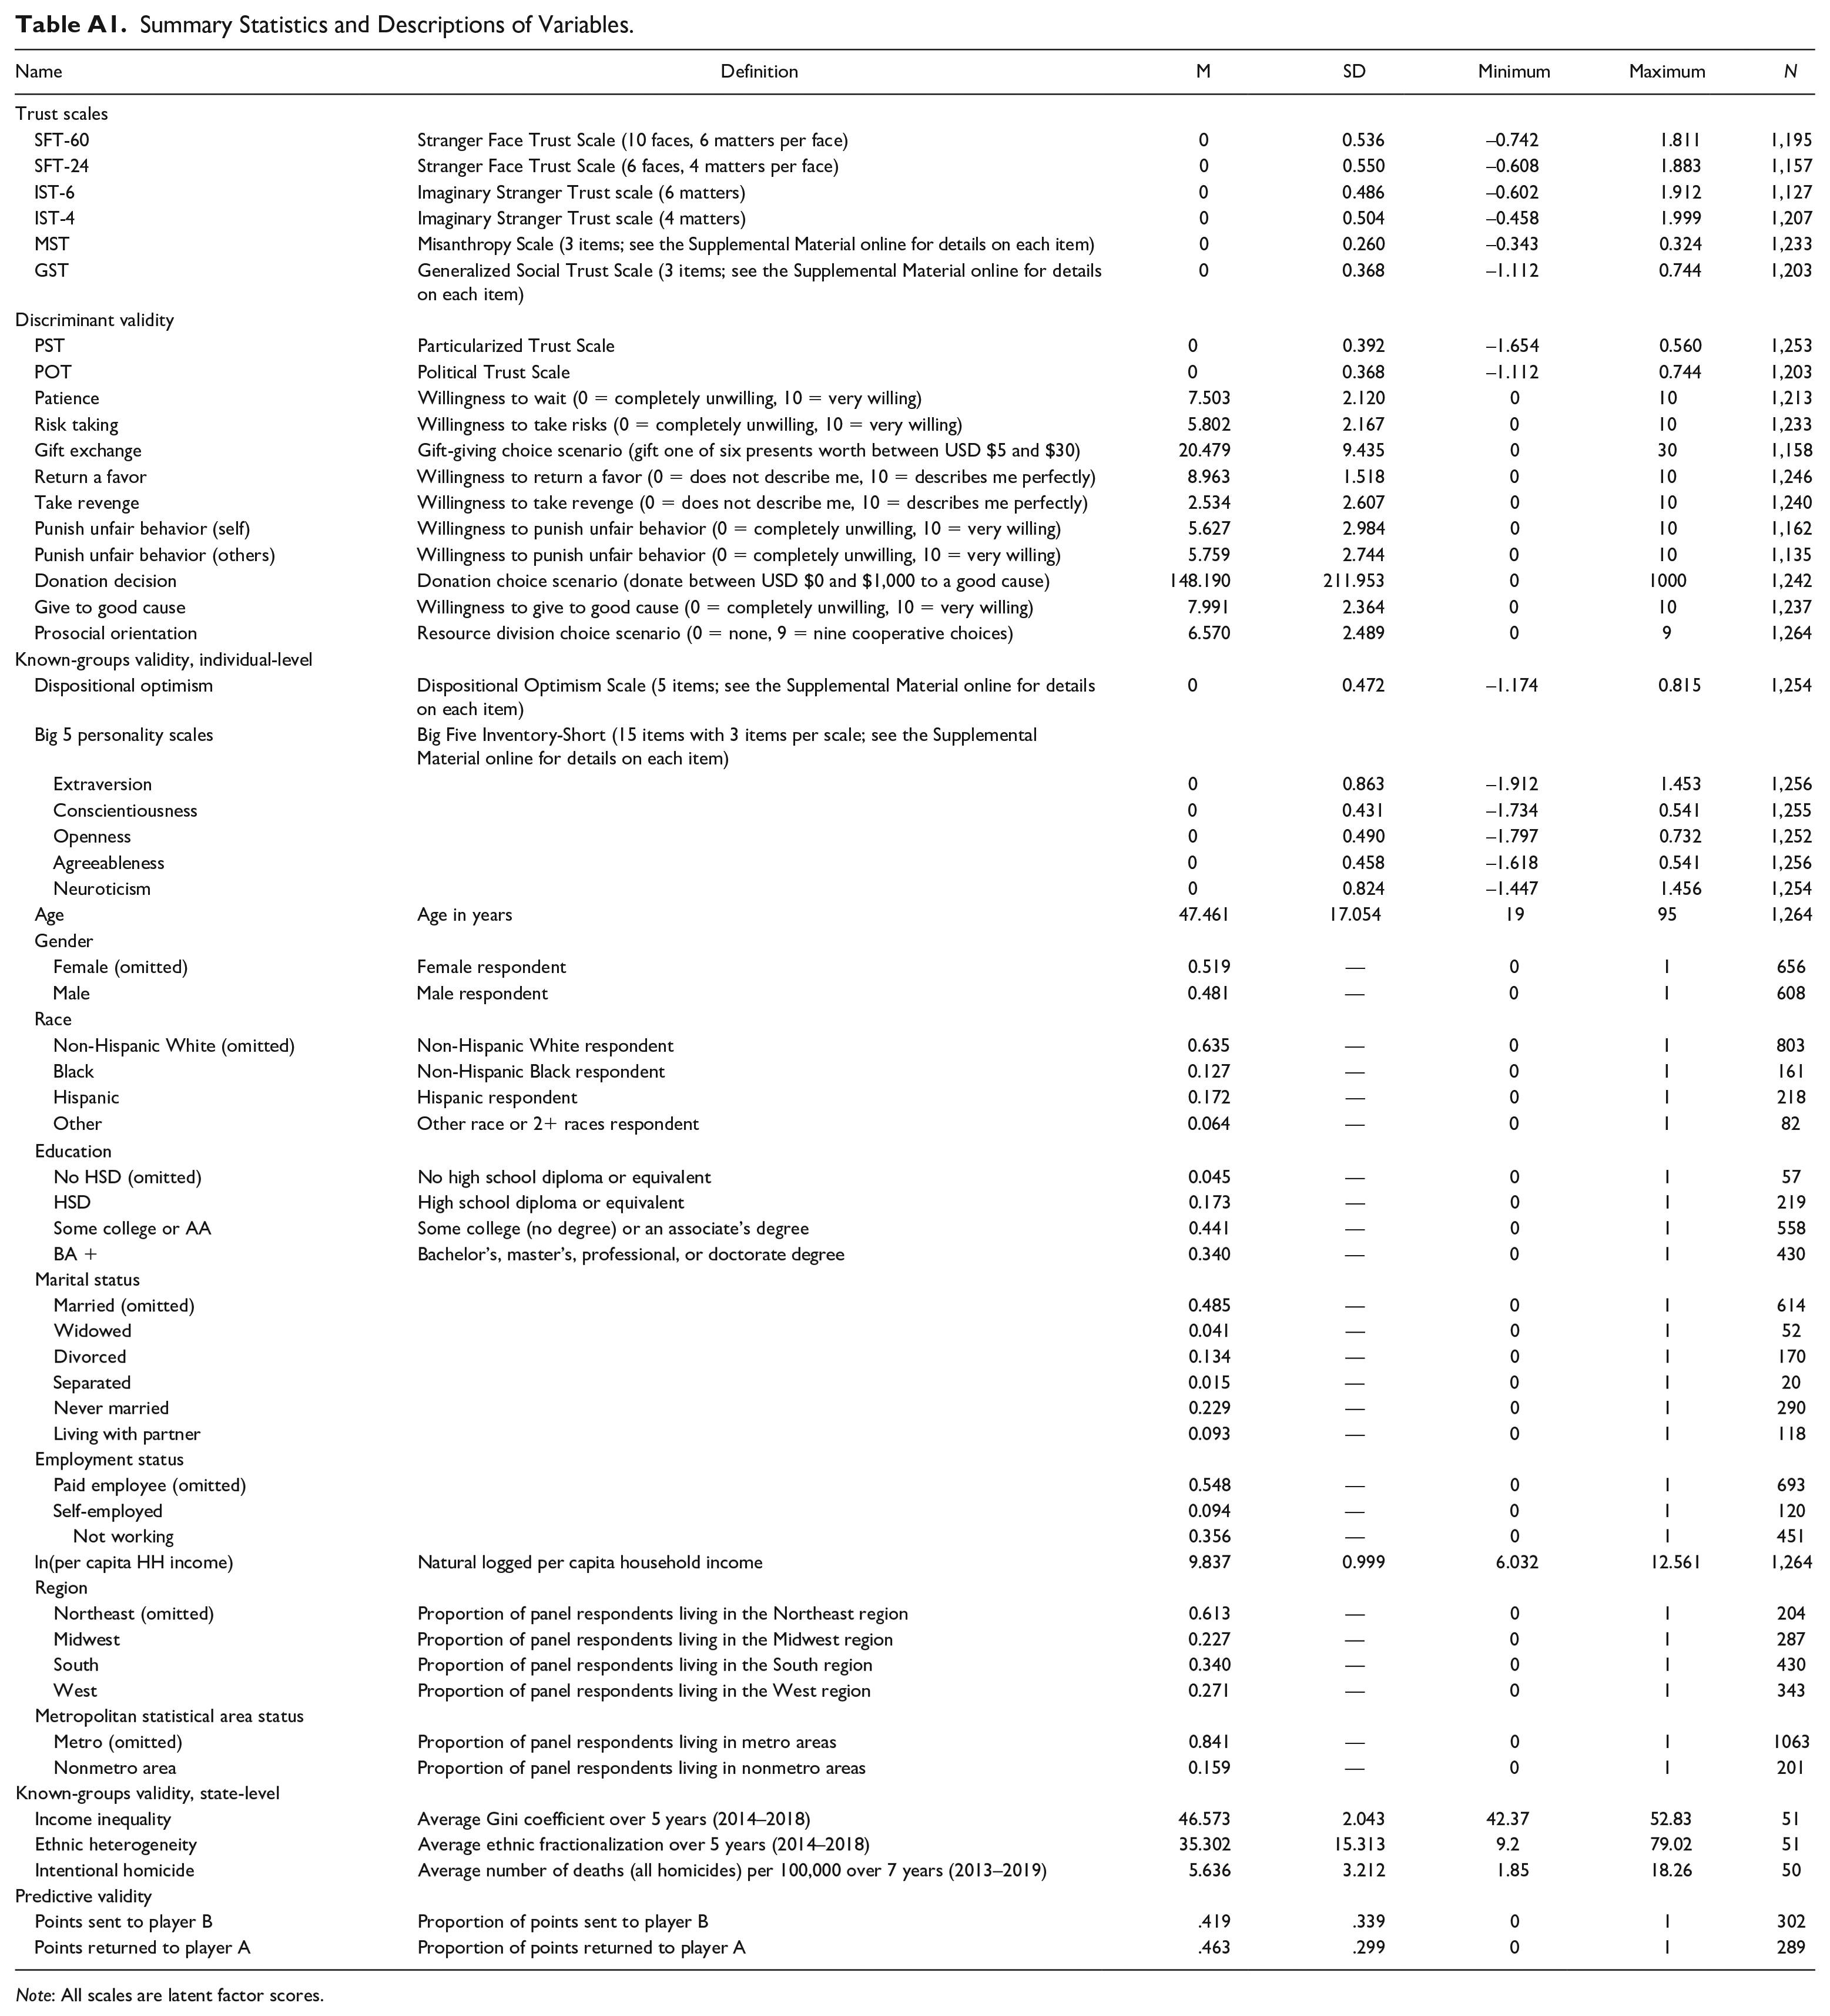
| Name | Definition | M | SD | Minimum | Maximum | N |
|---|---|---|---|---|---|---|
| Trust scales | ||||||
| SFT-60 | Stranger Face Trust Scale (10 faces, 6 matters per face) | 0 | 0.536 | –0.742 | 1.811 | 1,195 |
| SFT-24 | Stranger Face Trust Scale (6 faces, 4 matters per face) | 0 | 0.550 | –0.608 | 1.883 | 1,157 |
| IST-6 | Imaginary Stranger Trust scale (6 matters) | 0 | 0.486 | –0.602 | 1.912 | 1,127 |
| IST-4 | Imaginary Stranger Trust scale (4 matters) | 0 | 0.504 | –0.458 | 1.999 | 1,207 |
| MST | Misanthropy Scale (3 items; see the Supplemental Material online for details on each item) | 0 | 0.260 | –0.343 | 0.324 | 1,233 |
| GST | Generalized Social Trust Scale (3 items; see the Supplemental Material online for details on each item) | 0 | 0.368 | –1.112 | 0.744 | 1,203 |
| Discriminant validity | ||||||
| PST | Particularized Trust Scale | 0 | 0.392 | –1.654 | 0.560 | 1,253 |
| POT | Political Trust Scale | 0 | 0.368 | –1.112 | 0.744 | 1,203 |
| Patience | Willingness to wait (0 = completely unwilling, 10 = very willing) | 7.503 | 2.120 | 0 | 10 | 1,213 |
| Risk taking | Willingness to take risks (0 = completely unwilling, 10 = very willing) | 5.802 | 2.167 | 0 | 10 | 1,233 |
| Gift exchange | Gift-giving choice scenario (gift one of six presents worth between USD $5 and $30) | 20.479 | 9.435 | 0 | 30 | 1,158 |
| Return a favor | Willingness to return a favor (0 = does not describe me, 10 = describes me perfectly) | 8.963 | 1.518 | 0 | 10 | 1,246 |
| Take revenge | Willingness to take revenge (0 = does not describe me, 10 = describes me perfectly) | 2.534 | 2.607 | 0 | 10 | 1,240 |
| Punish unfair behavior (self) | Willingness to punish unfair behavior (0 = completely unwilling, 10 = very willing) | 5.627 | 2.984 | 0 | 10 | 1,162 |
| Punish unfair behavior (others) | Willingness to punish unfair behavior (0 = completely unwilling, 10 = very willing) | 5.759 | 2.744 | 0 | 10 | 1,135 |
| Donation decision | Donation choice scenario (donate between USD $0 and $1,000 to a good cause) | 148.190 | 211.953 | 0 | 1000 | 1,242 |
| Give to good cause | Willingness to give to good cause (0 = completely unwilling, 10 = very willing) | 7.991 | 2.364 | 0 | 10 | 1,237 |
| Prosocial orientation | Resource division choice scenario (0 = none, 9 = nine cooperative choices) | 6.570 | 2.489 | 0 | 9 | 1,264 |
| Known-groups validity, individual-level | ||||||
| Dispositional optimism | Dispositional Optimism Scale (5 items; see the Supplemental Material online for details on each item) | 0 | 0.472 | –1.174 | 0.815 | 1,254 |
| Big 5 personality scales | Big Five Inventory-Short (15 items with 3 items per scale; see the Supplemental Material online for details on each item) | |||||
| Extraversion | 0 | 0.863 | –1.912 | 1.453 | 1,256 | |
| Conscientiousness | 0 | 0.431 | –1.734 | 0.541 | 1,255 | |
| Openness | 0 | 0.490 | –1.797 | 0.732 | 1,252 | |
| Agreeableness | 0 | 0.458 | –1.618 | 0.541 | 1,256 | |
| Neuroticism | 0 | 0.824 | –1.447 | 1.456 | 1,254 | |
| Age | Age in years | 47.461 | 17.054 | 19 | 95 | 1,264 |
| Gender | ||||||
| Female (omitted) | Female respondent | 0.519 | — | 0 | 1 | 656 |
| Male | Male respondent | 0.481 | — | 0 | 1 | 608 |
| Race | ||||||
| Non-Hispanic White (omitted) | Non-Hispanic White respondent | 0.635 | — | 0 | 1 | 803 |
| Black | Non-Hispanic Black respondent | 0.127 | — | 0 | 1 | 161 |
| Hispanic | Hispanic respondent | 0.172 | — | 0 | 1 | 218 |
| Other | Other race or 2+ races respondent | 0.064 | — | 0 | 1 | 82 |
| Education | ||||||
| No HSD (omitted) | No high school diploma or equivalent | 0.045 | — | 0 | 1 | 57 |
| HSD | High school diploma or equivalent | 0.173 | — | 0 | 1 | 219 |
| Some college or AA | Some college (no degree) or an associate’s degree | 0.441 | — | 0 | 1 | 558 |
| BA + | Bachelor’s, master’s, professional, or doctorate degree | 0.340 | — | 0 | 1 | 430 |
| Marital status | ||||||
| Married (omitted) | 0.485 | — | 0 | 1 | 614 | |
| Widowed | 0.041 | — | 0 | 1 | 52 | |
| Divorced | 0.134 | — | 0 | 1 | 170 | |
| Separated | 0.015 | — | 0 | 1 | 20 | |
| Never married | 0.229 | — | 0 | 1 | 290 | |
| Living with partner | 0.093 | — | 0 | 1 | 118 | |
| Employment status | ||||||
| Paid employee (omitted) | 0.548 | — | 0 | 1 | 693 | |
| Self-employed | 0.094 | — | 0 | 1 | 120 | |
| Not working | 0.356 | — | 0 | 1 | 451 | |
| ln(per capita HH income) | Natural logged per capita household income | 9.837 | 0.999 | 6.032 | 12.561 | 1,264 |
| Region | ||||||
| Northeast (omitted) | Proportion of panel respondents living in the Northeast region | 0.613 | — | 0 | 1 | 204 |
| Midwest | Proportion of panel respondents living in the Midwest region | 0.227 | — | 0 | 1 | 287 |
| South | Proportion of panel respondents living in the South region | 0.340 | — | 0 | 1 | 430 |
| West | Proportion of panel respondents living in the West region | 0.271 | — | 0 | 1 | 343 |
| Metropolitan statistical area status | ||||||
| Metro (omitted) | Proportion of panel respondents living in metro areas | 0.841 | — | 0 | 1 | 1063 |
| Nonmetro area | Proportion of panel respondents living in nonmetro areas | 0.159 | — | 0 | 1 | 201 |
| Known-groups validity, state-level | ||||||
| Income inequality | Average Gini coefficient over 5 years (2014–2018) | 46.573 | 2.043 | 42.37 | 52.83 | 51 |
| Ethnic heterogeneity | Average ethnic fractionalization over 5 years (2014–2018) | 35.302 | 15.313 | 9.2 | 79.02 | 51 |
| Intentional homicide | Average number of deaths (all homicides) per 100,000 over 7 years (2013–2019) | 5.636 | 3.212 | 1.85 | 18.26 | 50 |
| Predictive validity | ||||||
| Points sent to player B | Proportion of points sent to player B | .419 | .339 | 0 | 1 | 302 |
| Points returned to player A | Proportion of points returned to player A | .463 | .299 | 0 | 1 | 289 |
Note: All scales are latent factor scores.
Acknowledgements
I am indebted to Elisa Bienenstock, Sara Degli Esposti, Diego Gambetta, Jennifer Glanville, Maria Grigoryeva, Morgan Hardy, Francisco Herreros, Georgia Michailidou, Nikos Nikiforakis, and Ernesto Reuben for helpful conversations and/or suggestions. Seminar participants of the Institute of Public Goods and Policies at the Spanish National Research Council and the Center for Behavioral Institutional Design at NYU Abu Dhabi provided invaluable comments. Finally, I would like to thank John Dombrowski, Stefan Subias, and Mark Watts from NORC for their research assistance.
Funding
The research reported here was financially supported by the Center for Behavioral Institutional Design and Tamkeen under the NYU Abu Dhabi Research Institute Award CG005.
Supplemental Material
Supplemental material for this article is available online.
Notes
Author Biography
References
Supplementary Material
Please find the following supplemental material available below.
For Open Access articles published under a Creative Commons License, all supplemental material carries the same license as the article it is associated with.
For non-Open Access articles published, all supplemental material carries a non-exclusive license, and permission requests for re-use of supplemental material or any part of supplemental material shall be sent directly to the copyright owner as specified in the copyright notice associated with the article.