
Abstract
Nonprofits provide a range of human and social services in the United States, producing what some call the delegated welfare state. The authors aim to quantify inequities in nonprofit service provision by focusing on two types of vulnerabilities: spatial and socio-demographic. Specifically, the authors develop a service accessibility index to identify mismatch between population demand and locational supply of nonprofits. The authors apply the index to an original data set of more than 1,500 immigrant-serving legal and health organization in California, Nevada, and Arizona. The authors find that immigrants living in rural areas are underserved, especially in access to justice, compared with those in metropolitan areas but that residents of smaller cities have better access, especially to health services, than those in larger cities. The service accessibility index not only brings such inequities into relief but raises critical questions about the determinants and consequences of service-access variability, for vulnerable immigrants and others dependent on the nonprofit safety net.
A wide range of human and social services are provided through nonprofit organizations in the United States. Whether conceptualized as the delegated welfare state, the shadow state, contracted government, or third-party government (Marwell 2004; Morgan and Campbell 2011; Salamon 1987; Trudeau 2008), researchers underscore how U.S. governments from the municipal to the federal level delegate critical service functions to the private sector, both to for-profit companies and not-for-profit organizations. These services range from health care and child welfare to legal help and basic food assistance. In the absence of an overarching government service-delivery infrastructure, this patchwork of human and social services raises critical questions about efficiency (are services located where they are needed to serve the greatest number of vulnerable individuals?) as well as equity (are services available to diverse groups in a fair manner?).
We advance a novel conceptualization and methodology to consider efficiency and equity in the delegated state by focusing on two key axes of inequity: spatial vulnerability (locational inequity) and material vulnerability (sociodemographic inequity). In particular, we consider the spatial location of legal and health services and the unique vulnerabilities of poor or uninsured immigrants. When it comes to locational inequity, a growing body of research underscores the problems faced by rural communities in accessing nonprofit services (see Walters 2020 for a review) or in suburban communities, which are rapidly diversifying because of their residents’ social-economic and ethnoracial background (Allard 2009; Murphy and Wallace 2010; Schnake-Mahl and Sommers 2017). In terms of sociodemographic vulnerability, immigrants regularly face linguistic barriers, anti-immigrant discrimination on the basis of culture, religion, or ethnoracial origins, and exclusion because of noncitizenship, in addition to socioeconomic marginalization (Cordero-Guzmán 2005; Derose, Escarce, and Lurie 2007; Lee and De Vita 2005; Roth, Gonzales, and Lesniewski 2015). Undocumented immigrants are especially vulnerable (Carrillo 2018; Gleeson 2010; Torres and Waldinger 2015). We identify and examine spatial and sociodemographic patterns of service inequality to elucidate where and for whom the supply of nonprofit services has yet to satisfy demand.
We do this by developing a unique metric, adapted from the health care accessibility literature, to quantify spatial inequality in immigrants’ access to federally qualified health centers (FQHCs) and immigrant-centered nonprofit legal services. This metric, which we call the service accessibility index (SAI), is based on the two-step floating catchment area (2SFCA) methodology (Luo and Wang 2003; Wang and Luo 2005). The 2SFCA method underscores the importance of geographic space as a barrier to or a facilitator of service access. Although successful at measuring potential spatial inequities in hospital accessibility, the original 2SFCA method does not, however, take into account that service providers, even if located nearby, may not be accessible for all individuals, because of people’s legal status, socioeconomic situation, language abilities, or specific service needs. Our SAI extends the 2SFCA by considering aspatial factors, including service provisions, clinic capacity hours, and population-specific vulnerabilities. We also improve upon prior analyses by using real-world travel times—isochrones—instead of geographic map distance to better represent the experience of people seeking services. Finally, our index is calculated at the census tract level over three states, spanning a significantly larger geographic space at a more granular level of inference than most previous studies. 1
We demonstrate the utility of this index by applying it to a unique organizational data set of more than 1,500 health and legal nonprofits located across California, Arizona, and Nevada. Our approach advances a burgeoning scholarship on nonprofits and immigration—and speaks more broadly to research on the delegated welfare state and inequality—by developing an analytic measurement approach to jointly appraise spatial and sociodemographic barriers to access. In doing so, the index opens up a range of research questions, from studying the determinants of service inequality for vulnerable populations to measuring the impact of service inequities on the well-being of individuals and communities.
In what follows, we first outline the changing landscape of spatial and sociodemographic vulnerability in accessing human and social services, in particular, health and legal services. We then present our three-state data set of health and legal organizations alongside census tract–level demographic data. We introduce the SAI next, outlining how it draws on and improves upon prior quantitative work on service accessibility. In applying the SAI to a broad swath of the Southwest, we identify a complicated landscape of nonprofit accessibility. First, we find clear evidence of spatial inequities: immigrant communities in much of the study area do not have easy access to critical services. On average, residents of cities are better served than those living in rural areas, but smaller cities tend to have better access to health services than large cities. Suburbs vary widely in their service accessibility. Health clinics have a broader reach than legal clinics, with the latter largely confined to bigger cities. There are differences by state and city: access to services is more abundant on the coast than inland, better in California than Arizona and Nevada, and nearly absent in wide swaths of the study area. We speculate on some of the reasons for these patterns, and outline a number of avenues for future research, both to improve our metric and to investigate the determinants as well as the consequences of service inequities. We encourage use of the SAI as a tool for researchers, policy makers and nonprofit service providers to identify locations with the most underserved demand.
Spatial and Sociodemographic Vulnerabilities in the Delegated State
Nonprofit organizations are a pillar of the civic and human services infrastructure of the United States, especially for low-income and marginalized residents (Allard 2009; Grønbjerg and Paarlberg 2001; Marwell 2004). Internal Revenue Service data on registered charitable 501(c)(3) nonprofits indicates that 284,329 organizations provided human services in 2016, ranging from food banks and homeless shelters to youth services and legal services. An additional 125,366 organizations provided other public and social benefits, while 82,752 had health care as their primary mission (McKeever 2018). These numbers have exploded from just 20 years earlier. Considering those filing tax forms (mandated for nonprofits meeting a modest floor of revenues), the number of human service nonprofits increased more than threefold, from just under 72,000 in 1995 to just over 241,000 in 2016 (Hilgert and Whitten 1999; McKeever 2018). These organizations use private donations, fees, and other resources to fill gaps in the U.S. safety net, and they receive contracts from federal, state, and local governments, a phenomenon sometimes referred to as the delegated welfare state (Morgan and Campbell 2011; Salamon 1995; Smith and Lipsky 1993; Weir and Schirmer 2018). 2 In one study of the San Francisco Bay area in 2019, 14 percent of residents who reported problems securing food or housing or paying bills in the prior 12 months said that they turned to nonprofit organizations for help; in early 2021, during the coronavirus disease 2019 pandemic, the proportion almost doubled to 25 percent (Bloemraad et al. 2021). Whether conceived of negatively as the privatization of public welfare or viewed positively as promoting agile public-private partnerships, the upshot is similar: disadvantaged residents in the United States rely on community-based organizations such as nonprofit health care clinics and legal aid providers for care and assistance.
Changing Geographies and Disadvantaged Populations
As dependence on nonprofits increases, these organizations simultaneously face a changing landscape of need, both with respect to where individuals live and the type of needs that residents experience. Suburbs were once the hallmark of the American middle class, but between 2010 and 2015, the number of residents living below the poverty line grew by 57 percent in the suburbs of the nation’s large metropolitan areas, a rate higher than in cities or rural areas, accounting for nearly half (48 percent) of the total national increase in the poor population (Kneebone 2017; Kneebone and Berube 2013). Nonprofit organizations and philanthropies have been slow to adjust to the changing geography of poverty, whether in metro Chicago, Atlanta, or Denver, staying in downtown areas even as gentrification and high housing prices push disadvantaged residents to inner- or outer-ring suburbs (Allard 2004, 2009; Holloway 2016; Reckhow and Weir 2012). We thus see evidence, across a number of regions, of spatial mismatch in nonprofit access, which we call spatial vulnerability.
Thus far, often because of data constraints, research on spatial service inequities has mostly involved case studies of a few cities or, when conducted at a broad geographic scale, such research often engages in state- or county-level comparisons (e.g., Kerwin and Millet 2022). However, an average county in our study area is about 4000 square miles, about the size of the Island of Hawaii, so we seek to bring both more precision and breadth to the identification and measurement of spatial vulnerability by drilling down to the census tract level and expanding across three diverse states. For services to be accessible, they must be located in sufficient proximity to the people that they serve so that travel to services is feasible. This is not just a question of distance on a map, but of the actual travel times between home and a nonprofit on local roads.
The literature on service accessibility also shows clear evidence of what we call sociodemographic vulnerability, which places immigrant communities at particular risk. The new geography of poverty is also a story of migration, with rapid demographic diversification of suburbs, midsize cities, and some rural areas. Nationally, in 2019, about 14 percent of the U.S. population was foreign born, a percentage that rises to a striking 27 percent in California (U.S. Census Bureau 2019). In America’s largest metropolitan areas, immigrants today are more likely to live in suburbs than central cities (Frey 2015; Hall and Lee 2010; Suro, Wilson, and Singer 2011). The Little Italys and Chinatowns in the gateway cities of yesteryear have given way to “melting pot” suburbs, “ethnoburbs,” “heterolocalism,” or places of two-way “relational assimilation” (Frey 2015; Jiménez 2017; Li 2009; Zelinsky and Lee 1998). Some of these immigrants are well off and employed in professional occupations. But researchers also find a marked increase in the number of low-income immigrants in new destinations. More than half (53 percent) of all poor immigrants who live in metropolitan areas reside in suburbs (Suro et al. 2011); various midsize cities and rural areas have also seen sharp increases in their immigrant populations (Katz et al. 2010; Massey 2008). Immigrant-origin residents may confront additional vulnerabilities because of their legal status, cultural differences, mother tongues, religions, or ethnoracial backgrounds. Barely half of all foreign-born residents hold U.S. citizenship, about 11 million are undocumented, and the overwhelming majority have first languages other than English (Esterline and Batalova 2022).
These multiple vulnerabilities, from financial to linguistic barriers, can make it difficult for immigrants to access existing services even when they are nearby, reinforcing inequities in access to health and justice. Immigrants might also require specialized services that traditional organizations are poorly equipped to provide (e.g., legal assistance with asylum applications, bilingual and multicultural health services). Undocumented immigrants, fearing deportation, may be especially reluctant to seek services from traditional venues. Given these barriers, it is not surprising that existing research suggests that immigrant communities are particularly underserved by the U.S. nonprofit landscape. For example, even though the San Francisco Bay area ranks in the top 10 as a nonprofit-rich metropolitan area in the United States (Hayes et al. 2015:9), de Graauw, Gleeson, and Bloemraad (2013) found that the proportion of immigrant nonprofits—17 percent of all registered nonprofit organizations—was much smaller than the immigrant share of the total population, at 38 percent. Similarly, in metropolitan Chicago, researchers found that the nonprofit safety net for immigrants was thinner and more stretched than for nonimmigrants (Roth et al. 2015). In both cases, researchers concluded that “mainstream” nonprofits fail to adequately extend services tailored to the unique needs of immigrant populations. A central argument in this article is that researchers must consider, jointly, spatial and sociodemographic vulnerabilities in examining the delegated state, nonprofit organizations, and the well-being of disadvantaged communities such as immigrants.
Diversity of Nonprofit Services
In considering spatial and sociodemographic vulnerabilities, we further wonder whether inequalities in service access might vary by the type of legal, human and social services offered. The scholarship on nonprofit organizations debates, for instance, the extent to which nonprofit organizations are established in communities or places with more resources (e.g., places with a greater supply of financial or human capital; Grønbjerg and Paarlberg 2001; Wolch and Geiger 1983) or in communities or places where demand is strongest (e.g., places with service holes and disadvantaged populations; Bielefeld and Murdoch 2004; Bielefeld, Murdoch, and Waddell 1997). Examining immigrants’ access to legal and health services exposes distinct resource and demand dynamics.
When it comes to general nonprofit legal services, researchers find that they are not necessarily located in areas of greatest need, undermining demand accounts of nonprofit provision. A 2011 report by the Civil Justice Infrastructure Mapping Project notes that “the public’s civil legal needs are not routinely assessed and no entity can ensure that services in specific areas match the needs of the eligible populations in those areas,” leading to widespread fragmentation and inequality (Sandefur and Smyth 2011). Generally, these organizations appear to be located in larger cities and in wealthier and politically progressive jurisdictions (Albiston, Li, and Nielsen 2017). Access to justice, as measured by clinic location, is thus shaped by local political climate and financial resources more than demand (Albiston et al. 2017).
It is plausible that existing gaps in legal services might be especially dire for immigrants, given the specialized nature of immigrant legal services (which require staff members with particular training) and legislation barring organizations that receive federal Legal Services Corporation funding from assisting noncitizens (Legal Services Corporation 2020). A burgeoning literature on immigrants’ access to justice emphasizes the importance of legal representation in detained immigrants’ success in receiving a bond hearing, in appealing a removal order, and getting relief from deportation (Eagly and Shafer 2015; Hausman 2016; Ryo 2018). This scholarship has, understandably, focused on arguably the most high-stakes legal cases: seeking asylum or relief from detention and deportation. However, as Kerwin and Millet (2022:193–95) noted, every year the U.S. Citizenship and Immigration Services receives millions of applications, petitions and requests—almost 9 million in 2021 alone—and we know little about how access to legal services affects immigrants’ ability to successfully navigate this administrative and legal labyrinth.
Studies of health-related organizations and residential segregation do find that these organizations are more frequently found in neighborhoods with a high proportion of immigrants, or where need (“demand”) might be more acute (Anderson 2017; Koschinsky et al. 2022). A possible reason is that health clinics, more so than legal clinics, may be set up to serve a wider segment of the population, aimed at low-income or minority residents overall (Derose et al. 2007; Edward and Hines-Martin 2015). U.S. governments have a longer history of targeting health access than legal access, even though the United States is comparatively behind many other rich democracies in its health outcomes. The Health Resources and Services Administration (HRSA), for example, promotes programs, and gives funding, to “provide health care to people who are geographically isolated, economically or medically vulnerable” (HRSA 2019). HRSA-funded clinics prioritize people and places that need services most, and in some parts of the country, this could include immigrants. 3 In short, supply barriers might be mitigated in some areas of health care, such as child and maternal health, where providers (at times) cast a wide net that can include foreign-born residents with precarious legal status, but such outreach may not occur in the area of legal services. For this reason, we focus on FQHCs as a comparison point with nonprofit legal services.
Data: Immigrant Nonprofit Services in California, Nevada, and Arizona
Further progress on such questions of service inequalities and variation—their prevalence, causes, and consequences—requires, as a first step, better general-use metrics to identify inequities. As part of our evaluation, we collected comprehensive information on population demographics and nonprofit organizations in all 90 counties in California, Arizona and Nevada. This area encompasses more than 10,000 census tracts with a total population of 49 million. We identified more than 1,500 nonprofit services—1,246 health clinics and 312 legal clinics—that were located in 50 of 58 counties in California, 14 of 15 counties in Arizona, and 7 of 17 counties in Nevada. These counties vary considerably in their immigrant populations. Foreign-born residents make up 27 percent of the population in California, 19 percent in Nevada, and 13 percent in Arizona (U.S. Census Bureau 2018a; summarized in Table 1). This population is highly diverse, including high-income naturalized residents with strong English language skills, and noncitizens living in poverty with limited English proficiency. Drawing on population data from the American Community Survey’s (ACS) 2018 five-year estimates, we concentrate on two groups with sociodemographic vulnerability: the foreign-born population without health insurance (approximately 2 million in the study area) and the noncitizen population (approximately 6 million).
Summary of Study Population.
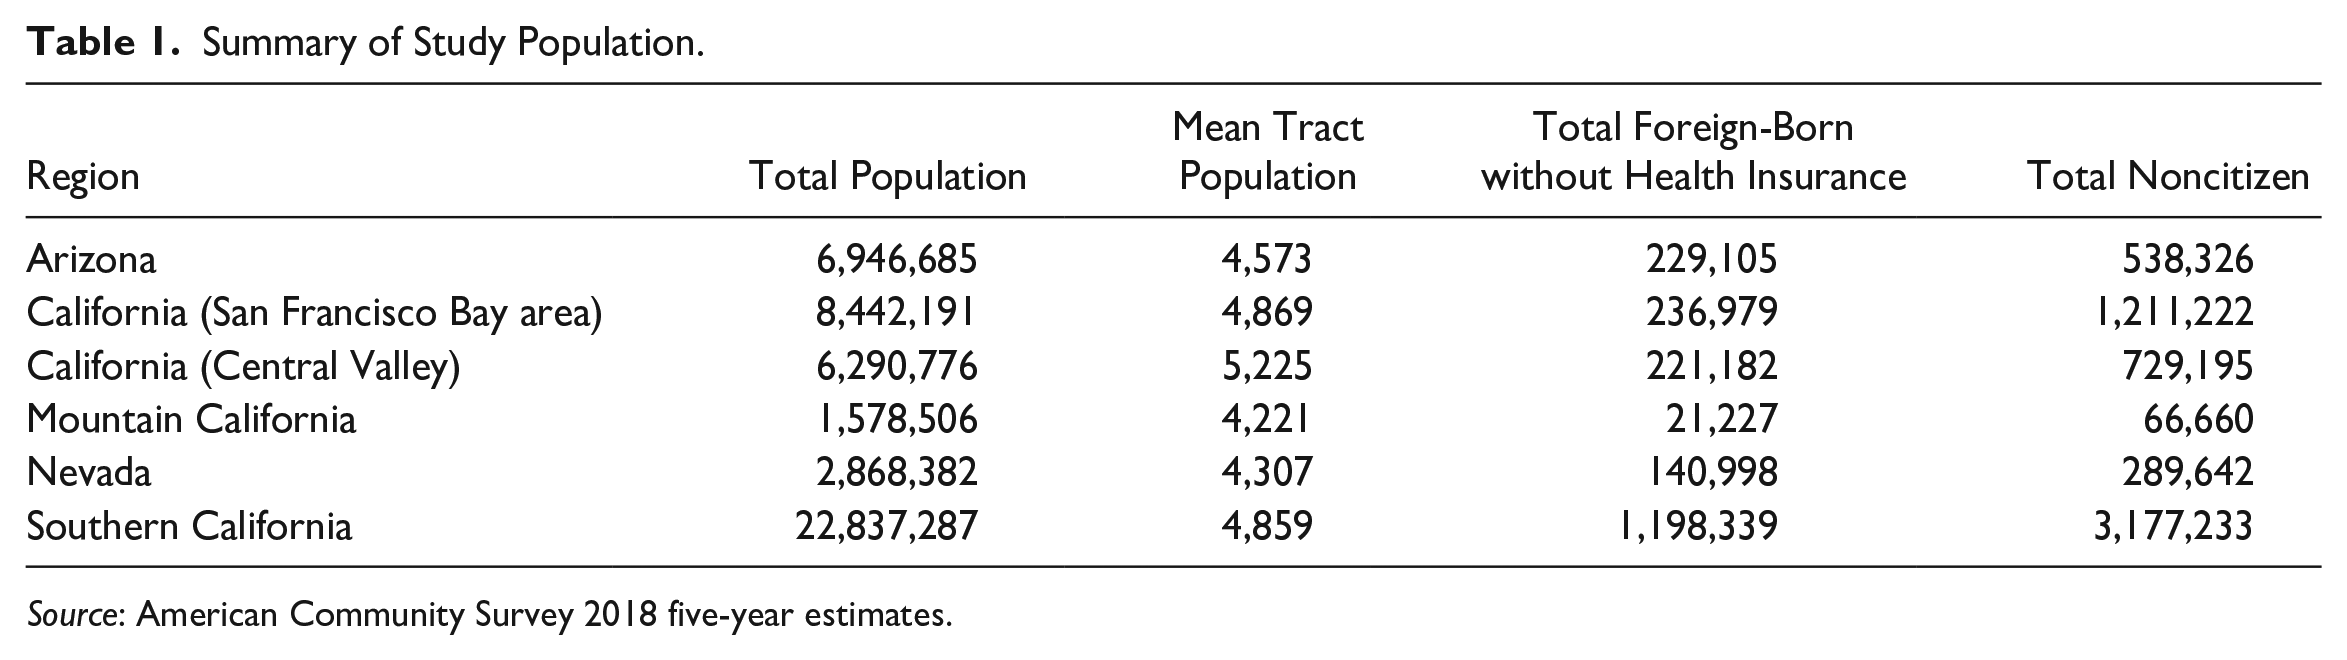
Source: American Community Survey 2018 five-year estimates.
We investigate two types of services particularly germane to immigrants, and especially to noncitizens: health care clinics serving populations without health insurance and/or who are legally precarious, and organizations providing immigrant legal services. We identify all FQHCs listed in the HRSA Data Warehouse from the U.S. Department of Health and Human Services with ZIP codes in our region of interest. These are community-based and consumer-run clinics that provide health services to populations with limited access to health care. 4 For immigrant legal service providers, we compiled a unique data set of nonprofits by identifying all relevant organizations listed in the Immigration Advocates Network National Immigration Legal Services Directory, the Catholic Legal Immigration Network, and the U.S. Department of Justice Executive Office for Immigration Review. These sources were chosen, together, to produce a list of legal services oriented to immigrants as no single list similar to the HRSA data set exists. 5
For each health and legal organization, a team of researchers verified the continued existence of the organization and collected information regarding the services offered, types of assistance provided, opening hours, and other information as listed on each organization’s Web site. We use these data to assess, quantitatively, service accessibility. As we describe further below, service accessibility is measured as a combination of core services offered and opening hours. Table 2 shows that the most frequent service offered by health clinics are primary care services (offered at 938 of 1,246 clinics [75 percent], which includes pediatric care and adult medicine), followed by women’s health (54 percent) and behavioral and mental health (51 percent). These services are not necessarily immigrant specific; that designation comes more from language-specific services (Spanish at 48 percent of clinics and Chinese, Tagalog, or Vietnamese at 12 percent to 14 percent of clinics), not requiring a Social Security number (38 percent), serving the uninsured (78 percent), and providing fee-free or sliding-scale services (49 percent). For legal service providers (see Table 3), the most frequent services offered include naturalization and citizenship (67 percent of the 312 nonprofits), followed by assistance with U visas (60 percent), adjustment of status (49 percent) and Deferred Action for Childhood Arrivals (27 percent). The most served language is Spanish (55 percent; all others ≤5 percent); approximately one third of nonprofits advertise fee-free or sliding-scale services. In Arizona and Nevada, a supermajority of services are aimed at Spanish-speaking immigrants from Mexico, Central America, and South America. In California, non-English-language services vary regionally; whereas some areas are predominantly Spanish speaking, in parts of the San Francisco Bay area and Los Angeles, a plurality of organizations offer language support in Chinese and Tagalog.
Health Clinics Services Offered (n = 1,246).
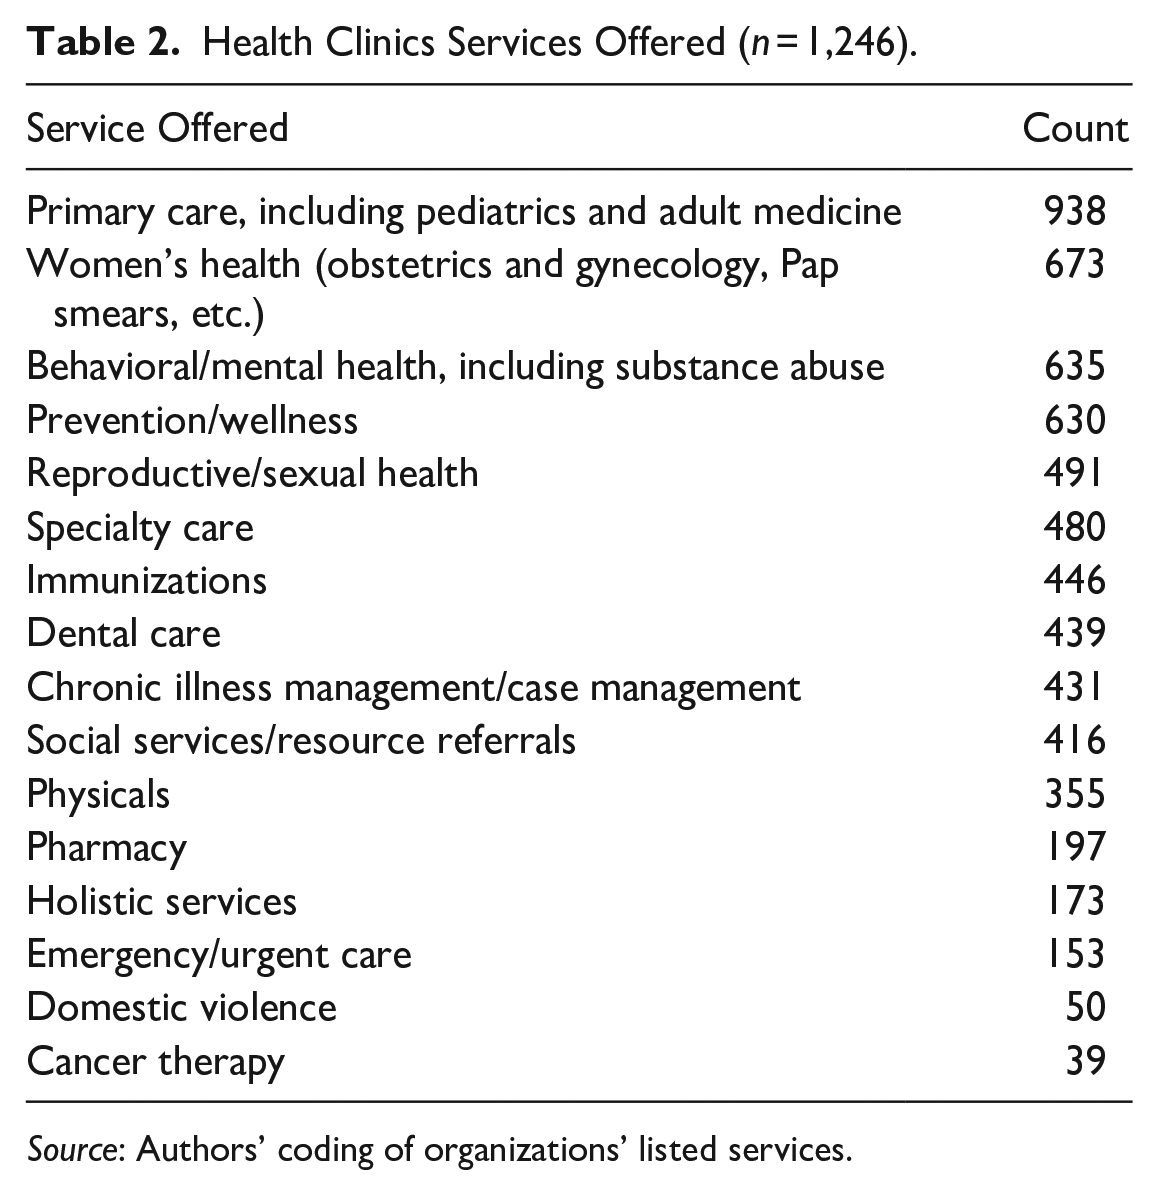
Source: Authors’ coding of organizations’ listed services.
Legal Clinics Service and Access (n = 312).
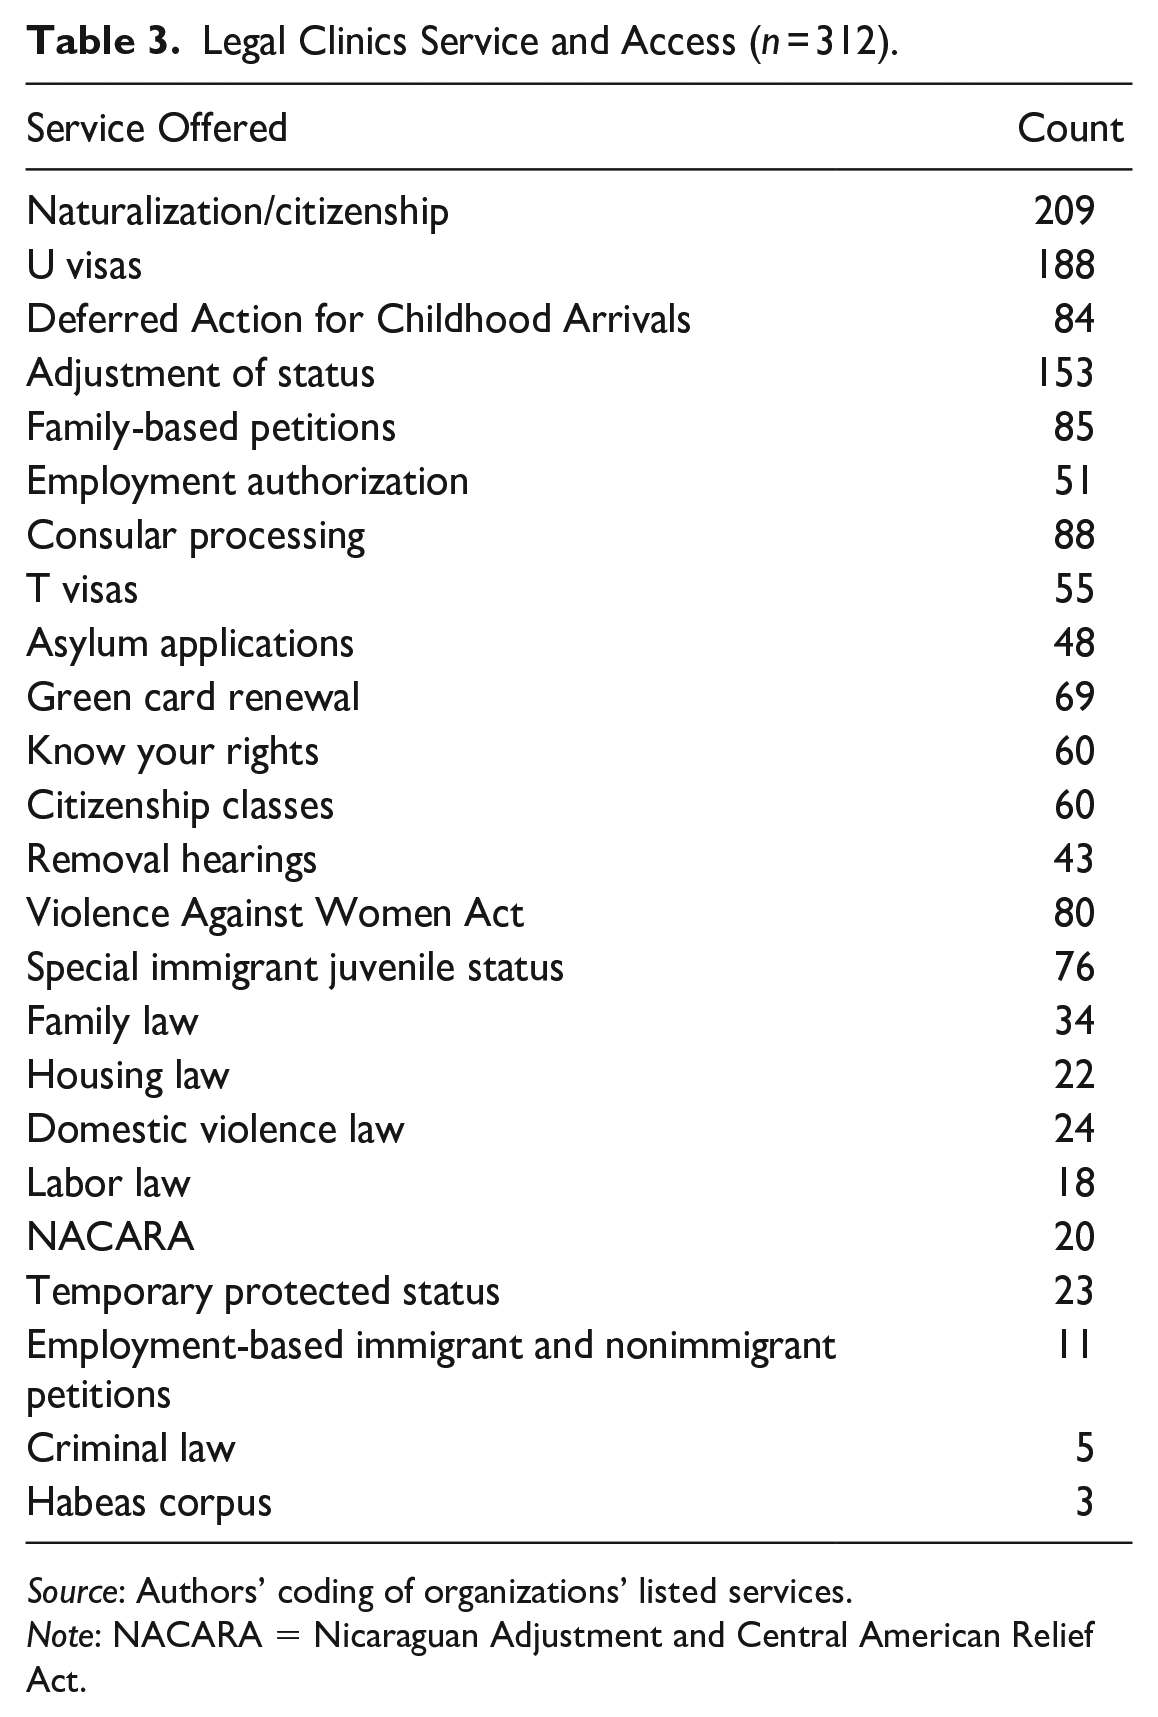
Source: Authors’ coding of organizations’ listed services.
Note: NACARA = Nicaraguan Adjustment and Central American Relief Act.
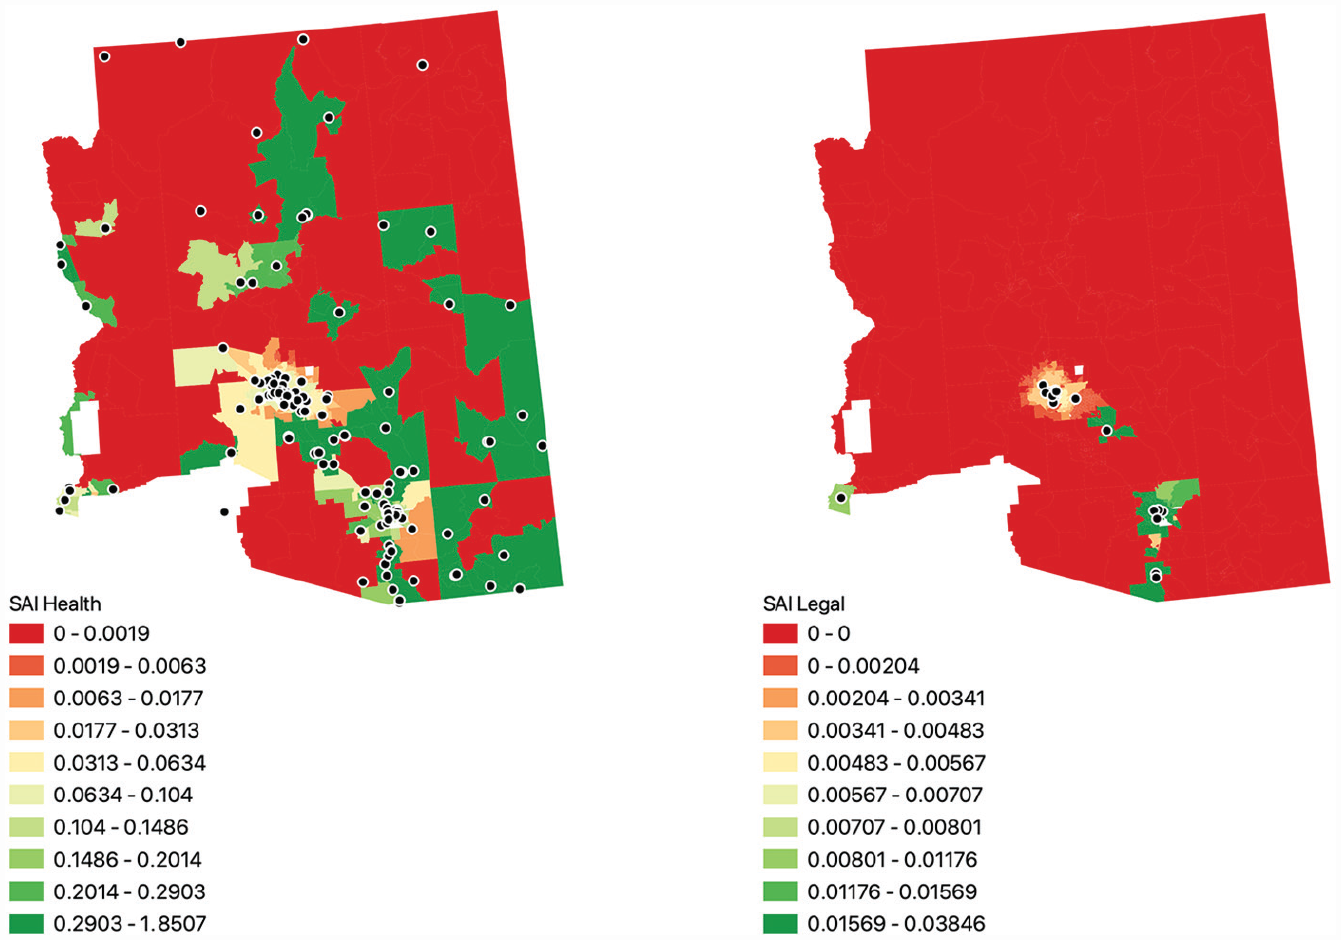
The identified organizations are mainly concentrated in urban areas, which include the San Francisco Bay area in northern California; Bakersfield, Fresno, and Sacramento in California’s Central Valley; Los Angeles and San Diego in southern California; the Phoenix and Tucson metropolitan areas in Arizona; Las Vegas, Nevada; and Reno–Carson City, Nevada. Clinics tend to be fairly sparse in nonurban areas, especially in Nevada and Arizona, as seen in Figure 1. We divide our study area into six regions: the San Francisco Bay area, California; Central Valley, California; southern California; mountain California; Nevada; and Arizona. Regionalization is necessary for map display and facilitates data management and analysis. These regions were chosen to be geographically contiguous areas respective of state boundaries and roughly of equal population (although southern California is larger than the other areas). These regions are also chosen to be similar in terms of immigrant origin: the San Francisco Bay area and southern California are highly diverse in terms of origin countries, whereas the Central Valley, Arizona, and Nevada are majority Hispanic origin.

Locations of health clinics (left) and legal clinics (right).
The regions of study vary considerably in urbanicity, population density, and natural landscape. Whereas parts of coastal California are densely settled—especially near San Francisco, Los Angeles, and San Diego—the Central Valley contains many sprawling cities amid farmlands. Nevada and Arizona each contain two urban cores—Las Vegas and Reno–Carson City in Nevada and Phoenix and Tucson in Arizona—surrounded by sparsely populated, rugged desert terrain. Because of low population, census tracts in these areas can be quite large. We note that rural areas in the Southwest differ in natural and human geography greatly from rural areas in other parts of the country: instead of the relatively regularly spaced small communities or farms that exist through the rural Southeast, for example, large swaths of the Southwest are very sparsely populated, if at all.
Measuring Service Accessibility: Population Needs, Nonprofit Services, and Spatial Proximity
Although our substantive focus is on immigrant populations and health or legal services, our aim is to develop a general-use metric to adequately assess, in a single quantitative measure, both inequality in the spatial location of services and the sociodemographic vulnerabilities of the local service population. Our SAI aims to do so by being attentive to both the existence of a local nonprofit with specific services and opening hours and the size of the vulnerable populations. A mismatch between organizational existence and services, on the one hand, and the size of the nearby vulnerable population, on the other, would severely strain the nonprofit safety net. This measure can be generalized to other vulnerable populations and used to study additional human, social and health services, from foodbanks to educational services.
Prior Demand and Supply Measures of Service Accessibility
In creating our SAI, we build on existing research employing spatial analyses, notably urban studies on neighborhoods (e.g., food “deserts,” neighborhood deprivation) and public health (e.g., health care access). Existing approaches to measuring spatial deprivation can be roughly separated into supply-focused indices, demand-focused indices, and indices that attempt to incorporate the spatial relation between supply and demand.
Supply-focused indices target the location of organizations and services. For example, the food desert index identifies places lacking access to fresh, low-cost and less-processed food (e.g., Lamb et al. 2015), thereby capturing the (un)availability of services. Such indices are, however, less successful in capturing demand (e.g., whether residents need nearby grocery stores because they lack access to a car). Conversely, demand-centered indices often focus on fine-grained population data to identify places likely in need of services. The standardized neighborhood deprivation index, for example, aims to pinpoint high-need places through principal-component analysis on census data covering five sociodemographic domains (education, employment, housing, occupation, and poverty; Messer et al. 2006). However, by only capturing deprivation, the standardized neighborhood deprivation index cannot capture the spatial relation between need and the actual supply of local services.
Recently, researchers have been making progress on novel approaches to capture supply of services and population demand simultaneously. Yasenov et al. (2020) proposed a simulation method to identify the best places to situate a hypothetical new legal services nonprofit, thereby tapping into the idea of unmet demand. They simulated placing a new legal clinic in each ZIP code in the country and reported how many low-income immigrants, living within a linear 12-mile radius, would now gain access to such a clinic. Such simulations help identify the optimal locations for new clinics by assessing marginal utility on the basis of population, and they used a method that they demonstrated is scalable nationally from a small-area level, a significant advance. However, the method treats all nonprofits as equivalent, without regard to available services or service-hours, and it must assume that linear distance reflects roughly similar travel times throughout the study area. This assumption does not always hold, for example, if there are no roads in some rural areas or because of physical features such as bodies of water or hilly terrain.
Another novel approach to calibrating supply and demand was offered by Luo and Wang with their 2SFCA method. The 2SFCA method was developed to assess health care accessibility such as population-to-physician ratios or population catchment information matched to health care provider availability (Luo and Wang 2003; Wang and Luo 2005). Luo and Wang’s work quantifies potential spatial accessibility, signifying the probable entry of an individual into the health care system, regardless of actual use of services. Koschinsky et al. (2022), for example, use this method to evaluate the (mis)match between Chicago residents’ poverty and their walking proximity to health care services funded by the city, primarily for human immunodeficiency virus and sexually transmitted infection screening and care. Ryo and Humphrey (2023) jointly considered the location of immigration attorneys and detained immigrants living in private residences within 50 linear miles of a lawyer. The 2SFCA method allows inference at the small-area level and spotlights how accessibility varies over geographic space, rather than seeking to eliminate spatial effects as a source of statistical error.
We build on the 2SFCA for its innovative method of combining two sets of calculations: (1) a measure of local demand for services (by calculating the ratio of services a clinic provides to a population within a certain travel time) and (2) a measure of service supply for each population location—census tracts, in our application (by summing all ratios within a certain distance of that census tract). Splitting the index into two steps allows an approximation of how larger populations (as measured by a count of individuals) can stress the capacity of clinics while also acknowledging that people seeking services may have multiple options within reach (Luo and Wang, 2003). A coarse way to conceive of the 2SFCA (and our proposed SAI) is to consider the indices as a ratio of services to population over a moving geographic window. A higher value of the index indicates that there are more services relative to the population, and a lower value indicates fewer services per population. The 2SFCA method also allows inferences about accessibility at a small-area level, a significant benefit as existing work at higher spatial resolutions can mask important population heterogeneity at the aggregate level. 6
Service Accessibility Index (SAI)
Luo and Wang (2003) noted that in focusing on potential spatial accessibility, their index fails to capture revealed accessibility—that is, actual service use—nor does it include what they term “aspatial barriers” to access, such as socioeconomic status, age, ethnicity-related language, or cultural obstacles. We face the same challenge with regard to actual service use, lacking data on this, but we improve on the second by considering what we conceptualize as sociodemographic vulnerability. Our proposed SAI thus expands from the 2SFCA method by incorporating a more targeted assessment of a specific populations of interest, and by changing and expanding the measure of service provisions.
In terms of services, we do not want to treat all organizations as interchangeable. Those with a broader array of services and longer opening hours are likely of greater utility to the target community. In the original 2SFCA method, service provision is measured by the number of physicians in a hospital or other health service location. In our data, an analogous measure of service providers (i.e., number of staff members) is unavailable. 7 Instead, we harmonized and aggregated the list of stated services offered by organizations into a standard set of core services and we coded service frequency on the basis of opening hours. For the SAI, we then take the number of core services offered by the clinic multiplied by the number of weekly opening hours:

Sj thus indicates the weekly service-hours as a measure of the clinic’s service capacity. Core services are listed in Table 4, which is built from the full list of services collected in our data set (see Methodological Appendix for details). This measure is imperfect in that it assumes that services offered are exhaustive and equivalent, but we believe that it is a good approximation of the utility of the clinic.
Core Services Used in the Calculation of Sj.
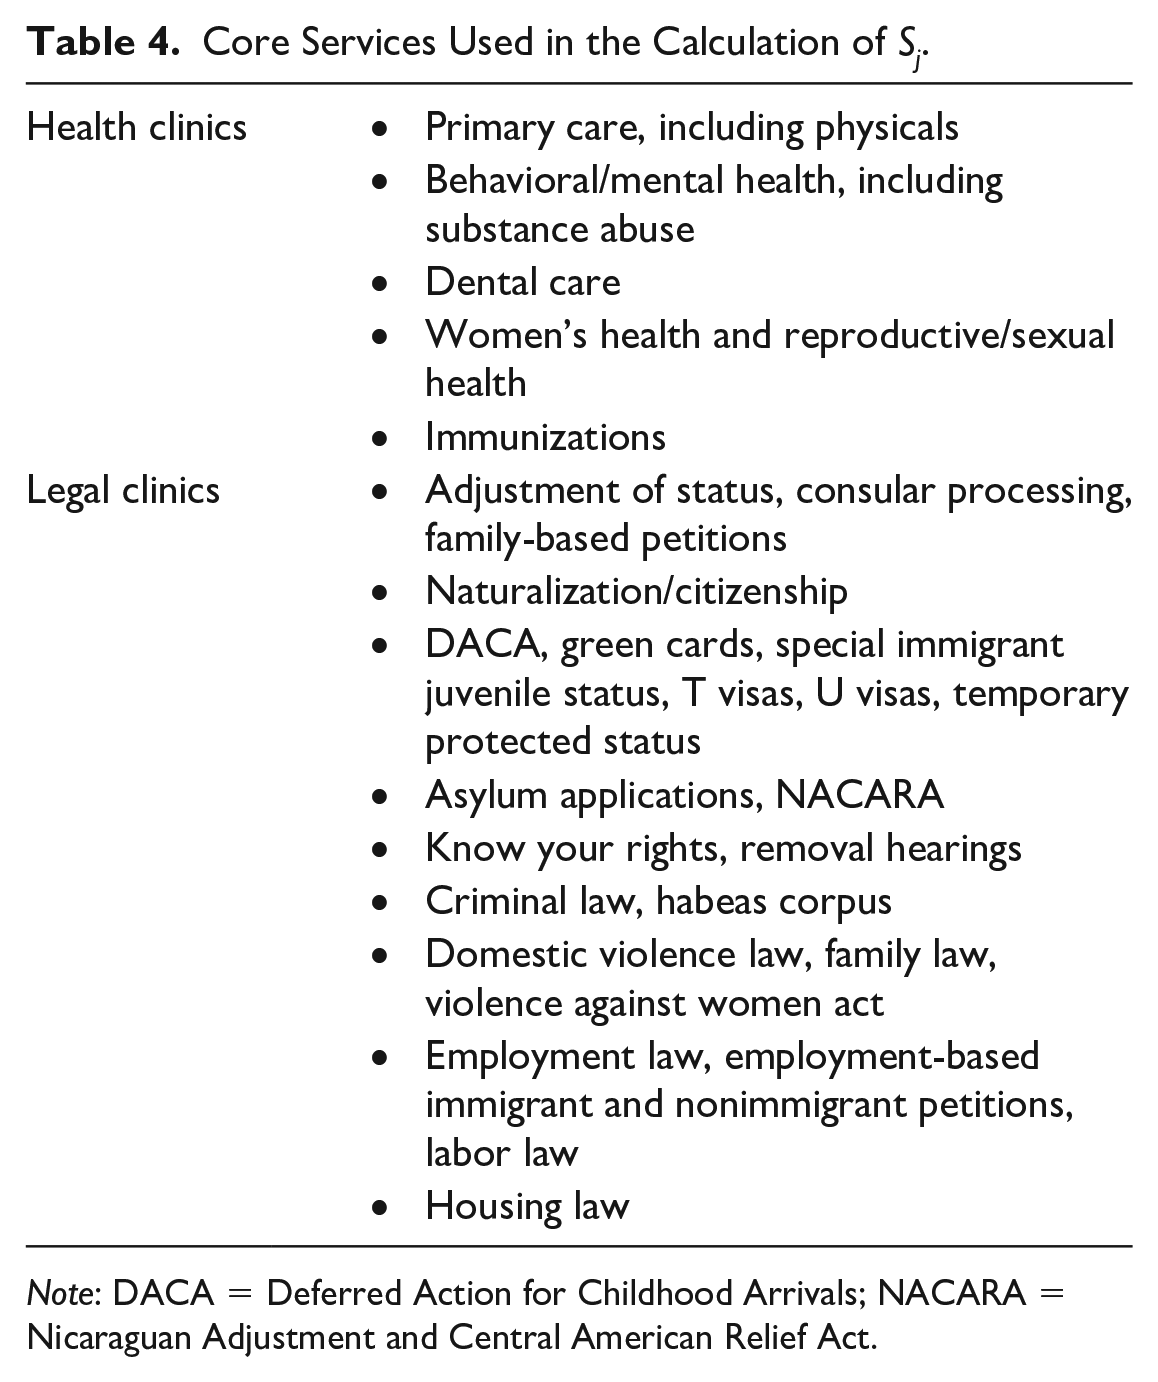
Note: DACA = Deferred Action for Childhood Arrivals; NACARA = Nicaraguan Adjustment and Central American Relief Act.
Median Tract Health and Legal Service Accessibility Index Aggregated by Census Defined Place.

Note: ACS = American Community Survey; CDP = census-designated place; SAI = service accessibility index.
Median Tract Health and Legal Service Accessibility Index Aggregated by Census Defined Urbanized Areas.

Note: ACS = American Community Survey; SAI = service accessibility index.
Most nonprofits in our data set offer one or more of the identified core services. Of the 1,246 health clinics, only 20 do not provide any core health services; of the 307 legal organizations, only 20 do not provide any core legal services. As not every nonprofit offers a core service, the number of services for each organization is increased by one to accommodate organizations that would otherwise have an Sj of 0, which would have effectively removed them from the data set. We retain these nonprofits because they do offer some targeted services of presumable importance to some clients. For organizations with missing data on opening hours, we impute the median value of 40 hours of services per week. The distributions of Sj for health and legal clinics are shown in Figures 2 and 3. Visually, Sj follows a normal-like distribution with a slight right skew, indicating that while the mode, mean, and median are approximately equal, there are a number of clinics that appear more “full service” than others, with longer opening hours and/or offering more core services.

Distribution of service-hours, defined as (number of core services + 1) × (weekly opening hours), for health clinics in the study area.

Distribution of service-hours, defined as (number of core services + 1) × (weekly opening hours), for legal clinics in the study area.
We calculate two separate indices for legal and health services to include distinct target populations for each type of service. Each index references the relevant population of interest—Pai, the count of people of in demographic group a in census tract i—in conjunction with Sbj, the number of service-hours clinic j provides, where b indicates legal or health services offered. First, to capture the ratio of services to population for service location j, consider the subset of census tracts i ∈ I, where tract i is within travel-time radius d0 of service j. Compute the ratio Rbj of services to population within that radius:

where dij is the distance between population location i and service location j, less than catchment area radius d0. Assign this ratio the location of service j. Second, to capture the demand for population location i, let SAI ib be the sum of all ratios Rjb within radius d0 of each population location k:

Like the 2SFCA, the SAI is dimensionless and as such is best interpreted as a local estimator of potential spatial nonprofit service accessibility. It provides inference at the small-area level: identifying population locations (census tracts, in our case) where accessibility is good or poor. As a local measure, a tract’s SAI value is only dependent on the nearby catchment areas and clinics. Thus, unlike spatial regressive models that assume a global correlative structure, tract estimates are not directly affected by the presence of distant observations. Where global statistical measures often imply that each tract’s index values are affected by all other values in the model, SAI values are not affected by distal observations and can be directly compared among regions without standardization or correction. As a result, in our analysis, the inclusion of a wide geographic area with diverse social and physical geographies will not produce biased estimates or mask important local heterogeneity. In fact, including rural and urban areas in the same set of calculations allows us to make important inferences about communities in the urban periphery, “edge” places that may have access to city services that more remote communities lack.
For FQHCs, we use ACS 2018 five-year estimates of the foreign-born population without health insurance (U.S. Census Bureau 2018b); for legal aid nonprofits, we use ACS estimates of the noncitizen population (U.S. Census Bureau 2018a). For health clinics, services are likely to be directed toward immigrants without health insurance who lack the ability to pay for traditional medical services. For legal services, the noncitizen population is most likely to require immigration-related services. We use the foreign-born and noncitizen populations for substantive reasons and because of data limitations. Substantively, linguistic and cultural barriers to adequate health services can occur irrespective of legal status, while immigration legal services are especially relevant to noncitizens. Of course, such vulnerabilities are especially acute for undocumented residents. However, estimates of the undocumented population, alone, are not available at the level of granularity we need. Undocumented residents are included in the ACS, albeit likely undercounted (Jensen, Bhaskar, and Scopilliti 2015; Massey and Capoferro 2006). For one analysis of undocumented immigrants’ access to legal services, focused primarily on state-level variation, see Kerwin and Millet (2022).
Determining what counts as a reasonable catchment area of radius d0 is not self-evident. As Luo and Wang (2003) acknowledged, the line between an accessible and an inaccessible service is arbitrary; all services within the boundary, regardless of distance, are counted equally, and those outside are disregarded. 8 Luo and Wang’s (2003) method uses a baseline 30-minute travel time for both sets of operations, derived from a 1991 recommendation by the U.S. Department of Health and Human Services for identifying health professional shortage areas (Lee 1991). More recently, a study employing individual time-use data from the Bureau of Labor Statistics found that people traveled an average of 34 minutes to access health care services, with little difference between urban and rural residents (Rhyan 2019:3) Another study, from the state of Washington, concluded that when it comes to routine care, adults traveled on average 8.6 miles or 17.5 minutes, almost exclusively by car, but that they reported being willing to travel up to about 20 miles or 28 minutes for nonurgent care (Yen 2013:2). Koschinsky’s et al. (2022) use of the 2SFCA for access to health care services in Chicago also takes a 30 minute travel time, but they assume that this distance is covered by foot (represented as 1.5 miles). Perhaps because use of legal services is much less common for most people than use of health care service, existing literature offers few benchmarks for an appropriate legal services catchment area. One study of legal access for detained migrants used a 50-mile linear radius, which likely translates into more than an hour of drive time (Ryo and Humphrey 2023).
We chose to use travel time, also known as an isochrone, and set the radius as a 30-minute driving time from clinic locations (in the first step) and population locations (represented by the census tract’s population-weighted centroid in the second step). Our 30-minute drive time follows some prior studies and is reasonable, we believe, given U.S. residents’ self-reported travel and their preferences, but we also undertook a sensitivity analysis, performing our analysis at a threshold of 15 or 60 minutes, which we discuss more below. 9 The catchment areas are calculated using the Open Source Routing Machine using OpenStreetMap data (OpenStreetMap Contributors 2020; Vetter and Luxen n.d.). 10 Isochrones are subject to a number of sensitivities, including transportation mode (driving, walking, or transit) and time of day. For methodological ease, our analysis only considers driving time in the absence of traffic, which we note is likely an overestimate of mobility in urban areas. Although many immigrants seeking services rely on other modes of transit throughout the day, we still consider it an advance on prior measures. Other analyses of immigrant services either consider strict municipal boundaries, which do not allow residents to seek services in nearby towns, or map distance buffers (rather that street distance), which are often a misleading picture of local mobility.
What We Learn from Using the SAI
There is widespread spatial inequality in immigrants’ ability to access health and legal services across our three-state study area. Tables 5 and 6 contain median values of the SAI for the five largest cities and urban areas, respectively, in each region. Figures 4 to 11 and Supplementary Figures S1 to S8 provide visual representations and numeric summaries of the SAI within the mapped region, such that green areas have higher values of the SAI, red areas have lower values, and yellow/orange areas are in between. As the index is roughly a ratio of services to population, a high SAI value can be driven either by an abundance of services or by a relatively small target population. In both cases, a higher value of the index indicates that demand is relatively well met in a delimitated space compared with lower values.

San Francisco Bay area univariate service accessibility index (SAI) for health clinics (left) and legal clinics (right).

Central Valley univariate service accessibility index (SAI) for health clinics (left) and legal clinics (right).

Southern California univariate service accessibility index (SAI) for health clinics (top) and legal clinics (bottom).

Mountain California univariate service accessibility index (SAI) for health clinics (left) and legal clinics (right).
Arizona univariate service accessibility index (SAI) for health clinics (left) and legal clinics (right).

Nevada univariate service accessibility index (SAI) for health clinics (left) and legal clinics (right).
Suburban Complexity and the Relative Advantage of Midsize Cities
We find that where an immigrant lives is a substantial determinant of how many services are easily accessible to them, relative to the size of the local immigrant community. Intriguingly, this is not a simple story of big cities or historic gateways providing more services. On one hand, in all the regions we study, the SAI for both health and legal services is larger in metropolitan areas; rural residents are disadvantaged. But on the other hand, the largest cities do not necessarily offer higher access proportionate to the target population. In fact, midsize cities provide better access to health services than larger cities.
For example, in the San Francisco Bay area (Figure 4), the SAI for both types of services is considerably higher in Oakland (population 420,000) compared with the largest city in the region, San Jose (1 million). This is because although the supply of services provided in San Jose is similar to those in Oakland, the demand (on the basis of target population) is much greater in the former compared with the latter, showcasing the value of the SAI in considering supply and demand simultaneously. As a result, the median health services SAI in Oakland is nearly double that of San Jose (0.32 vs. 0.15) and triple for legal nonprofits (0.015 vs. 0.005). San Francisco, with a population double that of Oakland at 870,000, has nearly the same median legal SAI and slightly lower health SAI as Oakland.
This pattern is observed widely throughout the study area. In Arizona (Figure 8), the median tract in the Phoenix urban area (population 4 million) sees worse access to services than the Tucson urban area (870,000) by a factor of 3 for health clinics and an astounding 60 times for legal clinics. In Nevada (Figure 9), despite the fact that the Las Vegas urban area encompasses nearly five times the population of Reno–Carson City (2 million vs. 420,000), the median tract’s SAI is 6 to 7 times lower in Las Vegas, for both measures. Finally, in southern California (Figure 6), the highest median health SAI occurs in the Riverside–San Bernadino urban area (population 2 million), not in San Diego (3 million) or Los Angeles (12.5 million). In terms of legal services, San Diego has the highest median access to legal clinics of the three areas. In California’s Central Valley (Figure 5) the situation is more complex; the largest urban area, Sacramento (1.8 million), leads the region in median legal service access but falls short of the Fresno (700,000) and Bakersfield (550,000) urban areas in health access.
Our findings about the relative advantage of smaller over larger cities, especially in health care access for immigrants without health insurance, showcase an advantage of the SAI over many alternative metrics. The SAI goes beyond the presence or absence of services to consider the ratio of services to population. Thus, although larger cities may have multiple clinics and thus count fewer immigrants in the city limits without theoretical access to any nonprofit, larger cities with double the number of immigrants do not necessarily offer double the number of services. Another reason for the relative advantage of midsize cities might lie in their more limited urban sprawl. In a geographically larger city, clinics on opposite sides of town will fall in different catchment areas; in a smaller municipality, these clinics will likely be within the same travel buffer, producing a higher SAI. Practically, then, immigrants living in midsize cities may fall into overlapping catchment areas and thus have the advantage of more options than big-city residents competing with many others for scarce services. 11
As a sensitivity test, we conducted the analysis with two additional distance thresholds, 15 and 60 minutes, to gauge the responsiveness of the index to distance and elaborate how rural residents may experience accessibility differently than urban and suburban residents (Figures 10 and 11). Of the 50 million residents in the study area, almost 2 million were unable to access any health services within 30 minutes; when expanded to 60 minutes, 1.25 million of these residents were able to access health services. As well, almost 6 million were unable to access legal services in 30 minutes, a number that dropped to 2.4 million within 60 minutes. Most, if not all, of these gains occurred in rural areas or around small towns. The SAI did not uniformly increase as tracts are expanded; in fact, the average tract’s health SAI decreased by about 0.0004 between 30 and 60 minutes as the population seeking services at each clinic was expanded (the median tract increased by 0.008, indicating that although most tracts did see an increase in service access, some experienced considerable decreases). The medium-city optimum for health services remains at the 15-minute cutoff: Tucson is better than Phoenix, Reno–Carson City is better than Las Vegas, and San Bernardino and Santa Barbara are better than Los Angeles. At 60 minutes, the pattern remains but is less pronounced, especially throughout California. These results suggest that rural and small town residents do indeed need to drive further to access services in similar quantities to urban residents.

Health clinics: sensitivity analysis of travel-time buffers. From left to right, 15, 30, and 60 minutes.

Legal clinics: sensitivity analysis of travel-time buffers. From left to right, 15, 30, 60 minutes.
The situation for suburban immigrant communities is mixed: some suburbs are able to benefit from (or free-ride on) the nonprofit services in a proximate central city (de Graauw et al. 2013); other suburbs have developed their own infrastructure; and still others are geographically distant, on the basis of travel times, from services. Thus, residents of suburbs or bedroom communities adjacent to the cities of San Francisco and Oakland benefit from relatively good access to legal and health services, but those living in the many small and large suburbs of the South Bay and Peninsula regions—places with high percentages of foreign-born residents far from city centers—confront comparatively poor access. The San Francisco Bay region, as well as the greater Los Angeles region, are thus characterized by polycentric or multifocal service accessibility: areas of good and poor service access are sprinkled throughout the two regions in a Swiss-cheese pattern. At a 15-minute drive time, the Swiss cheese pattern of service accessibility is even more pronounced.
Spatial Access Differences by Type of Services
Legal services seem to be present mostly in medium to large population centers and especially scarce in rural areas. In both California and Nevada, index values for legal clinics are highest in and around the state capitals of Sacramento and Carson City. State capitals are the main legislative and judicial centers for each state, and thus it follows that legal assistance centers for criminal and civil cases would be there, as well as advocacy groups working on immigrant legal concerns. Arizona’s capital, Phoenix, sees moderately lower values of the legal services SAI than Tucson, an effect that may be mediated (as described above) by the capital city’s large size and anti-immigrant politics. Proximity to the border (and potential demand for help by asylum seekers and others) could also be at play, given the relatively higher SAI scores in the Tucson and San Diego areas.
In comparison, immigrants living in rural areas experience very poor access to justice. This is the case for agricultural towns in the Central Valley as well as those living in Northern California. In Arizona, access to immigrant legal services is almost nonexistent outside of Phoenix or Tucson; the same is true for the few small towns in Nevada outside of Las Vegas or Reno. The paucity of legal nonprofits in the rural Southwest is consistent with previous work by (Albiston et al. 2017), who find that public interest law organizations are mostly concentrated in large cities, and especially in wealthier areas. Such trends are likely exacerbated for noncitizens. As we noted earlier, some funding for access to justice, for example, offered through the federal Legal Services Corporation, is barred by law from funding immigrant legal services (Legal Services Corporation 2020).
In contrast, health services—specifically, the FQHCs in our data set—are more numerous and penetrate more frequently into rural areas than legal services. In Arizona, smaller cities such as Flagstaff and Prescott have good access to health services, again suggesting a possible small-city optimum. In California, access to health services appears to be moderate in the largest cities of the Central Valley—Sacramento, Fresno, and Bakersfield—but we see comparatively better access in the more rural areas between these cities. As the HRSA’s mission specifically includes bringing health care to underserved geographic areas, this is cautious evidence of some mission success. The dynamic of rural access is especially apparent in Arizona, where many rural areas have high SAI values. Compared with legal services, FQHC funding can include immigrants in funding formulae. Further, FQHCs are not set up to serve only immigrants; their services target the broader rural, poor population. In rural Arizona, this likely includes Native American communities. 12
Conclusion
This study advances several frontiers in the growing literature on immigrants’ access to nonprofit health and legal services. Immigrants are a uniquely vulnerable group who face precarious legal status, linguistic barriers, financial strains, and cultural or religious discrimination that may make traditional for-profit or government services practically inaccessible. In such instances, U.S. civil society has long stepped in to offer assistance through charities, nonprofits and mutual assistance organizations. The move to third-sector service provision has ballooned as governments contract out health, human and social services to nonprofits and community-based organizations. Our study is one of few to consider accessibility of such services to immigrants specifically.
We also contribute to the measurement of service access more generally and the broader literature on the delegated welfare state. Prior research has usually considered lack of access (identifying where no services are present, or an absence of supply of organizations) or assessed the population need for services (the “demand,” as with deprivation measures). We advance work that seeks to measure, simultaneously, supply and demand, by bringing together a more robust evaluation of the supply of services for immigrants (i.e., core services and service-hours) and evaluation of the sociodemographic vulnerability of the immigrant population (e.g., demand due to noncitizenship, lack of health insurance) in a single analytical approach. Furthermore, by spanning three states and calculating service accessibility at the census tract level, we are able to consider how patterns of accessibility play out over a region diverse in its political and cultural climates, urban and suburban residential structures, and immigrant community compositions. Methodologically, we judge accessibility by driving time instead of map distance to better reflect the lived experience of people seeking services.
Our SAI reveals a number of intriguing patterns ripe for further research. Because the SAI is used at such a granular level—census tracts, as opposed to municipalities or counties—we can zoom into the micro level (what does the SAI mean for an immigrant who lives right here?) and telescope out to the macro level (why are these two regions so different?). We find that rural areas are underserved, but much more so when it comes to legal services than health services, possibly in part because of distinct government funding structures. Conversely, midsize cities tend to have better service accessibility for immigrants than large, populous cities. When it comes to suburbs—the places that are seeing the most rapid diversification of their residential population, in terms of both demography and socioeconomic diversity—the picture is complex. We find substantial inequality between municipalities or even neighborhoods within the same urbanized area. Some metropolitan areas exhibit radial patterns in their SAI, such that suburbs further from the urban core provide little to no nonprofit support to immigrant residents, whereas other metropolitan regions are characterized by polycentric or multifocal service accessibility, with pockets of good and poor service access sprinkled throughout.
We believe that our proposed SAI is a strong first step to better mapping and understanding spatial and sociodemographic vulnerabilities in health, human and social services. Still, there are a number of areas for improvement. Our measure, like other attempts to simultaneously calculate supply and demand, estimates the availability of services, not actual take-up. Furthermore, our use of service-hours as a proxy for capacity is imperfect, and we encourage future study of how to capture capacity (and ultimately use) through other means. We evaluate breadth of service in our measure. But a service provider could be highly specialized, offering only a single type of service, yet have many clinicians able to see many clients, thus providing depth rather than breadth of service. Data constraints made it impossible to consider capacity measures such as staffing or organizational budgets at scale, but new text scraping and machine learning methods might allow this in the future (Ren and Bloemraad 2022). Text scraping and natural language processing could also be critical to applying our assessment of core services and opening hours to scale, beyond the Southwest, given the hundreds of hours of human coding required to collect these data. This would allow an assessment of the SAI in other U.S. regions, including in the South, where legal services for immigrants might be particularly poor (Albiston et al. 2017; Yasenov et al. 2020). In the particular case of immigrants, language is also an important barrier, but because of our inability to model immigrants’ language use at the census tract level, our SAI assumes that all clinics providing services are relevant for all immigrants in the target population. A clinic offering services in Spanish might not, however, be viewed as accessible to a population that speaks primarily Chinese. Future work should include language-specific analysis.
We also need more work on geographies of service access. Foundational work in this field has taken 30 minutes as a reasonable amount of travel time for a person seeking services, a catchment metric that we also use. However, we show that many rural immigrants may have to drive upward of an hour to reach services. In urban centers, 30-minute driving buffers calculated in the absence of traffic likely overestimate the geographic bounds for services when considering road congestion or public transportation. Future innovation could involve regionally adaptive methods of measuring catchment areas that do not assume a constant travel norm across the study area.
To better understand real behavior, whether in travel time, actual service use, or the experience of access (e.g., quality, inclusivity) we will need new sources of data, and mixed method research. One future path could draw on cell phone mobility data for generating regionally appropriate buffers to estimate, empirically, catchment areas from real travel patterns. We also need more ethnographic fieldwork to better understand when, where, and how vulnerable populations access services: for example, how do immigrants learn about services, how far and long will they travel, and how useful and welcoming are those services once they arrive at an organization? Multisite fieldwork could leverage the SAI measures we produce to identify variation in service context. Such work could help push the index from an imperfect measure of “potential” accessibility to a measure of “revealed” accessibility, using actual service take-up. Fieldwork would also help probe the impact of metropolitan patterns of accessibility, such as polycentric San Francisco (where services are located in pockets throughout the metropolitan region) compared with radial Phoenix (where most services are downtown).
To this end, the nature of the SAI invites further study by urban sociologists: does the structure of the city itself create inequality? Sprawling, radial cities such as Phoenix may be able to provide enough services if the population are all located in proximity, but the spread-out structure may deflate access. Additionally, the SAI assumes that as the population doubles, an area will need double the number of clinics. In reality, there may be a nonlinear or diminishing marginal relationship sufficient to satisfy demand. Although Phoenix has roughly five times the population of Tucson, it might not need five times the number of clinics to adequately serve its residents. This possibility is difficult to ascertain without detailed service use data and more information on clinic staffing and financial resources, information that is hard to come by at scale, again pointing to the need for future research drawing on diverse types of data. We also hope that rural sociologists can use our measure in other areas of the United States (or other countries) given the particularly large and sparsely populated nature of rural life in some parts of the Southwest, a geography that could be different elsewhere.
Other future directions are to use the SAI as an outcome measure to be explained, or an explanatory variable that might help account for variation in outcomes of interest to migration and stratification researchers. The SAI shows striking differences between Phoenix and Tucson. Are politics and history at play? We note, for example, the long history of anti-immigrant political activism in Phoenix (e.g., the actions of former Sheriff Joe Arpaio), which differ from Tucson’s history as a center for the 1980s sanctuary movement, protecting and speaking out for Central American asylum seekers. These historical legacies and political dynamics might help explain the much better service access in Tucson compared with Phoenix, beyond population size and the two cities’ relative geographic scales. At the same time, San Diego shows a surprisingly robust legal services SAI; perhaps a legacy of refugee resettlement or proximity to the border helps explain SAI variation. In terms of consequences, is it the case that places with low health service SAIs exhibit poorer health outcomes among immigrants? Within a metropolitan region, are immigrant residents living in suburbs with higher SAIs doing better, or will people travel an hour or more to access services? As noted in a recent review by Bloemraad, Chaudhary, and Gleeson (2022), migration scholars have been slow to explore how intermediary institutions such as nonprofit organizations affect immigrant integration.
There are also practical applications and possibilities in the SAI. By identifying the spatial locations of places with better and worse meshing of nonprofits and sociodemographic vulnerability, governmental policy makers, community stakeholders, and philanthropic organizations can better prioritize the creation of new organizations in the spatial locations of highest need (see also Yasenov et al. 2020). In elucidating inequality at the neighborhood level, we encourage the geographically informed development of services and targeted prioritization of underserved communities, that is, attention to both spatial and sociodemographic vulnerabilities. Our SAI, by considering supply and demand in conversation, provides a rich new tool for researchers, service organizations, and immigrants seeking services to evaluate the local and regional nonprofit infrastructure.
Supplemental Material
sj-pdf-1-srd-10.1177_23780231231157683 – Supplemental material for Spatial and Sociodemographic Vulnerability: Quantifying Accessibility to Health Care and Legal Services for Immigrants in California, Arizona, and Nevada
Supplemental material, sj-pdf-1-srd-10.1177_23780231231157683 for Spatial and Sociodemographic Vulnerability: Quantifying Accessibility to Health Care and Legal Services for Immigrants in California, Arizona, and Nevada by Ethan Roubenoff, Jasmijn Slootjes and Irene Bloemraad in Socius
Footnotes
Acknowledgements
We thank Stephanie Peng for her input and feedback and all of our organizational coders.
Funding
The author(s) disclosed receipt of the following financial support for the research, authorship, and/or publication of this article: Data collection for this research was supported in part by the National Science Foundation (grant 2017044) and a pilot grant from the Berkeley Population Center (Eunice Kennedy Shriver National Institute of Child Health and Human Development grant P2CHD073964).
Replication Code and Data Availability
Replication code is available on GitHub (Roubenoff, Slootjes, and Bloemraad 2022). We have also deposited our data in the Harvard Dataverse (Roubenoff, Slootjes, and Bloemraad 2022). The core files are access restricted, and those wishing to replicate our analysis can request access on Dataverse.
Supplemental Material
Supplemental material for this article is available online.
1
2
3
At the same time, undocumented immigrants are very vulnerable within the health care system and often excluded from services using governmental funding (Derose et al. 2007; Joseph and Marrow 2017; Marrow and Joseph 2015; ![]() ).
).
4
FQHCs are not alone in providing free or reduced care to poor or uninsured patients. Most hospitals have programs for such patients, especially to cover emergency care. FQHCs are also not the only nonprofit health care organizations; various large health care organizations can be incorporated as 501(c)(3) nonprofits. We focus on FQHCs because they are particularly focused on providing primary and preventive care to vulnerable populations, they may represent a “best case” scenario for immigrants’ access to services, and available data are easier to compare and systematize.
5
The majority of lawyers who are members of the American Immigration Lawyers Association work in for-profit solo practice or small law firms, but the proportion working in nonprofits has grown significantly from 2004 (4 percent of all American Immigration Lawyers Association members) to 2019 (11 percent) (Ryo and Humphrey 2023). Given that the use of a private immigration attorney can run into the thousands of dollars, we follow other researchers’ focus on nonprofit legal assistance as a useful way to examine access to justice among the most vulnerable immigrants (e.g., Kerwin and Millet 2022; ![]() ).
).
6
For example, ![]() important recent analysis of access to legal services for undocumented immigrants is innovative in considering the entire country and using estimates of a largely hidden population, undocumented residents. The bulk of their analysis is, however, at the state level. An estimate of lawyers per population in Georgia, for instance, provides limited information on the local experience of any particular undocumented person in the state.
important recent analysis of access to legal services for undocumented immigrants is innovative in considering the entire country and using estimates of a largely hidden population, undocumented residents. The bulk of their analysis is, however, at the state level. An estimate of lawyers per population in Georgia, for instance, provides limited information on the local experience of any particular undocumented person in the state.
7
The publicly available data we accessed—nonprofit lists and Web site information—rarely reported the number of staff members or clients served; when some information was available, numbers were not necessarily comparable across organizations.
8
Luo and Wang used this as motivation for the development a gravity-type model in their 2003 article in addition to the 2SFCA method, which would avoid a hard distance cutoff. In a 2005 applied analysis, however, they remarked that the 2SFCA method is superior to the alternative gravity model because (1) it is simpler to implement, (2) it is more intuitive to interpret the 2SFCA as a supply-demand framework, and, most important, (3) the gravity model may underidentify the most underserved areas of study (Wang and Luo 2005). To help with some of the shortcomings of both models, ![]() proposed an “enhanced” 2SFCA method, which estimates the same supply-demand framework for a series of increasingly large travel times (i.e., 0–10, 10–20, and 20–30 minutes), summed with diminishing weight placed on the farther distances. However, the distance-decay function for weights is chosen arbitrary or must be developed for each application. In this period of rapid development of the field, we choose to use the original 2SFCA method, but encourage future sensitivity analysis between the three models.
proposed an “enhanced” 2SFCA method, which estimates the same supply-demand framework for a series of increasingly large travel times (i.e., 0–10, 10–20, and 20–30 minutes), summed with diminishing weight placed on the farther distances. However, the distance-decay function for weights is chosen arbitrary or must be developed for each application. In this period of rapid development of the field, we choose to use the original 2SFCA method, but encourage future sensitivity analysis between the three models.
9
We recognize, however, that what counts as “normal” travel might well vary between urban and rural areas, the type of services under consideration, and even the time of day for congested metropolitan regions. Existing literature also shows the variability in assessing a reasonable distance or travel time to services. One meta-analysis of studies examining whether distance from care negatively affects individual health outcomes found that although 77 percent of studies did find such a correlation, “the methods used to calculate travel times and distances were not consistent across studies” (![]() :1). Residents in rural areas, who may be used to long driving times for routine activities, may be willing to travel further than suburban or urban residents. Conversely, urban residents may rely more heavily on public transit, which can severely limit the space accessible within any defined time threshold. We hope that future research refines our index with such considerations in mind.
:1). Residents in rural areas, who may be used to long driving times for routine activities, may be willing to travel further than suburban or urban residents. Conversely, urban residents may rely more heavily on public transit, which can severely limit the space accessible within any defined time threshold. We hope that future research refines our index with such considerations in mind.
10
Map data copyrighted by OpenStreetMap Contributors and available from https://www.openstreetmap.org and downloaded from ![]() .
.
11
The relative availability of public transportation, something beyond our study data, could further aggravate (or potentially mitigate) such spatial inequities.
12
The interpretation of findings for rural areas should be done with caution. In rural areas, where census tracts are large and target immigrant populations are small, and SAI values can be quite unstable; small changes in the number of services can have large impacts on the values of the index. In Nevada and Arizona, where most of the land area is sparsely populated, many areas have both an immigrant population of near zero and service access of zero. Furthermore, as discussed above, although a 30-minute driving time may be a sufficient distance for metropolitan regions, rural residents may be more accustomed to longer travel times for services and resources, from groceries to legal aid, and even as this reality does shine a light on spatial inequities facing rural residents.
Author Biographies
References
Supplementary Material
Please find the following supplemental material available below.
For Open Access articles published under a Creative Commons License, all supplemental material carries the same license as the article it is associated with.
For non-Open Access articles published, all supplemental material carries a non-exclusive license, and permission requests for re-use of supplemental material or any part of supplemental material shall be sent directly to the copyright owner as specified in the copyright notice associated with the article.