
Abstract
Sociological research has investigated neighborhood inequality across various consequential events. Crime and violence continue to be dominant phenomena examined. Less sociological attention has been given to other types of adverse incidents involving emergency services responses. In this article, the author draws on a unique data set on medical emergencies, fires, traffic collisions, gas leaks, carbon monoxide leaks, and hazardous incidents from more than 600 local first-responder agencies across the United States to examine neighborhood inequalities in prevalence. The author finds that across nearly all outcomes, neighborhood proportion Black is a dominant predictor of incidence that persists net of a battery of controls. The author additionally finds socioeconomic disparities across a few of these outcomes, including medical emergencies, fires, and traffic collisions. The author concludes by broadly encouraging more sociological research on these understudied events.
Keywords
The study of neighborhoods has long served as a key area of study in sociology. In their seminal work, Shaw and McKay (1942) showed the correlation between neighborhood economic disadvantage and juvenile crime. This work led the way for a substantial body of literature that further developed an understanding of the modern relationship between neighborhoods and violence (Massey 1990). Violence is frequently implicated as both a mechanism through which neighborhoods affect adolescents and an adverse consequence of neighborhood disadvantage (Heissel et al. 2018; Sampson, Raudenbush, and Earls 1997; Sharkey 2010; Sharkey and Torrats-Espinosa 2017).
Adolescent outcomes, like adult income and the likelihood of incarceration, vary substantially among neighborhoods. Neighborhood effects can, in turn, explain a substantial share of the effect of race on these adolescent outcomes (Chetty et al. 2014). Indeed, experimental evidence confirms the relevance of neighborhoods in adolescent outcomes (Chetty, Hendren, and Katz 2016). Recent research has also studied and measured the acute effects of severe events on adolescents, such as police operations, violence, homicides, and police shootings (Ang 2021; Browning, Tarrence, et al. 2021; Heissel et al. 2018; Legewie and Fagan 2019; Sharkey 2010). Such events have been shown to substantially affect adolescents’ academic performance, health, and mental well-being.
Similarly, research has implicated environmental racism as a central inequality plaguing poor Black neighborhoods. Across several adverse environmental conditions, poor Black neighborhoods have been found to have higher levels of hazardous waste, air pollution, water pollution, and lead contamination (Bullard et al. 2008; Evans and Kantrowitz 2002; Mikati et al. 2018; Wodtke, Ramaj, and Schachner 2022). These inequalities are crucial as they can help explain substantial neighborhood effects in many cases. For example, recent work has found that lead contamination can essentially explain the entire relationship between neighborhood disadvantage and young children’s vocabulary skills (Wodtke et al. 2022).
Nascent work on environmental racism has encouraged sociologists to consider a broader range of mechanisms involved in neighborhood effects (Wodtke et al. 2022). Such novel work may be especially appropriate given the relative rarity of other traditionally studied adverse urban outcomes, such as homicide. Traffic deaths greatly exceed homicides in the United States, for example (Webb 2018). Similarly, there are far more house fires in the United States than violent crimes. Although violence is undoubtedly severe and has highly adverse effects, many other categories of detrimental events deserve more research than they have received. As a result of their increased occurrence, such events may offer a stronger signal of neighborhood disorder and suffering. Fires and traffic collisions do, in fact, share some of the same acute effects as violence. They can cause serious bodily harm or even death and leave victims or bystanders with lasting trauma (Breslau et al. 2004; Hoffmann 2002). Spatially, fires can even leave neighborhoods with blight that hurts their residential appeal (Loomis 2004; Sun et al. 2019).
In this article, I draw on a novel and detailed data set on emergencies from more than 600 fire departments and emergency medical service (EMS) response agencies across the United States. Emergency events are categorized and geocoded to a specific location as part of the agency dispatches. I examine six specific types of incidents: medical emergencies, fires, traffic collisions, gas leaks, carbon monoxide leaks, and hazardous incidents. I focus on these six types of incidents as they are the most common ones in the data set and thus are of utmost importance for understanding strain on emergency response services and other public resources. Additionally, these six incident types are highly relevant to understanding neighborhood inequalities in health and social disorder.
Net of agency fixed effects, I find that neighborhood proportion Black is a significant predictor of all six adverse outcomes. For some outcomes, such as carbon monoxide leaks, an all-Black neighborhood is predicted to have nearly twice the incidence compared with an all-White neighborhood. A battery of controls fails to substantially attenuate these relationships, which stands in distinction with research on other adverse neighborhood outcomes, such as homicide (Levy, Phillips, and Sampson 2020). I organize the remainder of the article as follows. The subsequent section outlines neighborhood disadvantage and the potential mechanisms which may result in variation in the incidence of the six examined adverse outcomes. I then provide a succinct overview of past research on all six outcomes before diving into the data, methods, and results.
Race, Neighborhood Disadvantage, and Mobility Patterns
Because of stark residential segregation, neighborhoods constitute a vital lens through which to study racial inequality. As neighborhood of residence is closely associated with race, varying neighborhood conditions can often explain a considerable share of racial inequality across various outcomes. Neighborhood economic disadvantage, in particular, often explains racial inequality in neighborhood outcomes. For example, Americans’ risk for being fatally shot by the police varies tremendously by race, with Blacks having roughly three times the lifetime risk of Whites (Edwards, Lee, and Esposito 2019). Subsequently, there exist similarly large inequities in incidence by neighborhood racial composition (Vachuska and Levy 2022). However, measures of neighborhood disadvantage can explain nearly the entire relationship, implying that although stark racial disparities do exist, much of these inequalities result from a distinct mediating mechanism rather than directly being a product of race itself.
There are a number of mechanisms of neighborhood disadvantage that result in adverse outcomes (Galster 2012). Regarding the outcomes analyzed here (medical emergencies, fires, traffic collisions, gas leaks, carbon monoxide leaks, and hazardous incidents), I outline two of the most relevant mechanisms: financial investment and collective efficacy.
Neighborhood economic disadvantage tends to result in lower economic investment. The mechanisms behind this are fairly straightforward, as the residents of disadvantaged neighborhoods have reduced financial resources, investment in the neighborhood may be unappealing to outsiders, and residents may lack the social cohesion and ties that help generate investment (Anderson 2013). A consequential outcome of this lack of investment is lower infrastructure quality (Galster 2012). Quality of infrastructure can bear directly on all outcomes analyzed, but in particular: fires, gas leaks, carbon monoxide leaks, and hazardous incidents. In the case of fires, not only are vacant properties at much greater risk for fire, but so are still occupied but deteriorated structures with mechanical defects (Keall et al. 2010; Wallace and Wallace 1998). In terms of gas leaks, Weller et al. (2022) argue that disparities in infrastructure quality is a key cause of inequality in neighborhood incidence. Similarly, substandard housing has been argued to increase the likelihood of carbon monoxide exposure (Landrine and Corral 2009). Hazardous incidents constitute a wider variety of potential events but may, in many cases, result from infrastructure failure (Neisser and Müller-Mahn 2018).
Collective efficacy is a second mechanism through which neighborhood disadvantage may increase the incidence of the aforementioned adverse events. Collective efficacy theory posits that neighborhood disadvantage leads to adverse outcomes, like crime, through a breakdown of social norms and practices (Sampson 2021). Residential stability and homeownership are said to play a substantial role in this relationship by promoting strong ties among neighborhood residents, thereby better enabling and encouraging informal social control (Sampson et al. 1997). Additionally, disadvantaged neighborhoods tend to be isolated from key institutions that may support social control. Last, socioeconomic status can affect one’s sense of control, concentrating individuals with lower degrees of perceived control in disadvantaged neighborhoods. In culmination, neighborhood disadvantage is a strong predictor of collective efficacy, which is, in turn, a strong predictor of neighborhood crime and violence (Sampson et al. 1997).
Crime itself may constitute a clear mechanism affecting the incidence of three examined outcomes: medical emergencies, fires, and traffic collisions. Violence can affect health in both acute and chronic ways, and quality of health is the main predictor of the need and usage of EMSs (Agarwal, Lee, et al. 2019; Diez Roux and Mair 2010). In the case of fires, arson is a serious crime whose incidence has been linked to collective efficacy (Pabayo et al. 2020). Arson, of course, can strongly affect the incidence of fires. Similarly, reckless or careless driving can greatly affect the incidence of traffic collisions. Risky driving practices are strongly linked to community violence exposure (Brady 2006).
Mechanisms aside, recent research has improved upon traditional methods for conceptualizing and measuring neighborhood disadvantage. Although disadvantage metrics have historically been based in residential measures, mobility-based measures have been argued to more closely match conceptual understandings of what neighborhoods are and why they should matter (Browning, Calder, et al. 2021). Compared with traditional residential measures, mobility-based measures of disadvantage have been demonstrated to be better predictors of numerous theoretically relevant phenomena. These analyzed phenomena include a wide range of outcomes, such as homicide, police violence, coronavirus disease 2019 incidence, and adverse birth outcomes (Levy et al. 2020, 2022; Vachuska and Levy 2022). Although the exact mechanisms remain unclear, theory suggests that mobility-disadvantaged neighborhoods suffer from the same mechanisms residentially disadvantaged neighborhoods do, like lower degrees of collective efficacy and less investment, but to a greater degree. Mobility-disadvantaged neighborhoods may suffer from these mechanisms to a worse extent than residentially disadvantaged neighborhoods because of worsened social cohesion and a lack of ties to affluent neighborhoods that may promote investment (Levy et al. 2020; Light and Thomas 2019). In line with recent research using mobility-based measures of neighborhood disadvantage, I include such a measure in my analyses here.
Next, I give succinct overviews of the literature pertaining to the six aforementioned outcomes. These sections also serve to emphasize the different stratification contexts each outcome fits into. Because of the varied nature of the outcomes analyzed, different outcomes have strikingly different causes and consequences for neighborhoods.
Medical Emergencies
The frequency of medical emergencies is a strong indicator of the health of individuals or neighborhoods (Agarwal, Angeles, et al. 2019). Although some research suggests that witnessing medical emergencies can induce trauma (Hoffmann 2002), the strong correlation between quality of health and medical emergency incidents suggests that it may be more imperative to primarily focus on conceptualizing medical emergencies as a consequence of neighborhood inequality rather than a cause. In that vein, research has documented neighborhood socioeconomic status as an important predictor of EMS responses (Listo et al. 2021). One of the largest studies on ambulance calls was done in Denver, Colorado, and showed proportion Black and in poverty to be strong predictors of a census tract’s incidence of trauma and medical EMS calls (Vogel et al. 2022). Although the authors did not provide information on the frequency of false alarms in EMS data, they did state that only 5 percent of EMS calls resulted in a trip to the hospital.
Fires
Fires, somewhat distinctly, can be considered a cause and consequence of neighborhood inequality. Vacant properties or properties with mechanical defects are at a hugely greater risk for experiencing a fire compared with occupied properties with no mechanical defects (Keall et al. 2010; Schachterle et al. 2012; Wallace and Wallace 1998). Thus the incidence of fires may be a sign that properties in the neighborhood are not well maintained and the neighborhood lacks needed investment. The incidence of arson similarly may signify that a neighborhood suffers from lower collective efficacy and greater violence (Pabayo et al. 2020).
Alternatively, fires may also contribute to the further degradation of a neighborhood. Fires, especially residential ones, are extremely dangerous and kill thousands in the United States yearly, injuring an even larger number (Yau and Marshall 2014). Additionally, fires damage property and directly contribute to neighborhood blight, which may hurt the residential appeal of a neighborhood (Loomis 2004; Sun et al. 2019). Blighted neighborhoods often struggle to gain investment, which may further disadvantage them (Sun et al. 2019). In addition, fires, at least temporarily, affect air quality, an inequality already plaguing poor Black Americans (Mikati et al. 2018; Singh et al. 2015).
Traffic Collisions
Traffic collisions may both result from and contribute to neighborhood inequality. In the United States, more deaths result from traffic collisions than homicides (Webb 2018). Even when traffic collisions do not result in deaths, they may cause severe bodily harm and mental trauma (Berna et al. 2012; Sterner et al. 2013). Sensibly, residing in a neighborhood with more traffic collisions increases the likelihood of one being a victim of a traffic collision. Causally, some research suggests that increased traffic collisions may result from a breakdown of collective efficacy and increased community violence (Brady 2006).
Past research has documented various substantial racial inequalities in traffic collisions. For example, Blacks have been found to suffer light-duty vehicle fatalities at nearly twice the rate of Whites (Raifman and Choma 2022). In the case of other types of traffic fatalities, such as an individual being struck by a vehicle while biking or walking, Blacks suffer even greater disparities (4.5 and 2.2 times, respectively). Although this research does not directly consider neighborhood attributes, it indicates large racial disparities in traffic fatalities and begs the question of the mechanisms involved.
Less research has engaged with the relationship between neighborhood demographics and traffic collisions. Some research has found that pedestrian-vehicle collisions are more likely to occur in Black neighborhoods (Delmelle, Thill, and Ha 2012). Broader research about traffic collisions does inform important controls to include in modeling traffic collisions. Traffic collisions are strongly predicted by volume of traffic, population density, land area, and commercial land use (Wier et al. 2009). These four variables, in turn, may be correlated with racial composition, given the tendency for Black and Hispanic neighborhoods to be situated in dense urban areas, and thus necessitate inclusion in the modeling of neighborhood incidence of traffic collisions.
Gas Leaks
A small body of research has investigated inequalities in various types of gas leaks. Weller et al. (2022) examined 13 U.S. metropolitan areas, finding that income and proportion non-White were strong predictors of natural gas leaks. Notably, these patterns were consistent across most metropolitan areas. The authors subsequently argued that neighborhood inequality in gas leaks has four major implications. First, natural gas leaks can severely affect safety if they result in an explosion. Although rare, natural gas explosions can easily kill or cause severe bodily harm to those in the immediate vicinity. Second, Weller et al. identified another effect of natural gas leaks as health or nuisance odor impacts resulting from the subsequent buildup of methane. Third, the authors discuss how natural gas leaks can result in large local economic burdens, including customers being charged for lost gas. Last, the authors argued that natural gas leaks can kill local vegetation, causing environmental damage to the area and potentially hurting the neighborhood’s aesthetics, which may result in decreased property values.
Unlike Weller et al. (2022), this work notably includes other types of gas leaks, such as propane leaks. Nonetheless, I expect this recent work to strongly inform the results here. Additionally, I base my conceptualization of the importance of gas leaks on that of Weller et al., asserting that they constitute an adverse event that may have hugely detrimental consequences for neighborhoods.
Carbon Monoxide Leaks
Little research has explored the geographical distribution of carbon monoxide leaks. Independent of distribution, it is important to recognize that the consequences of carbon monoxide exposure are inherently racially unequal. When exposed to carbon monoxide, individuals with sickle-cell anemia, which disproportionality affects Black Americans, are at greater risk for carbon monoxide poisoning (Barn et al. 2018). Indeed, past research has shown that Black Americans suffer from carbon monoxide poisoning at greater rates than non-Hispanic White Americans (Hampson 2019; Ralston and Hampson 2000). Public education on carbon monoxide has been argued to be an effective means of mitigating both leaks and poisonings, which suggests that inequalities in public education on the topic may be a factor in disparities in incidence. Additional research suggests that substandard housing, often found in poor Black neighborhoods, may increase the risk for carbon monoxide exposure (Landrine and Corral 2009). Ultimately, although carbon monoxide leaks may signify low quality of infrastructure, they also have harsh consequences, resulting in approximately 50,000 emergency room visits and more than 1,000 deaths each year in the United States (Hampson 2016; Hampson and Weaver 2007).
Hazardous Incidents
Hazardous incidents, as defined here, constitute an event that may be most difficult to match up with a past body of literature. This is mainly a result of hazardous incidents having a broader operationalization here than in past research. As operationalized here, hazardous incidents can refer to hazardous waste leaks and spills, partially collapsed buildings, or even a “snake in a house.” Broadly, hazardous incidents can be thought of as incidents that constitute either a safety or health hazard. Although it is a broad category, understanding neighborhood variation in hazardous incidents may be insightful in understanding neighborhood health disparities. Hazardous waste spills are the closest aligning event that has been studied in detail. Indeed, past research suggests that neighborhoods with lower socioeconomic status and more non-White residents are more likely to host hazardous waste sites (Mascarenhas, Grattet, and Mege 2021), which would logically predispose these neighborhoods to also being the site of more hazardous waste spills. Although less research has been done on spills specifically, race appears to be a dominant predictor of hazardous waste siting over poverty, suggesting disadvantage may not explain any found relationships between race and hazardous waste spills (Mascarenhas et al. 2021).
Hazardous waste sites tend to be located in poor, non-White neighborhoods. Research suggests that siting of hazardous waste is preceded by being poor and non-White, rather than the neighborhoods experiencing demographic transition post-siting (Pastor, Sadd, and Hipp 2001). Hazardous waste spills thus may indicate that a neighborhood is already disadvantaged by the presence of hazardous waste and that infrastructure in the neighborhood may be of lower quality (Neisser and Müller-Mahn 2018).
Hazardous waste spills can have severe consequences on both health and the environment. Hazardous waste can adversely affect births in a number of ways, including increasing the risk for congenital malformations and low birth weight (Johnson 1999). In adults, hazardous waste exposure has been linked to increased fatigue, sleepiness, and headaches (Vrijheid 2000). The environmental impacts of hazardous waste can vary hugely by type; food waste can create smog, e-waste can pollute groundwater, and plastic-based waste can result in land, water, and atmosphere pollution (Zhang et al. 2022). Generally, market actors recognize the disamenity of hazardous waste sites, and research suggests they lower property values (Ihlanfeldt and Taylor 2004). It is logical to postulate that hazardous waste spills may make hazardous waste sites’ presence more salient, potentially amplifying effects on residential desirability.
Data
Data for this project come from PulsePoint, a Web site and app that makes computer-aided dispatch from fire departments and EMS organizations publicly available. Agencies voluntarily elect to use the service and are not required to do so. Approximately 634 agencies used PulsePoint during the time of this analysis. Agencies typically align with city or county boundaries. Although it is difficult to ascertain what may be different between agencies that elect to use PulsePoint and those that do not (as those that do not are unobserved), the agencies that elect to use the service are regionally diverse. Figure 1 depicts the distribution of the number of agencies by state. As the figure shows, most of the United States (41 states) is represented by at least one agency in the data set.

Distribution of agencies by state.
Data on all dispatches from all agencies were collected for three months in summer 2021. All dispatches specify the exact location, dispatch date and time, and emergency type (following a universal incident typology). All dispatches were mapped to a census block group using shapefiles.
Emergency types were coded as follows. Medical emergencies I operationalize as incidents classified as a “medical emergency.” Fires are operationalized as any type of fire, with the exception of “controlled burn/prescribed fire.” Traffic collisions are operationalized as any of four types of traffic collisions in the PulsePoint incident typology. Carbon monoxide leaks are operationalized as a single type incident in the PulsePoint system referring to carbon monoxide leaks. Gas leaks, similarly, are operationalized as a single type of incident in the PulsePoint system referring to gas leaks. Last, hazardous incidents are operationalized as encompassing “hazardous condition” incidents, “hazmat response” incidents, and “hazmat investigation” incidents.
It is essential to acknowledge that a central limitation of these data is that all dispatches, including false alarms, are included in the data set. Among fires in particular, false alarms have been documented to make up more than 2 million yearly calls in the United States Karter (2013). The frequency of false alarms is not well documented for other incident types. For some incidents, such as traffic collisions, false alarms seem improbable.
The set of associated census block groups for each agency is identified using the agency’s listed boundaries in the PulsePoint application programming interface. A census block group is assigned to an agency if its population centroid falls within the listed boundaries. Agencies’ boundaries sometimes overlap with one another because county agencies form from conglomerates of smaller municipalities and unincorporated areas. County agencies list themselves as covering entire counties but do not typically respond to incidents in larger municipalities where separate agencies exist. To address this boundary accuracy issue, I exclude census block groups as observations if their associated agency did not get at least one dispatch (of any type) to that census block group at any point in the study interval. After removing those, a small number of duplicate census block groups exist that belong to different agencies. In these cases, I assigned the census block group to whatever agency was dispatched to it more times in the study interval. The duplicates that received fewer calls are dropped. At this point, 32 remaining duplicate census block groups are dropped entirely as observations.
Approximately one in four census block groups in the United States are involved in the final data set. Table 1 analyzes the regional and racial representativeness of the census block groups in the final data set relative to all census block groups in the United States. Racially, this table suggests that census block groups are slightly less White and Black and slightly more Hispanic than the average census block group. Regionally, the West is overrepresented, and all other regions are slightly underrepresented. Slight density differences imply that urban census block groups may be better represented in the data than rural census block groups. I effectively control for all these potential differences in my models through racial composition variables and agency fixed effects.
Sample versus Nationwide Census Block Groups: Means Comparison.

My two socioeconomic measures derive from American Community Survey data. Following past research, I operationalize residential disadvantage as the factor from a principal factor analysis of seven variables: percentages of poverty, unemployment, single-headed households, public assistance receipt, adults without high school diplomas, adults with bachelor’s degrees or higher, and workers who are managers or professionals (Levy et al. 2020; Wodtke et al. 2011).
My second socioeconomic measure is indegree disadvantage (IND). In alignment with recent research, IND represents the average level of neighborhood disadvantage associated with nonresident visitors to a neighborhood. This mobility-based measure of disadvantage has been demonstrated to be a stronger predictor of various adverse neighborhood outcomes compared with the residential measure of disadvantage. I derive an estimate of IND relying on 2019 SafeGraph data. This approach is made at the census block group scale but otherwise follows strictly from recent research (Levy et al. 2022).
To do so, I first construct a nationwide mobility network with values

where

My population offset is constructed using a recent method (Vachuska and Levy 2022). The population at risk for experiencing specific emergencies in a particular neighborhood, such as a medical emergency or a traffic collision, is not simply the neighborhood’s residential population. Instead, people travel widely in their everyday lives, and certain areas, such as commercial areas, may have ambient everyday populations that are substantially different from their residential population. As such, I use 2015 to 2019 American Community Survey population estimates in conjunction with SafeGraph visit data to estimate an ambient daily population. This ambient population is equivalent to the sum of the residential population of the neighborhood and the average number of daily visitors in 2019. I strictly follow recent research in applying this method (Vachuska and Levy 2022).
Estimating ambient population begins by using SafeGraph data to construct nationwide mobility networks to estimate the total number of visitors to each neighborhood. These networks stand in distinction from the previously mentioned mobility networks by involving varying weights to precisely estimate visitor counts rather than simply modeling the overall patterns.
These mobility networks are valued digraphs comprising sets of nodes (census block groups),

where
Additional data for this project come from the 2015 to 2019 American Community Survey 5-year estimates. These variables include: percentage of the population younger than 18 years, percentage of the population older than 65 years, percentage of households with no vehicles, population density, total land area, the total number of households, percentage of households in which at least one person has a disability, median household size, median home age, percentage of households that are vacant, median home value, percentage of households that are single family (reference), percentage of households that are not single family, percentage of households that are recreational vehicles, and percentage of households that use gas fuel.
Last, an additional measure is obtained from SafeGraph’s point-of-interest database. Specifically, I calculate the number of unique points of interest in each census block group. Points of interest can constitute a notable place of any type, though most are businesses or workplaces. This measure subsequently provides a proxy of the scale of nonresidential infrastructure in each neighborhood. Certain incident types, such as fires, often occur in nonresidential contexts and thus necessitate a proxy for the scale of nonresidential infrastructure. Table 2 contains summary statistics on all variables involved in this analysis.
Census Block Group Summary Statistics.

Note: IND = indegree disadvantage; POI = point of interest; RND = residential disadvantage.
Methods
For the six outcomes, I estimate the number of reported incidents a given neighborhood experiences in the study time frame using Poisson models with agency-level fixed effects. Agency-level fixed effects account for the fact that certain agencies may only respond to certain types of incidents or may subjectively classify incidents differently. The key racial variables are percentage non-Hispanic Black, percentage Hispanic (of any race), and percentage other, with percentage non-Hispanic White being the omitted reference group. The two socioeconomic variables are residential disadvantage and IND.
My main model can be written as follows:

where
I use different controls depending on what incident type I am modeling. Both past research and relevant theoretical mechanisms inform all sets of controls. The set of controls in the medical emergencies models mainly consists of health-related variables and a car ownership variable to control residents’ ability to travel on their own to receive medical care. The same set of controls is used for modeling fires, gas leaks, carbon monoxide leaks, and hazardous incidents. This set of controls includes a battery of variables that measure infrastructure characteristics, quality, and scale. Last, a unique set of controls are used for modeling traffic collisions. This set of controls includes measures for the size of populations that may have disparate risks for being involved in traffic collisions and proxy measures for the scale and density of traffic and activity in the neighborhood.
Results
Medical Emergencies
Table 3 displays the results of models for medical emergencies. Model 1 includes racial composition variables, ambient population offset, and agency fixed effects. These results suggest that neighborhoods with greater proportions of Black and Hispanic residents experience more medical emergencies, whereas a greater proportion of other residents is associated with decreased incidence. Model 2 includes socioeconomic variables, ambient population offset, and agency fixed effects. Model 2’s results suggest that residential disadvantage, but not IND, is associated with an increased incidence of medical emergencies. Model 3 includes racial composition and socioeconomic variables and indicates that proportion Black and residential disadvantage are positively associated with incidence. Notably, the effect of proportion Hispanic becomes negative in this model, indicating that conditional on socioeconomic status, Hispanic neighborhoods experience fewer medical emergencies relative to White neighborhoods. Finally, model 5 includes all variables and a robust set of controls for neighborhood characteristics that may be predictive of medical emergencies. These results suggest that, net of a large set of controls, neighborhood proportion Black is still strongly associated with the incidence of medical emergencies. All else equal, a 100 percent Black neighborhood would be expected to experience 72 percent more medical emergencies than a 100 percent White neighborhood. These results also imply that residential disadvantage, but not IND, is a strong predictor of the incidence of medical emergencies.
Poisson Models Predicting Census Block Group Medical Emergencies.

Note: AIC = Akaike information criterion; BIC = Bayesian information criterion; IND = indegree disadvantage; RND = residential disadvantage.
p < .05. **p < .01. ***p < .001.
The control variables’ coefficients also shed light on other neighborhood attributes strongly associated with the incidence of medical emergencies. As one might hypothesize, model 5 indicates that neighborhoods with older populations have a much higher incidence of medical emergencies. Perhaps more surprising, model 5 also provides evidence to indicate that the percentage of households without a vehicle is an extremely strong predictor of medical emergencies, highlighting the potential role that vehicle access may play in health disparities.
Fires
Table 4 displays the results of models for fires. Model 1 includes racial composition variables, ambient population offset, and agency fixed effects. This model indicates that neighborhoods with a greater proportion of Black residents experience more fires. Model 2 includes socioeconomic variables, ambient population offset, and agency fixed effects. These results suggest that residential disadvantage is slightly associated with increased incidence of fires, whereas IND is strongly associated. Model 3 includes racial composition and socioeconomic variables, with the results indicating that IND is strongly positively associated with incidence. Notably, the effect of proportion Black is attenuated beyond statistical significance here, and the effect of proportion Hispanic becomes negative, highlighting the importance of IND as a predictor of fires. Model 5 includes all variables and a robust set of controls on household characteristics. Notably, significant positive effects of proportion Black and Hispanic reappear in this model, suggesting control variables that are negatively associated with fires may be positively associated with proportion Black and Hispanic. All else equal, a 100 percent Black neighborhood would be expected to experience 82 percent more fires than a 100 percent White neighborhood, while a 100percent Hispanic neighborhood would be expected to experience 55 percent more fires than a 100 percent White neighborhood. These results additionally suggest that IND, but not residential disadvantage, is a strong predictor of the incidence of fires.
Poisson Models Predicting Census Block Group Fires.

Note: AIC = Akaike information criterion; BIC = Bayesian information criterion; IND = indegree disadvantage; POI = point of interest; RND = residential disadvantage; RV = recreational vehicle.
p < .05. **p < .01. ***p < .001.
Traffic Collisions
Table 5 displays the results of models for traffic collisions. Model 1 includes racial composition variables, ambient population offset, and agency fixed effects. These results indicate that neighborhoods with greater proportions of Black and Hispanic residents experience far more traffic collisions. Model 2 includes socioeconomic variables, ambient population offset, and agency fixed effects. Coefficient estimates indicate that both residential disadvantage and IND are strongly associated with an increased incidence of traffic collisions. Model 3 incorporates racial composition and socioeconomic variables, suggesting that proportion Black, residential disadvantage, and IND are positively associated with incidence. In line with past research, the strong associations observed for both residential and IND highlight how neighborhoods that are disadvantaged across multiple dimensions may experience heightened social disorder and especially adverse outcomes. (Levy et al. 2020) Finally, model 5 includes all variables and a robust set of controls for factors that may affect the risk for traffic collisions. These results suggest neighborhood proportion Black, and proportion Hispanic to a lesser extent, are positively associated with the incidence of traffic collisions. All else equal, a 100 percent Black neighborhood would be expected to experience 125 percent more traffic collisions than a 100 percent White neighborhood. Model 5 also indicates that IND, but not residential disadvantage, is a strong predictor of traffic collisions.
Poisson Models Predicting Census Block Group Traffic Collisions.

Note: AIC = Akaike information criterion; BIC = Bayesian information criterion; IND = indegree disadvantage; POI = point of interest; RND = residential disadvantage.
p < .05. **p < .01. ***p < .001.
Gas Leaks
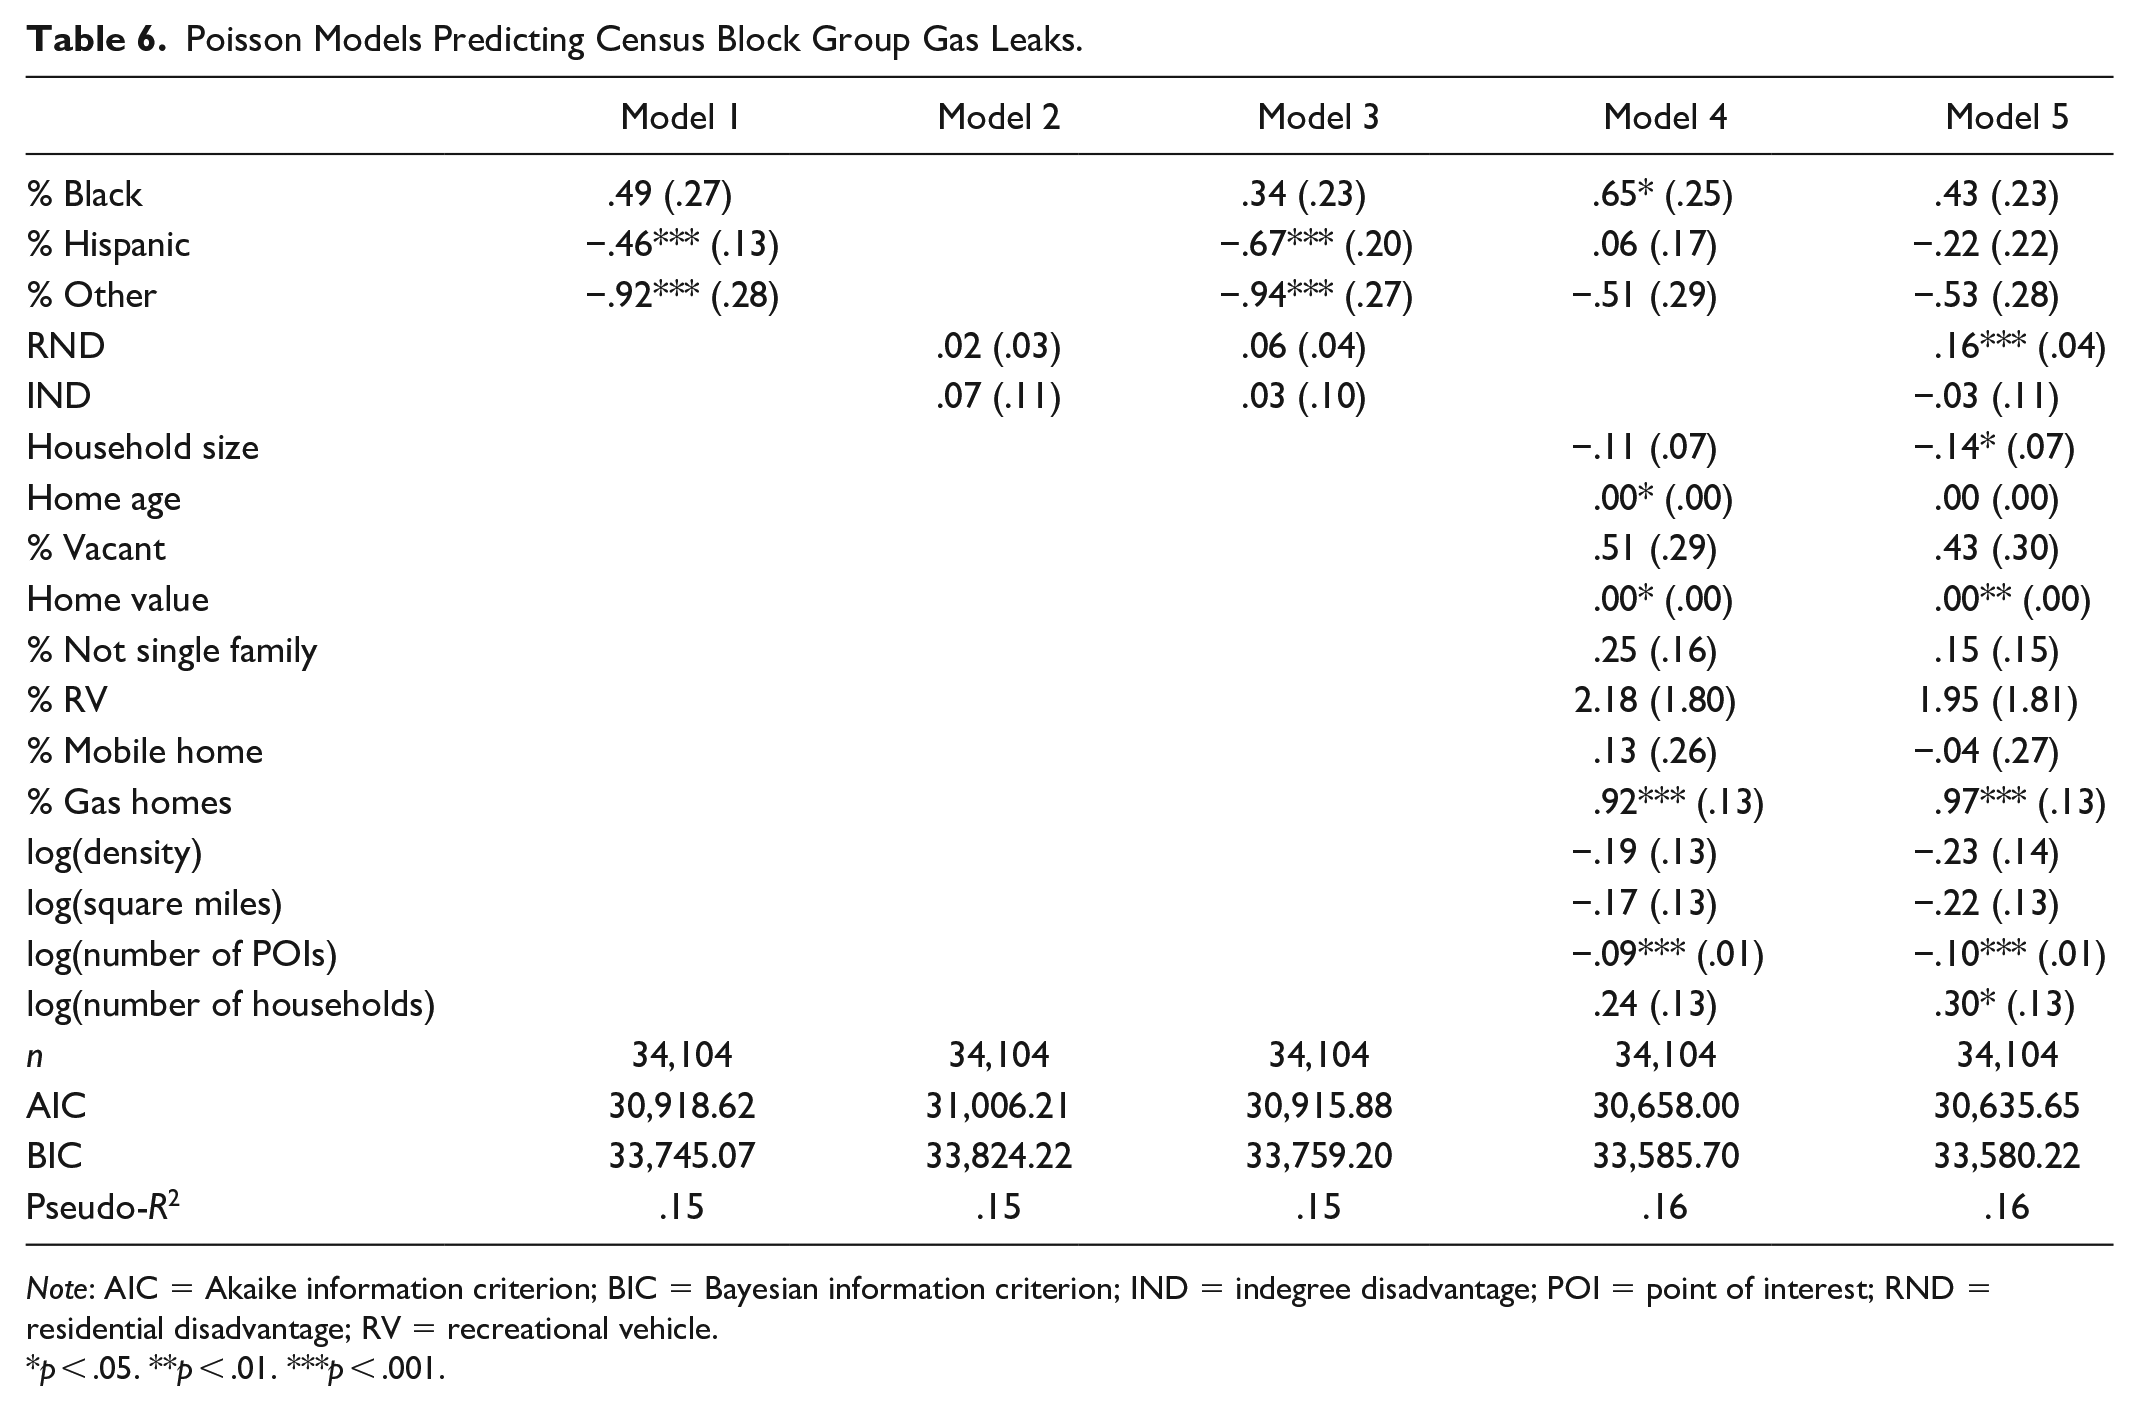
Table 6 displays the results of models for gas leaks. Model 1 includes racial composition variables, ambient population offset, and agency fixed effects. Notably, these results suggest that neighborhoods with greater proportions of Hispanic and other residents experience fewer gas leaks. The effect of proportion Black is positive but falls outside statistical significance. Model 2 includes socioeconomic variables, ambient population offset, and agency fixed effects. Coefficient estimates indicate that neither residential disadvantage nor IND has a statistically significant association with the incidence of gas leaks. Model 3 includes racial composition and socioeconomic variables and suggests that both proportion Hispanic and other are negatively associated with incidence. Notably, proportion Black, residential disadvantage, and IND do not have statistically significant associations with gas leaks. Model 5 includes all previous variables and a robust set of controls. These results suggest that net of a large set of controls, neighborhood proportion other has a slight negative association with the incidence of gas leaks, whereas no other racial composition variables have significant associations. Residential disadvantage, but not IND, is strongly associated with gas leaks net of controls.
Poisson Models Predicting Census Block Group Gas Leaks.
Note: AIC = Akaike information criterion; BIC = Bayesian information criterion; IND = indegree disadvantage; POI = point of interest; RND = residential disadvantage; RV = recreational vehicle.
p < .05. **p < .01. ***p < .001.
Carbon Monoxide Leaks
Table 7 displays the results of models for carbon monoxide leaks. Model 1 includes racial composition variables, ambient population offset, and agency fixed effects. These results suggest that neighborhoods with a greater proportion of Black residents experience far more carbon monoxide leaks, whereas greater proportions of Hispanic and other residents are associated with substantially reduced incidence. Model 1’s results suggest that a 100 percent Black neighborhood experiences 112 percent more carbon monoxide leaks than a 100 percent White neighborhood. Model 2 includes socioeconomic variables, ambient population offset, and agency fixed effects. Surprisingly, model 2 results suggest that residential disadvantage is negatively associated with the incidence of carbon monoxide leaks. Model 3 includes both racial composition and socioeconomic variables and shows an increased effect of proportion Black compared with model 1. Model 5 includes all variables and a robust set of controls. These results indicate that, net of a large set of controls, neighborhood proportion Black is strongly associated with the incidence of carbon monoxide leaks, whereas no other racial proportion or socioeconomic variable show any statistical significance. All else equal, a 100 percent Black neighborhood would be expected to experience 219 percent more carbon monoxide leaks than a 100 percent White neighborhood.
Poisson Models Predicting Census Block Group Carbon Monoxide Leaks.

Note: AIC = Akaike information criterion; BIC = Bayesian information criterion; IND = indegree disadvantage; POI = point of interest; RND = residential disadvantage; RV = recreational vehicle.
p < .05. **p < .01. ***p < .001.
Hazardous Incidents
Table 8 displays the results of models for hazardous incidents. Model 1 includes racial composition variables, ambient population offset, and agency fixed effects. These results indicate that neighborhoods with a greater proportion of Black residents experience more hazardous incidents, whereas a greater proportion of other residents is associated with decreased incidence. Model 2 includes socioeconomic variables, ambient population offset, and agency fixed effects. Model 2’s results suggest that residential disadvantage, but not IND, is associated with an increased incidence of hazardous incidents. Model 3 includes racial composition and socioeconomic variables and indicates that proportion Black, residential disadvantage, and IND are positively associated with incidence. Finally, model 5 includes all variables and a robust set of controls. These results find that net of a large set of controls, neighborhood proportion Black is still strongly associated with the incidence of hazardous incidents. All else equal, a 100 percent Black neighborhood would be expected to experience 134 percent more hazardous incidents than a 100 percent White neighborhood. These results also suggest that residential disadvantage, but not IND is a strong predictor of the incidence of hazardous incidents.
Poisson Models Predicting Census Block Group Hazardous Incidents.

Note: AIC = Akaike information criterion; BIC = Bayesian information criterion; IND = indegree disadvantage; POI = point of interest; RND = residential disadvantage; RV = recreational vehicle.
p < .05. **p < .01. ***p < .001.
Discussion
In this work I have examined six common emergency incident types: medical emergencies, fires, traffic collisions, gas leaks, carbon monoxide leaks, and hazardous incidents. Despite these incidents varying widely in nature and cause, inequalities remain consistent. Neighborhoods with more Black residents show an increased incidence across essentially all outcomes. Among the most extreme, my models suggest that net of a comprehensive set of controls, a neighborhood that is 100 percent Black experiences more than three times as many carbon monoxide leaks as a 100 percent White neighborhood. In contrast, these results suggest relatively fewer disparities exist between White and Hispanic and White and other neighborhoods. However, these results do indicate modest associations in terms of neighborhood socioeconomic status and incidence of several event types. In particular, I find that residential disadvantage is strongly associated with medical emergencies, while IND is strongly associated with fires. Both are strongly associated with traffic collisions. Generally, these results contribute to a growing literature that has documented the importance of both residential and mobility-based measures of disadvantage in predicting adverse neighborhood outcomes (Levy et al. 2020).
Although these observed inequalities are incredibly stark, I discourage causal claims in the absence of further research. Despite the unique detail of the data involved in this work, these data do not exist without limitation. First, it is important to acknowledge that the sample of agencies used in this analysis is not entirely nationally representative. Agencies voluntarily elected to use the service from which data were obtained, and the sample appears skewed toward urban areas in the western United States. It would benefit future research to explore other data sets and samples in analyzing emergency service responses. An additional limitation, false-alarm dispatches cannot be distinguished in the data set and thus are inherently included. Although there generally is no reason to believe that false alarms are distributed unevenly, it may make sense for some types of incidents. Specifically, given that Blacks may have greater vulnerability to carbon monoxide leaks, it may be possible that increased incidence of calls related to carbon monoxide may be a result of the larger risk causing individuals to act out of an abundance of caution. Although I cannot rule out false alarms’ confounding these results, it seems generally unlikely given the scale of disparities. Additionally, calls for traffic collisions, in particular, seem unlikely to be false alarms.
Generally, these results invite a deeper theoretical discussion regarding race and neighborhood inequalities. Although violence has been a central topic studied for its ecological implications, recent environmental racism research has documented a wider range of phenomena that plague neighborhoods. These results highlight several adverse incident types for which massive racial disparities exist that little research has explored previously. Notably, nearly all of the uncovered racial composition associations persisted net of a battery of controls. These stark findings implore future researchers to identify mechanisms that mediate these disparities. Ultimately, given the scale of racial inequality unveiled here, future research must further investigate and uncover the meaningfulness of the likely consequential events examined here.
Footnotes
Acknowledgements
I thank Trevor Bagels for facilitating access to some of the data involved in this project.