
Abstract
Scholars often treat immigrants from the same country as a monolithic group, but intranational ethnicity is usually associated with distinctive premigration backgrounds and migration experiences and plays a role in shaping immigrant adjustment and incorporation in the host country. The authors use census data to distinguish ethnic Chinese from the Vietnamese national group to analyze educational heterogeneity across immigration generations. The results show that first-generation Chinese Vietnamese exhibit much lower levels of education than their Vietnamese counterparts, but this disparity vanishes by the 1.5 generation. The authors also find that both Vietnamese subgroups contribute to the second-generation convergence with Chinese Americans, but Chinese Vietnamese are able to overcome disadvantages more quickly and have slightly higher educational achievement than ethnic Vietnamese. Our case study illustrates how ethnicity and national origin can be disaggregated using nationally representative data and how this approach can provide unique insights into immigration studies in general.
The notion of national origin has always been a prominent feature in academic research and social policies concerning immigration. It is the default way of studying immigrants and comparing them with the native-born population. Nevertheless, this approach ignores premigration home country situations and assumes that immigrants from the same country are homogeneous, thus minimizing intranational differences. A case in point is ethnicity. With a few exceptions, immigration studies have paid only scant attention to the distinction between ethnicity and nationality. In fact, these two terms are often used interchangeably; researchers routinely interpret differences among national groups as differences among ethnicities.
However, ethnic studies scholars pointed out the importance of distinguishing immigrant groups from the same country, especially those who constituted an ethnic minority in their home country from those who were the ethnic majority (Bozorgmehr 1997; Espiritu 1989; Gold 1991, 1994; Min 2013; Min and Kim 2009; Min and Park 2014). They argue that because the first group has already experienced ethnicization in their home country, they are not new to their minority status and become “twice migrants” or “twice minority” after migration. Their preexisting ethnic solidarity can translate to social capital and offer economic and political advantages over the second group, the “first-time minority,” who tend to be more fragmented upon arrival and have to develop a minority identity for the first time in the host country. Therefore, conflating ethnicity and nationality may lead to omission of critical socioeconomic and cultural nuances among subgroups, thus obscuring distinctive immigrant adaptation trajectories. This problem affects our understanding of all immigrant assimilation, but it is especially relevant for ethnically diverse groups.
Prior studies of Asian American education showed that the education levels of Vietnamese youth, especially those of low family socioeconomic status, rapidly increased and converged toward those of their Chinese counterparts, exceeding comparable native-born whites (Lee and Zhou 2015; Sakamoto, Iceland, and Siskar 2022; Takei, Sakamoto, and Kim 2013). This second-generation convergence between Vietnamese and Chinese, despite enormous interethnic differentials between their parental generations, is intriguing. Nevertheless, it is important to note that, past empirical findings, quantitative or qualitative, were often based on analyses treating Vietnamese and Chinese as two distinctive groups. This approach is less problematic for immigrants from China because of its large group size and relatively monolithic ethnic makeup. However, Vietnamese immigrants are a smaller, more ethnically diverse population, in which Sino-Vietnamese 1 is a sizable minority with a strong linguistic and cultural connection with Chinese. Consequently, treating Vietnamese as a homogeneous group and comparing them with Chinese is analytically problematic, because “reducing ethnicity to national-origin” may obscure major group differences and produce misleading findings (Bozorgmehr 1997:387).
Our research uses Chinese Vietnamese as an example to illustrate the necessity of decoupling ethnicity and national origin in immigration studies. We systematically document intranational educational differences among Vietnamese refugees and their descendants in the United States using nationally representative data. With an innovative approach, we are able to single out Chinese Vietnamese (Rumbaut 2007; Trieu 2009) by using the 1980, 1990, and 2000 censuses as well as the five-year, 2008–2012 sample of the American Community Survey (ACS). We complement our analysis with an intergroup comparison with three cohorts of Chinese American for a more comprehensive overview. Our findings show that among first-generation immigrants, Sino-Vietnamese have much lower levels of education than ethnic Vietnamese. This gap disappears within one generation; by the 1.5 generation, there is no significant difference between them. Furthermore, the most recent data show that the educational attainment of second-generation Chinese Vietnamese slightly exceeds that of their Vietnamese counterparts and becomes closer to the level of second-generation Chinese. Taken together, our results suggest that Vietnamese of Chinese ancestry represent the strongest case of upward mobility among all three groups. We contribute to the literature with an illuminating case that disaggregating ethnicity and national origin can bring new insights into immigrant diversity and adaptation in general and Asian American education achievement in particular.
Historical Background
Because of geographical proximity and historical reasons, there is a long history of Chinese migration into Vietnam. Several large waves of Chinese migrated to Vietnam voluntarily over the early centuries, but it was not until the nineteenth century that Chinese started to establish a large social presence in Vietnam under the French colonial rule (Pan 1999). Treating Sino-Vietnamese as the “middle man” who helped their governance, the French government actively encouraged Chinese economic and population growth (Gold 1994; Trần 1993). Because of political instability at home and economic appeal in Vietnam, a large number of Chinese immigrated during that time, especially to the southern part of Vietnam (Whitmore 1985). As a result, the end of French colonial rule saw a predominantly urban Chinese population employed in business, industry and commerce, controlling most of the Vietnamese internal trade, though constituting only 3 percent of the total population (Skinner 1951:20).
As in much of Southeast Asia, ethnic Chinese in Vietnam was an economically powerful but socially marginalized minority group. As Desbarats (1986) described, The Sino-Vietnamese distinguished themselves (from the Vietnamese society) by their extraordinary attachment to their native land, their tightly knit social organization, their persistent use of Chinese regional dialects, their enduring reverence for Confucianist tenets, their separate education system, their overwhelming concentration in commercial occupations, and their geographic concentration in the Southern cities of Vietnam (Debre 1976; Tsai 1968).
Being numerically small as a group and many without Vietnamese citizenship, ethnic Chinese commercial success did not directly translate to higher education or social status. Instead, they were often subject to hostilities from the majority Vietnamese, and many of them saw their wealth evaporated by the early 1980s (Chang 1982; Gold 1994). As discussed next, the strongest conflict between the two groups occurred during the late 1970s, which propelled the vast majority of ethnic Chinese out of Vietnam.
Contexts of Exit
After the fall of Saigon in 1975, both Vietnamese and the ethnic Chinese fled Vietnam into the United States in large numbers. Although on the surface both groups had the same “context of exit,” a closer look into the history reveals some key differences in the exiting experiences between them.
First, Sino-Vietnamese and Vietnamese arrived at different points of time. They came to the United States under disparate sociopolitical circumstances with highly dissimilar socioeconomic backgrounds. There were three separate waves of refugees from Vietnam to the United States (Lee and Zhou 2015; Trieu 2009). The initial wave began in 1975 and lasted until 1978. About 130,000 refugees arrived during this period, and many were airlifted from South Vietnam (Freeman 1995). They were disproportionally composed of the elite and the middle class, who were mostly ethnic Vietnamese (Rumbaut 2007; Trieu 2009). The second wave of mass exodus fled Vietnam between late 1978 and 1982. Some fled on foot into neighboring countries, while the majority were known as the “boat people,” escaping Vietnam on small, overcrowded fishing boats. Compared with the first wave, the second wave was larger, arrived under more chaotic and traumatizing circumstances, and involved a more ethnically and socially diverse population. It is estimated that during these years, 400,000 Vietnamese refugees resettled in the United States, and 50 percent to 70 percent were ethnic Chinese, who overwhelmingly had low levels of education, no English skills, and little financial resources (Caplan, Choy, and Whitmore 1991; Chang 1982; Zhou and Bankston 1998). The third wave began in 1982 and subsided in the mid-1990s, when ethnic Vietnamese were again the vast majority (Trieu 2009). Because of the passage of the Refugee Act of 1980, which mandated a systematic procedure for refugee admission, this wave arrived in a much more orderly fashion.
Second, compared with the Vietnamese, ethnic Chinese left Vietnam in a rather different domestic political environment. The out-migration of Vietnamese was driven primarily by the Vietnam War per se and the consequent change of the political regime in Vietnam (Trieu 2009). In contrast, the Sino-Vietnamese exit was more of a response to rising anti-Chinese sentiments and actions, which started before the Vietnam War and grew increasingly harsh in the immediate years after the war (Gold 1994; Lee and Zhou 2015; Rumbaut 2007; Trieu 2009). As a capitalistic minority group, the ethnic Chinese became one of the main targets of political and economic prosecution in the communist Vietnam. Many were arrested and stripped of their land and wealth; later their loyalty was questioned because of the heated Vietnam-China conflict, which started in the late 1970s. The deliberate expulsion of Sino-Vietnamese led to their desperation and overrepresentation among the “boat people,” one of the largest exoduses in modern history. 2 In summary, although both groups left Vietnam out of fear of war, political instability and violence, the Chinese experience was tightly linked with their ethnic minority status, which, as discussed later, ultimately shaped their resettlement and adaptation in the United States.
Context of Reception
Prior research on Asian Americans draws a stark contrast between Vietnamese refugees and contemporary Chinese immigrants, mostly from mainland China, Taiwan, and Hong Kong (Lee and Zhou 2015, 2017). Chinese migration to the United States is considered to be strongly motivated by economic reasons. Most Chinese immigrants leave their homeland voluntarily and their adaptation to the host society is facilitated by preexisting ethnic communities and family networks. In comparison, as political refugees fleeing war, Vietnamese came to the United States involuntarily. Almost everyone began his or her life in the United States on welfare without established ethnic communities or family networks in place to receive them.
The contrast above is an overstatement, however, if we acknowledge Vietnamese as an ethnically heterogeneous group that includes ethnic Chinese. Above all, what draws Chinese Vietnamese and ethnic Vietnamese apart in terms of the context of reception is the strength of preexisting ethnic community, especially during their initial settlement. Prior to 1975, the Vietnamese community was virtually nonexistent in the United States (Lee and Zhou 2015; Trieu 2009), so the early cohorts of Vietnamese relied exclusively on the U.S. government and individual or institutional sponsors for settlement and incorporation into the host society. In contrast, Sino-Vietnamese experiences were quite different. Their refugee status and benefits were no different from ethnic Vietnamese, but their Chinese identity and deliberately preserved Chinese culture and language quickly put them in close contact with the preexisting Chinese diaspora community. For example, Sino-Vietnamese took great efforts in retaining their Chinese regional dialects, including Cantonese, Teochew, Hakka, Fukien, and Hainanese (Trần 1993), which also happened to be the major dialects among early Chinese immigrants in the United States (Lee and Zhou 2015). Moreover, although both Vietnamese groups were generally influenced by Confucianism and Buddhism because of their common history, Sino-Vietnamese adhered to Confucianism more tightly, whereas ethnic Vietnamese were far more likely to be Catholic (Desbarats 1986; Rumbaut 2007). As a result, there was a minimal cultural and linguistic distance between the Chinese refugees from Vietnam and the established Chinese community in the United States, whereas that was not the case for other Vietnamese.
Previous research suggested that Sino-Vietnamese might have experienced an easier path of adaptation in the United States, facilitated by the Chinese immigrant community. For instance, among all the difficulties Vietnamese refugees faced upon arrival, a lack of English language skills was one of the biggest obstacle to a new life (Caplan et al. 1991). However, many Chinese Vietnamese were able to live in urban Chinatowns because of their ability to speak Chinese (Lieu 2011). Coming from an urban entrepreneurial class, they started to develop good relationships with other Chinese business people and launch small businesses after initial adjustment. It turned out that many largest refugee enterprises in West Coast cities, including San Francisco, Oakland, San Jose, Los Angeles, and Seattle, were owned by the ethnic Chinese in early 1990s (Gold 1994). Currently, about two of three small businesses in Chinatown in Los Angles are still owned or operated by Chinese Vietnamese (Lee and Zhou 2015).
Literature Review
Despite numerous distinctions, Sino-Vietnamese and Vietnamese have been routinely subsumed under an umbrella category in immigration studies. There are two major reasons for a lack of acknowledgment of ethnic differences in the previous literature concerning Vietnamese refugees and their children. One is likely an inadequate understanding of the ethnic makeup of this population. It is not widely known that Vietnam is a multiethnic country, 3 so unsurprisingly, fewer scholars are aware that ethnic Chinese made up a disproportionally large part of the refugees from Vietnam (Lieu 2011; Rumbaut 2007). Second, for researchers who are interested in ethnic differences within national origin, however, there is a lack of credible data sources. Federal statistics on immigrants and refugees are based solely on national origin, whereas large-scale social surveys that include or target immigrants rarely collect any information on subnational ethnicity (Rumbaut 2007; Yu and Liu 1986).
Limited comparative research provides conflicting results about early integration and adjustment experiences of the two groups. Using a national survey of Indochinese refugees conducted in 1982 for the Office of Refugee Resettlement, Tran (1991) examined the relationships between types of sponsorship and employment status among three ethnic groups including Laotians, Vietnamese, and Chinese Vietnamese. The results indicated that the types of sponsorship did not vary across ethnic groups, and more important, with sponsorship and individual background variables controlled, there was no statistical difference in employment status between Sino-Vietnamese and Vietnamese. This finding is consistent with Goza’s (1990) result of no significant difference in linguistic acculturation between the two Vietnamese subgroups. However, both findings contradict what Desbarats (1986) showed in her study on the basis of a survey of Vietnamese refugees in Illinois and California in 1982. Her analyses showed strong disadvantages of the Chinese group with respect to both acculturation adaptation and economic self-sufficiency, which cannot be explained by their pre-arrival characteristics, such as lower education levels and differences in resettlement context. Particularly, Desbarats pointed out that although the economic adaptation behaviors of refugees with little education and limited English are similar regardless of ethnicity, the Chinese with more favorable socioeconomic characteristics appeared to lag behind their Vietnamese counterparts in markedly different ways. Gold’s (1994) qualitative study on Vietnamese refugees in California confirmed that Sino-Vietnamese had strikingly worse economic profiles than Vietnamese and were more likely to be unemployed, depend on welfare, and live in poverty. Meanwhile, Gold (1991) also found that ethnic Chinese had a stronger ethnic identity than ethnic Vietnamese, and Chinese entrepreneurs benefited more from community solidarity.
Focusing on the 1.5 generation, Rumbaut and Ima (1987) conducted the first comprehensive study on Southeast Asian students and their parents on the basis of both quantitative and qualitative data collected in 1986 and 1987 in San Diego, California. Parallel to Gold’s (1994) findings, the results showed that Vietnamese parents were more educated, with an average of more than nine years of education, were more likely to be employed, and had a lower poverty rate than Chinese Vietnamese. They also found that although children from both groups were among the top students in area high schools, Vietnamese students outperformed Chinese Vietnamese on most of the academic measures. Similarly, using survey interviews conducted in 1982 and 1984 across five cities, Caplan et al. (1991) reported that Sino-Vietnamese children tended to earn lower grade point averages than Vietnamese children.
Rumbaut (2007) and Trieu (2009) produced the only work, to the best of our knowledge, using nationally representative data to break down the Vietnamese national group into ethnic Vietnamese and Sino-Vietnamese. Using 2000 census data, they combined self-reported race with birthplace, ancestry, and language spoken at home to identify Chinese Vietnamese, a methodological approach that we decided to adopt and improve on in this study. However, because of data limitations, Rumbaut and Trieu were not able to make comparisons across immigrant generations. Their contribution is a snapshot of detailed population statistics by the two subgroups in 2000. They found significant differences between ethnic Vietnamese and Sino-Vietnamese in terms of patterns of arrival time, socioeconomic characteristics, and residential settlement. They showed that Sino-Vietnamese had a marginally worse education profile than ethnic Vietnamese among persons aged 25 years and older in 2000.
Another exception is the Children of Immigrants Longitudinal Study (CILS), a panel survey designed to study the adaptation process of the immigrant second generation from 1991 to 2006. As far as we know, CILS is the only large social survey with a design feature that allows researchers to distinguish Sino-Vietnamese from Vietnamese. Drawing on data from the CILS, Rumbaut (2007) found that Chinese Vietnamese parents tended to have lower levels of education than Vietnamese parents, but Chinese Vietnamese youth achieved higher average scores in middle school and higher grade point averages in high school and were more likely to attend college and graduate school by age 24. Because most of the Chinese Vietnamese respondents in his study came to the United States before age 5, Rumbaut’s findings may reveal potential shifts of educational achievement patterns between the two groups over time. Furthermore, as there were only 362 respondents of either ethnicity in the CILS and the survey site was limited to San Diego, these findings may not be generalizable.
In summary, previous studies seem to point to a worse education profile of Chinese Vietnamese than Vietnamese among the first generation, but we do not know how their adaptation experiences differ. There is a dearth of large-scale studies on education variation within Vietnamese children, so we know little about how the two subgroups compare with each other. Lee and Zhou (2015) found second-generation convergence between Vietnamese and Chinese, when considering Vietnamese as a monolithic national group. However, it is unclear whether younger generations of both Sino-Vietnamese and Vietnamese, or only one of the two groups, contribute to the academic excellence observed at the group level. If the latter is true, previous findings about Asian American education achievement are likely to be biased because of the omitted variable of intranational ethnicity (Trieu 2013). Methodologically, questions also arise such as whether Chinese Vietnamese should be subtracted from the Vietnamese totals and added to the Chinese group. Prior results that compare Vietnamese with Chinese on the basis of national origin are likely in need of reassessment or revision because of this intersection of ethnicity and nationality.
Data and Methods
We used the 5 percent Public Use Microdata Sample of the 1980, 1990, and 2000 censuses as well as the five-year, 2008–2012 sample of the ACS. We chose these sources for three major reasons. First, they consistently included key variables that we needed for our study, including detailed sociodemographic information such as race/ethnicity, language, year of immigration, education, and those that make identification of Chinese Vietnamese ethnicity possible (i.e., ancestry, self-identified race, language, and birthplace). Second, these were and still are the largest nationally representative data available, so we had the best chance of obtaining subsamples of sufficient sizes to compare small intranational ethnic groups such as Chinese Vietnamese and ethnic Vietnamese. Third, with the midyear of the five-year ACS sample being 2010, these data sets are about ten years apart, which enable us to observe education trajectories of Vietnamese subgroups across generations.
As our focus was educational attainment of Vietnamese Americans, we restricted our target populations to only ethnic Vietnamese, Chinese Vietnamese, and Chinese, 4 who served as a comparison group. Respondents who were still enrolled in school or less than 25 years old at the time of data collection were dropped. To obtain a more precise measure of educational attainment among Vietnamese refugees, we also excluded the following foreign-born groups from our analysis: Chinese Vietnamese who had been in the US for fewer than five years by 2000 or fewer than fifteen years by 2010, and Vietnamese who had been in the US for fewer than ten years by 2010. The reasons behind these decisions were twofold. First, by dropping recent arrivals from the analysis, we were less likely to conflate refugees from 1970s and 1980s with a distinctly new stream of economic immigrants of intellectuals and entrepreneurs from Vietnam, which started in the 1990s and has been growing steadily, especially after 2000. 5 Second, the majority of ethnic Vietnamese refugees entered the United States later than Chinese Vietnamese 6 (Rumbaut 2007; Trieu 2009).
Distinguishing Sino-Vietnamese from Vietnamese and Chinese in our data was a complex process for two reasons. First, self-identification of Chinese Vietnamese by choosing both Vietnamese and Chinese in the race question was unavailable until after 2000. Second, although respondents were allowed to report multiple racial/ethnic groups in both the 2000 census and the 2008–2012 ACS, self-identification is in general far from being reliable for small intranational ethnic groups such as Chinese Vietnamese (Min 2013; Trieu 2009). Instead, we adopted a more subjective approach by combining self-identification with other relevant variables (i.e., language, ancestry, and birthplace) to single out Chinese Vietnamese from Chinese and Vietnamese. The nineteen detailed coding decisions for constructing the Chinese Vietnamese category are displayed in Table A1 in the Appendix, yielding highly consistent results across the samples. In particular, as shown in Table A2, four of the nineteen categories, which are not mutually exclusive, capture 90 percent to 96 percent of the total Chinese or Vietnamese reclassified across our data sets. They are the respondents (1) who identified themselves as both Chinese and Vietnamese 7 ; (2) who were born in Vietnam but self-identified as Chinese; (3) who self-identified as Vietnamese but reported having Chinese, Cantonese, or Taiwanese as their first ancestry; or (4) who were born in Vietnam but reported Chinese, Cantonese, or Taiwanese as their first ancestry. To safeguard our code, we also crosschecked the Chinese Vietnamese categorization with single race identification. Given that Vietnamese as a race category is not available at all, individuals whose assigned single-race category was not Chinese or Asian were excluded from the final sample. 8 In summary, we have confidence that our carefully designed coding approach reasonably reflects the unique characteristics and experiences of Sino-Vietnamese. It enables us to capture intranational heterogeneity and study ethnic differences within the same country of origin at a large scale, when there is no direct measures of Chinese Vietnamese in nationally representative data sets.
Another important independent variable is immigrant generation status. We took advantage of our samples sizes and coded generation status using Rumbaut’s (2004) approach. We coded first-generation immigrants for those who were foreign born and immigrated to the United States at age 13 or older. Those who migrated to the United States between 5 and 12 years of age were considered as 1.5 generation. Second generation consisted of two subgroups: immigrants who were foreign born but came to the United States before age 5 and those who were native born with at least one foreign-born parent. Because few Vietnamese (<10 percent in the 2008–2012 ACS) were native born with native-born parents (i.e., third or third-plus generation), they were included in second generation in the analysis. 9 The separation between 1.5 generation and second generation allows us to capture how quickly education outcomes diverged or converged between the two Vietnamese subgroups.
We coded educational attainment, our dependent variable, as a categorical variable for descriptive purposes. The five categories were less than high school, high school diploma, some college, bachelor’s degree, and master’s degree or higher. 10 For easiness of interpretation, we treated education attainment as a continuous variable and used the number of formal schooling years as the dependent variable in the regression analysis. 11
Our investigation into Vietnamese American education took three steps. First, we provided descriptive statistics on education attainment by ethnic groups and generation status using the 1980, 1990, and 2000 censuses as well as the 2008–2012 ACS. Second, to shed light on how the parental education of current 1.5- and second-generation Vietnamese was distributed, we examined the level of parental education of Vietnamese children aged 5 to 18 in the 1990 census. This procedure of referencing the parental generation to assess intergenerational educational mobility is consistent with studies by Sakamoto and Woo (2007) as well as Park and Myers (2010). Last, we used multiple ordinary least squares regression to investigate how the number of schooling years varies across generational status and three ethnic groups on the basis of data derived from the 2008–2012 ACS. For the ordinary least squares regression, our key independent variables included aforementioned ethnic groups, generation status, and their interactions. Following conventional practice, we also included age as a continuous variable and dichotomous variables for whether the individual is a military veteran or has a disability. We did not include region, metropolitan status, or other geographic variables as controls because education might have been completed in the past before the values of those variables were ascertained in the cross-sectional data (Sakamoto et al. 2022; Takei et al. 2013). Additional analyses revealed that our results were consistent under a range of alternative model specifications and sample selection. 12 All our samples were weighted for descriptive analysis. For the regression analysis of the pooled ACS data, we took into consideration the complex survey design and included the survey year as an additional covariate.
Results
Descriptive Analyses
Table 1 presents first-generation sample sizes and weighted distribution for all three ethnic groups using the 1980 and 1990 censuses. Table 2 further breaks down by generational status using the 2000 census and the 2008–2012 ACS. Both tables show that among immigrants of Vietnam origin, ethnic Vietnamese were the numerical majority. However, with the sample size of the first generation ranging from 834 in 1980 to 5,403 around 2010, Chinese Vietnamese made up a sizable proportion of the Vietnamese population. Specifically, Table 1 shows that Chinese Vietnamese made a larger share of the total Vietnamese refugee population in the 1990 census (22.95 percent) than in the 1980 census (18.62 percent). This result is in line with the history of Vietnamese migration in that the first 1975 migration wave involved mostly ethnic Vietnamese, while Sino-Vietnamese did not start fleeing Vietnam on a large scale until 1979 (Desbarats 1985; Huntington 1988; Trieu 2009). Furthermore, Chinese Vietnamese constituted about 15 percent of the total Vietnamese population in both 2000 and around 2010. Table 2 also shows that both subgroups were still predominantly first-generation immigrants even in recent decades, while the 1.5 and second generations accounted for only about one quarter of the total Vietnamese population around 2010. The same pattern existed for Chinese Americans, though there were considerably more in every generation group. In line with their refugee status, younger generations of Vietnamese of either ethnicity were more likely than Chinese to be of 1.5 generation. Furthermore, young ethnic Chinese from Vietnam were even more likely to be of 1.5 generation than ethnic Vietnamese, a pattern likely to be related to differential arriving times of the two groups.
First-Generation Sample Sizes and Weighted Percentages by Ethnic Groups (1980 and 1990 Censuses).
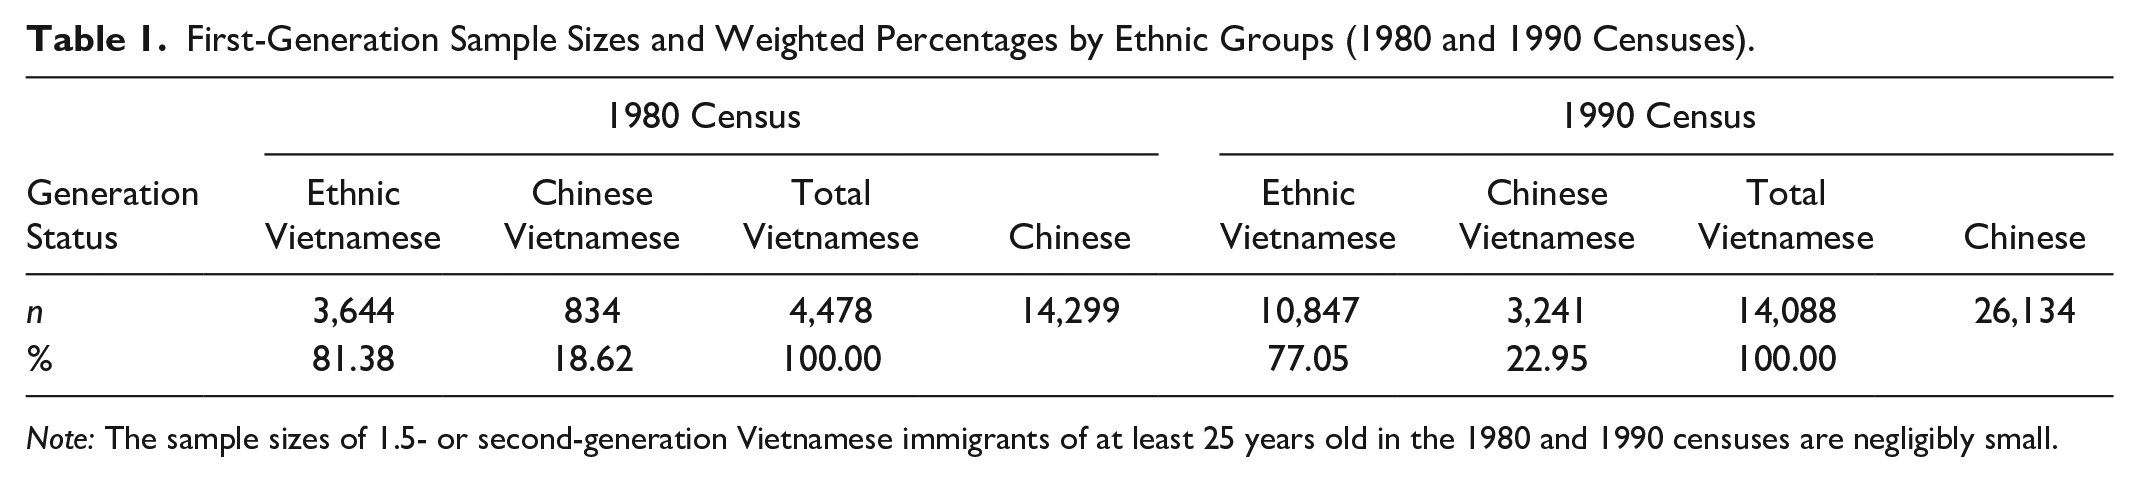
Note: The sample sizes of 1.5- or second-generation Vietnamese immigrants of at least 25 years old in the 1980 and 1990 censuses are negligibly small.
Sample Sizes and Weighted Percentages by Ethnic Groups and Generation Status (2000 Census and 2008–2012 ACS).

Note: ACS = American Community Survey.
Table 3 shows the weighted distribution of education levels of first-generation Vietnamese and Chinese immigrants in 1980 and 1990. These results indicate that upon arrival, Sino-Vietnamese had the least education among all three groups, ethnic Vietnamese had a clear education advantage over Sino-Vietnamese, and Chinese by far had the best education profile. For example, at least one third of first-generation Chinese attended college in 1980 and 1990, only 13 percent of ethnic Vietnamese attended college in 1980. In contrast, the percentage for Chinese Vietnamese was merely half of that: 6.5 percent. This pattern remained the same in 1990, but the gap became even wider; about 16 percent of ethnic Vietnamese had at least a college degree, compared with only 8 percent of Chinese Vietnamese being college educated. We also found that among first-generation immigrants, Chinese Vietnamese overrepresented at the lowest level of education category than Vietnamese, who were more similar to Chinese. In 1980 and 1990, almost three in five Chinese Vietnamese did not complete high school, while only about two in five ethnic Vietnamese and Chinese were in that category.
First-Generation Educational Attainment by Ethnic Groups (1980 and 1990 Census, Weighted Percentages).

Note: Education attainment of 1.5- and second-plus-generation Vietnamese immigrants in the 1980 census is not listed because of small sample sizes.
The difference between Chinese Vietnamese and ethnic Vietnamese is not statistically significant.
Table 4 summarizes the weighted distribution of educational attainment by ethnic groups and immigrant generation status using the 2000 census and the 2008–2012 ACS. The education pattern for the first generation remained the same in these two decades: Chinese being the most educated, followed by ethnic Vietnamese, and Sino-Vietnamese being the least educated. However, the 1.5- and second-generation Vietnamese, regardless of intranational ethnicity, appeared to start catching up with their Chinese counterparts in education achievement during this period. Their proportion of having a bachelor’s degree or higher exceeded 40 percent in 2000 and continued to go up and became greater than 50 percent around 2010. Moreover, Chinese Vietnamese seemed to make greater educational progress than ethnic Vietnamese. The 1.5- and second-generation Chinese Vietnamese quickly caught up with and eventually surpassed ethnic Vietnamese around 2010 in terms of the percentage of having at least a bachelor’s degree. Similar patterns were found at the other end of the education spectrum. In both the 2000 census and 2008–2012 ACS samples, 1.5- and second-generation Sino-Vietnamese exhibited a lower proportion of having a less than high school education than ethnic Vietnamese, approaching the level of Chinese.
Educational Attainment by Ethnic Groups and Immigrant Generational Status (2000 Census and 2008–2012 ACS, Weighted Percentages).

Note: ACS = American Community Survey.
Because of data limitation and the cross-sectional structure of censuses, we were unable to estimate how education varied among ethnic groups and different generations with parental education controlled. To gain more insights about the level of parental education of 1.5- and second-generation Vietnamese, we constructed two parental education variables, mother’s education and father’s education, 13 for a weighted sample of Vietnamese children between 5 and 18 years old in 1990. We extracted this sample from the 1990 census on the basis of the rationale that these children belonged to the same birth cohort of Vietnamese between 25 and 38 years old in 2010 and were most likely to be of 1.5 or second generation. Table 5 provides detailed descriptive statistics of the two parental education variables for this sample.
Maternal and Paternal Educational Attainment of Children Aged 5-18 (1990 Census, Weighted Percentages).

There are more missing values of paternal education than of maternal education for all three groups because, on the basis of our supplemental analysis, children living with single parents were more likely to live with their mothers than with their fathers, regardless of ethnic or national origin.
Table 5 shows that both parents of Sino-Vietnamese children had the worst education profile among all the three groups in 1990. Although only two in five Chinese mothers and about half of ethnic Vietnamese mothers did not complete high school, more than two thirds of Sino-Vietnamese mothers were in this category. Fathers’ education level also varied across groups tremendously. More than half of Sino-Vietnamese fathers did not have a high school education in 1990, compared with 31 percent of Vietnamese fathers and 27 percent of Chinese fathers. Furthermore, about 35 percent of Chinese father and 13 percent of Vietnamese fathers in our sample had at least a bachelor’s degree in 1990, compared with only 4.5 percent of Chinese Vietnamese fathers with a college degree. Because these parents were most likely of first-generation, our findings were in line with Tables 3 and 4. Taken together, the descriptive analyses provide a consistent pattern of how education levels vary among three ethnic groups over generations.
Regression Results
As described earlier, we also conducted multiple regression analysis using a sample of individuals who were at least 25 years old in the 2008–2012 ACS (the same sample for part of Tables 2 and 4). We regressed years of education on ethnic groups, generation status, and interactions of ethnicity and generation, with age, gender, veteran status, disability status, and survey year controlled. The results are displayed in Table 6.
Ordinary Least Squares Estimates for Educational Attainment (2008–2012 American Community Survey Weighted Sample, n = 138,433).

Note: Survey year is included. CI = confidence interval.
p < .001.
As expected, older age, being female, and being disabled were on average associated with fewer years of schooling. Being a veteran is positively associated with years of education for this largely foreign-born sample. In terms of generation status and ethnic groups, both their main effects and interaction terms were statistically significant when basic demographic variables are controlled, confirming substantial educational variability by these two dimensions. To better illustrate the interaction effects, we generated a bar graph (Figure 1) for predicted years of education by ethnic groups and generation status on the basis of the results in Table 6. Figure 1 shows that, among first-generation immigrants, both Vietnamese and Sino-Vietnamese have fewer schooling than Chinese. Adjusted for basic demographic variables, first-generation Chinese immigrants had an average of 14 years of education. Chinese Vietnamese were estimated to have only 10 years of schooling, at a significant disadvantage compared with Chinese and ethnic Vietnamese, who were estimated to have 11.5 years of education. However, the patterns became quite different for the later generations. Although younger generations of Vietnamese still had lower education achievement than their Chinese counterpart, there is no difference between 1.5-generation Chinese Vietnamese and ethnic Vietnamese. Both groups achieved an average of 13 years of education by 1.5 generation. In other words, not only Vietnamese as a group have made great strides in educational achievement quickly, but the initial gap between the two subgroups also disappears within one generation. Furthermore, consistent with the descriptive findings in Table 4, second-generation Chinese Vietnamese, although still lagging behind second-generation Chinese, seemed to have eventually surpassed their ethnic Vietnamese counterparts in terms of educational attainment. Their advantage appeared to be small, about half a year of schooling, but it reached statistical significance.

Predicted years of education by ethnic groups and generation status (2008–2012 American Community Survey).
Discussion and Conclusion
Ethnic Chinese were a historically distinctive minority group in Vietnam before the war. Compared with the majority Vietnamese, Sino-Vietnamese were different in their ethnic identity, community organization, culture, language, citizenship status and the relationship of their community to the larger macro structure of the Vietnamese society. They were also distinct from ethnic Vietnamese in their migration history to the United States and contexts of exit and reception. These distinctions make lumping Chinese Vietnamese and ethnic Vietnamese as a whole and comparing them with Chinese immigrants in the United States problematic. In attempt to disaggregate national origin and ethnicity, we made extensive use of several decades of census data and provided a thorough investigation of intranational ethnic education differences across generations.
Our results show a great deal of education heterogeneity and distinct adaptation trajectories within Vietnamese immigrants. Among the first generation, there is a significant Chinese Vietnamese disadvantage compared with ethnic Vietnamese. However, we observed remarkable progress and a quick convergence among the 1.5-generation Vietnamese Americans from both groups. Furthermore, the most recent data indicated that the educational attainment of second-generation Chinese Vietnamese slightly surpasses that of their ethnic Vietnamese counterparts and comes closer to the level of second-generation Chinese Americans, suggesting that Sino-Vietnamese may have the highest intergenerational mobility among all three groups.
Our findings bear significant implications for Asian American education studies. The detailed analyses based on nationally representative data confirm the previous findings about Chinese Vietnamese education disadvantage compared with ethnic Vietnamese. It is worth noting that we need to understand this disadvantage in light of the historical premigration context in Vietnam, where significant portions of the population were poor and uneducated. In other words, the contextualized differences between first-generation Sino-Vietnamese and ethnic Vietnamese may be more substantial in reality, indicating a larger disparity in their socioeconomic origins (Feliciano 2020). Our finding of educational advancement and a convergence between Vietnamese and Chinese among younger generations is largely in support of Lee and Zhou’s (2015) “second-generation convergence” phenomenon. More important, by breaking down Vietnamese into two separate intranational groups, we provided a closer look into this phenomenon and were able to obtain some interesting, nuanced details. Our results suggest that although both 1.5-generation Vietnamese subgroups seem to have equally contributed to the academic excellence observed at the group level, second-generation Chinese Vietnamese might contribute a tad more to the second-generation convergence than their Vietnamese counterparts. Overall, the educational progress of Vietnamese youth of Chinese ancestry appears to be more extraordinary despite their parents’ significantly lower educational levels.
Because of data limitations, we were unable to identify the mechanisms for the observed patterns in our study. However, our ancillary analyses show that Chinese Vietnamese have always had a distinctive residential pattern from ethnic Vietnamese since the 1980s, by being more likely to cluster in states with more Chinese coethnics such as California. This is consistent and an extension to Trieu’s (2009) finding that these two groups differ in their preferred locations of settlement within California. With common language, proximal residence, and similar appearance with Chinese immigrants, it is likely that Sino-Vietnamese receive more “spillover effects” than Vietnamese (Lee and Zhou 2015; Tran, Lee, and Huang 2019). This could lead to more positive influence on educational achievement of Chinese Vietnamese children, through both tangible resources such as various ethnic after-school programs and intangible resources such as cross-class networking (Lee and Zhou 2015). On the other side, our speculation is that Chinese Vietnamese attitudes toward education might have changed as a result of immigrant optimism (Kao and Tienda 1995). Back in Vietnam, ethnic Chinese were concentrated in business occupations. Their upward mobility was only through commerce, so education was not valued as much (Gold 1991). Once settled in the United States, Chinese Vietnamese may have recognized the availability of multiple career options for their children, especially the importance of obtaining upward mobility through high education (Caplan et al. 1991). Therefore, the change of attitudes toward education may be a result of selectively unpacking their values and beliefs, which have the origin in Confucianism but are also deeply rooted in contemporary social reality (Zhou 1997).
Our study also makes a crucial contribution to immigration and ethnic studies in general. Our results lend support to the intranational ethnicity perspective and add to the small body of literature on subethnic differences among immigrants. Our results clearly evidenced that differences between subgroups from the same country can be easily obscured in accounts that lump them as a whole. Compared with ethnic Vietnamese, Chinese Vietnamese had a more favorable context of reception because of their linguistic and cultural linkage with the preexisting Chinese communities in the United States. Their refugee status also entitled them to receive governmental and institutional assistance, to which most of Chinese immigrants did not have access. This double advantage in the context of reception may have uniquely shaped Chinese Vietnamese adaptation path, so their younger generations were able to overcome disadvantages more quickly and have higher educational achievement. This “mode of incorporation” provides a special case to shed light upon the structural explanations of “Asian American education paradox” (Lee and Zhou 2015; Portes and Rumbaut 2006), when ethnic origin is not equal to national origin. We suggest that researchers need to be particularly cautious and sensitive to ethnic origin when drawing general conclusions on the basis of national groups. Additionally, future research is needed to understand internal ethnic differences within other national origin groups. For example, in the U.S. context, such groups include indigenous groups from Mexico and other Latin American countries, ethnic Japanese from Brazil, and ethnic Indians from Caribbean and African countries. These studies can benefit from theoretical approaches that look at internal differences in premigration experiences and how they may have a potential impact on migration histories and differential adaptation outcomes in the host society. Useful perspectives include twice minority (Espiritu 1989; Gold 1991, 1994), internal ethnicity (Bozorgmehr 1997), and the related concept of “twice migrants” (Min 2013; Min and Kim 2009; Min and Park 2014). For the case of Chinese Vietnamese, it is likely that their twice-minority status has helped them form a more solid identity and draw resources from the established Chinese community, as twice-migrant Chinese typically exhibit a higher level of ethnic attachment than other twice-migrant groups (Min and Kim 2009; Min and Park 2014).
Methodologically, this study illustrates how ethnicity and national origin can be disentangled using large-scale data sets. Our novel approach of using census data to extract Chinese Vietnamese as a nationally representative group is valuable, which can be adopted for future studies on other immigrant groups with internal heterogeneity. We acknowledge, nevertheless, that this measure has limitations. We are aware the fluidity and context-dependent nature of ethnic identity and realize that respondents’ asserted identity may depart from our definition (Trieu 2009). However, our goal is not to construct superficial categories of difference but to “push for the recognition and understanding of existing difference” when direct identification of intranational ethnicity is not available (Trieu 2009). As previously noted, this scheme produces consistent Chinese Vietnamese categorization across generations, which offers some form of validity verification. In addition, the detailed coding of generation status used in conjuncture with our ethnic subgroup categorization proved to be useful. It allows us to capture the disappearance of education gap between Chinese Vietnamese and ethnic Vietnamese as early as in the 1.5 generation and then subsequently a slight Chinese Vietnamese advantage in the second generation.
Another limitation of our study concerns that ethnic identification could affect the results on educational achievement, especially among the second generation. For example, highly educated Chinese Vietnamese may prefer to identify themselves only as Chinese, which could introduce a downward bias in the findings about the educational differences between Chinese Vietnamese and ethnic Vietnamese. This selective identification presents a common challenge in studies about socioeconomic attainments among racial and ethnic groups, especially Hispanic and Asians (Duncan and Trejo 2017). Data limitations prevent us from more accurately assessing the relationship between educational attainment and ethnic identification, but our approach of using more objective indicators to identify Chinese Vietnamese might have attenuated some of the bias.
Despite the aforementioned limitations, our study is one step forward to a better understanding of education heterogeneity and intergenerational mobility among Vietnamese immigrants and their children. The case of Chinese Vietnamese serves as an important reminder that immigrants from the same country may have distinctive adjustment trajectories because of a variety of structural factors embedded in home countries. Thus, disaggregating national origin and ethnicity offers a fresh perspective on diversity among immigrants and their various adaptation in the host society.
Footnotes
Appendix
Detailed Coding Results for the Chinese Vietnamese Categorization.

| Category | 1980 Census | 1990 Census | 2000 Census | 2008–2012 ACS | ||||
|---|---|---|---|---|---|---|---|---|
| n | % | n | % | n | % | n | % | |
| 1b,d | 0 | .00 | 0 | .00 | 798 | 14.58 | 1,209 | 16.62 |
| 2c,d | 348 | 41.73 | 2,307 | 71.18 | 3,584 | 65.49 | 4,307 | 59.20 |
| 3 | 7 | .84 | 2 | .06 | 9 | .16 | 674 | 9.26 |
| 4 | 35 | 4.20 | 243 | 7.50 | 440 | 8.04 | 416 | 5.72 |
| 5c,d | 438 | 52.52 | 810 | 24.99 | 808 | 14.76 | 955 | 13.13 |
| 6 | 9 | 1.08 | 168 | 5.18 | 190 | 3.47 | 215 | 2.96 |
| 7 | 35 | 4.20 | 62 | 1.91 | 114 | 2.08 | 263 | 3.62 |
| 8 | 6 | .72 | 38 | 1.17 | 69 | 1.26 | 127 | 1.75 |
| 9 | 3 | .36 | 8 | .25 | 43 | .79 | 4,745 | 65.22 |
| 10c,d | 698 | 83.69 | 2,818 | 86.95 | 4,322 | 78.97 | 5,320 | 73.13 |
| 11 | 31 | 3.72 | 99 | 3.05 | 218 | 3.98 | 496 | 6.82 |
| 12 | 4 | .48 | 1 | .03 | 7 | .13 | 419 | 5.76 |
| 13 | 0 | .00 | 0 | .00 | 1 | .02 | 314 | 4.32 |
| 14 | 0 | .00 | 0 | .00 | 0 | .00 | 0 | .00 |
| 15 | 25 | 3.00 | 56 | 1.73 | 146 | 2.67 | 369 | 5.07 |
| 16 | 1 | .12 | 4 | .12 | 9 | .16 | 15 | .21 |
| 17 | 2 | .24 | 8 | .25 | 20 | .37 | 42 | .58 |
| 18 | 0 | .00 | 5 | .15 | 39 | .71 | 66 | .91 |
| 19 | 2 | .24 | 1 | .03 | 4 | .07 | 6 | .08 |
| Total | 834 | 100.00 | 3,241 | 100.00 | 5,473 | 100.00 | 7,275 | 100.00 |
Note: ACS = American Community Survey.
All the categories above are not mutually exclusive.
Category 1 is not available in the 1980 and 1990 censuses.
Categories 2, 5, and 10 cover 94.24 percent and 96.36 percent of the Chinese Vietnamese population in the 1980 and 1990 censuses, respectively.
Categories 1, 2, 5, and 10 cover 95.95 percent and 89.97 percent of the Chinese Vietnamese population in the 2000 and the 2008–2012 ACS, respectively.
Acknowledgements
We thank Dr. Min Zhou at the University of California, Los Angeles; Dr. Arthur Sakamoto at Texas A&M University; and the members of the Sociologists Talking about Population Health Workgroup at Rice University for their critical feedback on early manuscript drafts and warm encouragement.