
Abstract
In most stratification research, race is treated as a static and one-dimensional individual characteristic, though a growing literature indicates dynamic and multidimensional measures better represent experiences of racial categorization and inequality. The authors leverage such measures to explore the relationship between material hardship and racial reflected appraisals, or how people report being perceived by others. Results from the New York City Longitudinal Survey of Wellbeing are consistent with a bidirectional relationship: first, people who reported being seen as Black or Hispanic were significantly more likely to experience later material hardship, net of both racial self-identification and earlier hardship; second, people with hardship experience were significantly more likely to report been perceived as Hispanic and significantly less likely to report being perceived as White, no matter how they self-identified. These findings underscore the dynamics of racial categorization and highlight the utility of including reflected race measures in studies of inequality.
There is extensive research across the social sciences documenting the relationship between race and socioeconomic status in the United States, and persistent disparities in well-being for Black, Hispanic, and Indigenous Americans, are well known (e.g., Akee, Jones, and Porter 2019; Darity and Myers 1998; Fischer and Hout 2006). In such quantitative studies, race is most often based on self-identification, while socioeconomic status is often determined by an income-based measure of poverty, and both tend to be recorded for a given individual at a single point in time. Yet a growing body of work suggests more nuanced approaches to measuring race and socioeconomic well-being in surveys can help social scientists better understand entrenched racial disparities.
Recently, scholars of both race and inequality have stressed the need to employ measures that capture patterns and processes that are not visible using unidimensional, cross-sectional items alone (e.g., Iceland and Bauman 2007; Roth 2016). 1 Multidimensional measures of race include aspects beyond self-identification, such as phenotype or ancestry. Multidimensional measures of socioeconomic status include aspects of poverty beyond the federally defined income threshold, such as not being able to pay bills or achieve a middle-class standard of living. A dynamic approach integrates repeated measures to capture changes over time or differences in duration and patterns of exposure, as racial categorization varies across the life course (Liebler et al. 2017; Saperstein and Penner 2012) and households move in and out of economic hardship (Finnigan and Meagher 2019). These lines of research on the utility of incorporating multidimensional and dynamic measures for race and socioeconomic well-being have developed largely independently, though the resulting research recommendations are analogous.
This study combines insights from these two areas of scholarship to explore the dynamic relationship between a person’s racial categorization and their socioeconomic well-being. We draw on unique longitudinal survey data to explore time-ordered relationships between two less studied dimensions of race and socioeconomic well-being: racial reflected appraisals and material hardship. Specifically, we examine (1) the predictors of future material hardship, accounting for both self-identified and reflected appraisal measures of race and (2) whether racial reflected appraisals—or people’s reports of how strangers perceive their race—are shaped in part by their past experiences with material hardship. We find that, even among people who self-identify their race similarly, racial reflected appraisals predict material hardship three months later. For example, all else being equal, people who report they are seen as Black or Hispanic have significantly greater odds of future material hardship compared with people who report they are seen as White. We also find that people are significantly less likely to say that strangers perceive them as White if they experienced hardship in the past and more likely to say that strangers perceive them as Hispanic. 2
These results suggest studies that rely on standard, cross-sectional measures of race and material hardship are missing notable sources of variation in outcomes. Analyzing these relationships with longitudinal data also allows us to hypothesize about and provide suggestive evidence of mechanisms and processes linking racial categorization to inequality. For example, in contrast to theorizing racial inequality from a “deficit” perspective (see Hunter and Robinson 2016 for a review), the association we observe between people’s perceptions of how they are seen by others and their odds of experiencing future hardship highlights the relational role of racialized appearance in perpetuating disparities. If the reverse is also true—that previous economic hardship influences how people report they are seen by others—then our data provides further evidence of a vicious cycle in which perceptions of race and experiences of racial inequality are inextricably intertwined (Saperstein and Penner 2012).
Multidimensional and Dynamic Measurement of Race
Most research on race continues to conceptualize it as a single, static characteristic, despite a growing body of research providing evidence that racial categorization occurs along multiple dimensions that can vary at the same point in time and change both over time and across an individual’s life course (for reviews, see Roth 2016; Vargas and Kingsbury 2016). Historically, U.S. surveys often relied on interviewers to racially classify respondents, whereas contemporary data collection generally follows federal guidelines in favoring how respondents describe themselves (Office of Management and Budget 1997). In Roth’s (2016) typology of the multiple dimensions of race, the former is observed race, or the racial categories that are externally ascribed to an individual, while the latter is an individual’s racial self-identification, or the racial categories they choose for themselves. A third dimension of race and one that features prominently in our analysis is reflected race, or how an individual perceives others classify them. 3
Although these dimensions of race are often conflated, they are analytically distinct. For example, in the first study of this kind, Telles and Lim (1998) compared measures of income inequality in Brazil using racial self-identification and observed race. Not only was racial categorization on these dimensions sometimes inconsistent (e.g., 20 percent of people classified by interviewers as Black self-identified as Brown) but analyses of Black-Brown income inequality indicated a larger disparity when using observed race compared with self-identified race. Other studies have shown similar, though smaller, differences between self-identification and observed race in the United States (e.g., Saperstein 2006).
Reflected race is less commonly measured and has yet to be included in prominent nationally representative surveys. 4 Qualitative case studies have explored how racial reflected appraisals shape racial self-identification among the children of interracial couples (Khanna 2004, 2010), and demonstrated that reflected race is distinct from both self-identification and the actual perceptions of others (Roth 2010). The limited survey research to date finds discordance between reflected race and self-identification across all monoracial self-identifiers, with the highest rates for Hispanic Americans, followed by Asians, Blacks, and Whites (Vargas and Kingsbury 2016). The presence of such discordance (e.g., a person who self-identifies as multiracial, is classified by others as Black, but reports that others see them as Hispanic) poses a challenge for research on race and inequality that can only be resolved with multidimensional measures.
Different measures of race not only affect who gets counted as “White,” “Black,” or “Hispanic” (and thus how large racial disparities might be) but also imply different causal mechanisms in inequality-producing processes. For example, Telles (2002) argued that observed race is a more appropriate measure than self-identification for studies of racial inequality because it is more closely related to experiences of appearance-based discrimination. Measuring these distinct dimensions repeatedly over time can help scholars dig deeper into patterns of racial inequality. Saperstein, Kizer, and Penner (2016) found that members of the National Longitudinal Study of Adolescent to Adult Health cohort were less likely to own their home if they were seen as Black as young adults but did not self-identify as Black; yet they found no such association for people who self-identified as Black as young adults but were not seen as Black. This suggests that the observed race dimension may better capture the type of discrimination people experience in their search for housing than a person’s subjective sense of group membership. It also supports the claim that different measures of race are capturing different aspects of how race comes to matter in people’s lives.
Several cross-sectional studies demonstrate that reflected race is linked to socioeconomic and general well-being. These findings suggest that a dynamic approach that incorporates reflected appraisals alongside other dimensions of race may yield valuable insight. For instance, Vargas (2015) found that although most people reporting a Hispanic origin racially self-identified as White, few thought they were perceived as White by others; further, socioeconomic factors, such as education and income, were positively associated with reporting White appraisals, suggesting the ability of money to “whiten” some Hispanic Americans. Similarly, White appraisals are generally associated with better self-reported health among those who self-identified similarly (Campbell and Troyer 2011; Jones et al. 2008; Stepanikova 2010; White et al. 2020). As people reflect on how they are perceived and treated by others, those with higher socioeconomic status and better health believe other people are more likely to see them as White, regardless of how they self-identify. Taken together, these findings illustrate how patterns of racial inequality—and the continued association of whiteness with privilege and advantage in the United States—can be better captured using multiple dimensions of race, repeatedly over time, rather than by a single self-identification measure.
Multidimensional and Dynamic Measurement of Hardship
Similar to the overreliance on racial self-identification in studies of racial disparities, measures of income are often the focus of studies of socioeconomic well-being. Income-based measures have been the foundation for such studies in the United States, in part because of the dominance of income-based thresholds for measuring poverty. The official federal poverty line is an income-based threshold, developed in the 1960s and set to equal three times the cost of a subsistence diet (Blank 2008). The limitations of this threshold have compounded with time and have been the focus of numerous critiques (Blank 2008; Citro and Michael 1995), yet the federal poverty measure has changed little since its initial development (though see Haveman et al. 2014).
Partly in response, and building on the foundational work of Mayer and Jencks (1989), a growing number of scholars advocate for alternative approaches to measuring socioeconomic well-being (see Iceland and Bauman 2007; Schenck-Fontaine and Panico 2019; Tucker-Seeley, Marshall, and Yang 2016). As Desmond (2015) argued, though poverty is traditionally defined in terms of a person’s relationship to a threshold, “there are many depths below the poverty line” (p. 2). In addition to the degree of scarcity in material resources, poverty experiences can vary by the number and types of adversities experienced. These forms of deprivation, although correlated with income, are substantively different than income poverty. For example, certain types of deprivation, such as housing insufficiency, can place individuals at risk for hardship beyond what they would face as a result of income shortfalls alone (Citro and Michael 1995). Therefore, measures of social, material, and psychological deprivation can provide a more detailed description of experiences in poverty.
One such measure of deprivation is material hardship. Material hardship is the degree to which individuals can meet basic needs for survival and typically relates to food insecurity, housing instability, having one’s utilities cutoff, and access to medical help (Ouellette et al. 2004). Material hardship is correlated with income poverty, but the relationship is not one to one (Heflin 2006; Short 2005; Sullivan, Turner, and Danziger 2008). Although some scholars have argued this lack of correspondence suggests income poverty is being measured poorly, this evidence is also consistent with material hardship measures capturing aspects of poverty that income-based measures alone cannot (Short 2005). Material hardship is a more direct measure of deprivation than income or poverty and may also capture other aspects of disadvantage. For example, Iceland and Bauman (2007) found that even short periods of poverty are associated with intensified material deprivation and that poverty does not relate to all types of deprivation equally. This suggests that hardship measures are not simply better at capturing the experience of poverty but also account for a multiplicity of disadvantage.
More recently, as access to longitudinal data expands, scholars have incorporated dynamic approaches to better understand the extent to which socioeconomic advantage and disadvantage persist over the life course and across generations. For example, several studies have shown that Black Americans are significantly more likely than White Americans to experience persistent disadvantage and material hardship (Neckerman et al. 2016; Perkins and Sampson 2015). This relationship remains even after controlling for other predictors of hardship, such as education. Neckerman et al. (2016) found that at a given point in time, about two thirds of Black and Hispanic families experience either income poverty, material hardship, or health problems relative to just one third of White families; furthermore, Black and Hispanic families are more likely to experience persistent disadvantage than otherwise similar White families. Although these findings mirror the racial disparities found in cross-sectional data, persistent disadvantage and material hardship imply broader and deeper challenges for ameliorating racial inequality (see, e.g., Chetty et al. 2018). Thus, much like multiple measures of race measured over time can offer additional information about processes of racial categorization, different dimensions of socioeconomic well-being measured over time offer deeper insight into the social experience of material deprivation.
Uniting Multidimensional and Dynamic Perspectives of Race and Socioeconomic Status
This analysis brings together best-practice approaches to measuring race and socioeconomic status by exploring the dynamic relationship between reflected race and material hardship. Given previous research, we theorize that racial reflected appraisals and well-being are linked through two main pathways of mechanisms. First, reflected race, like observed race, may be a better proxy for phenotype or appearance-based discrimination than self-identification. At the same time, reflected race could be distinct from observed race in that it refers to how a person perceives they are classified by others. In this way, racial reflected appraisals would be connected not only to physical appearance but also to feelings of “othering,” or relative social status. We cannot examine these two mechanisms directly with our data but, in either case, we would expect to find that reflected race is a useful predictor for studies of inequality above and beyond standard measures of self-identification.
Thus, we begin by exploring whether reflected race offers more information, or a better statistical “fit,” when predicting variation in material hardship, compared with standard measures of racial self-identification. If differences in physical appearance drive discriminatory treatment and if reflected appraisals better capture phenotype than self-identification, then reflected race should be a better measure of hardship caused by appearance-based discrimination. For example, people who do not identify as White but report that others perceive them as White may have lighter complexions and experience less racial discrimination, leading to more positive socioeconomic outcomes. Given previous research demonstrating racial disparities in persistent hardship, as well as work showing that reflected race is associated with socioeconomic status, we expect that people who report that others view them as Black or Hispanic will have greater odds of experiencing future hardship than people who report that others view them as White, even when they self-identify similarly.
If reflected race is capturing not only physical appearance but also a person’s sense of relative status, then we would expect it to be influenced by previous hardship, in addition to being a better predictor of current or future hardship. For example, Saperstein and Penner (2012) found that survey interviewers are less likely to classify respondents as White, and more likely to classify them as Black, after the respondents experienced downward mobility, such as a long spell of unemployment. A similar process could operate for racial reflected appraisals: people who experience material deprivation would be more likely to report lower status racial appraisals. This might occur if experiences of disadvantage trigger stereotypical expectations about group membership. For example, a person who interacts regularly with social services agencies such as food pantries or shelters may notice the racial composition of other people receiving services or perceive racial stereotyping by organization staff. As a result of these interactions, people who self-identify similarly, and perhaps even have similar physical characteristics, might report differing racial reflected appraisals when they differ in hardship experience.
Therefore, we also explore how previous hardship experiences are related to reflected race. We hypothesize that people who experience persistent material hardship will be more likely to report lower status racial appraisals, such as Hispanic or Black. In contrast, people who do not experience consistent hardship will be more likely to report higher status racial appraisals, such as White. This implies the reverse of the typical relationship between race and inequality: not only can racial perceptions influence future socioeconomic experiences, but experiences of disadvantage may also shape racial perceptions. Although we cannot provide direct causal evidence of these potential mechanisms, the presence of both reflected race and self-identification measures as well as their time ordering with repeated measures of material hardship allow a novel opportunity to explore the potential for a bidirectional relationship between reflected race and socioeconomic well-being. 5
Data and Methods
For this analysis, we use data from the first panel of the New York City Longitudinal Survey of Wellbeing (NYC-LSW), conducted by the Columbia Population Research Center and the Robin Hood Foundation (2016). The NYC-LSW began in December 2012 with a panel of approximately 2,300 households that were followed over the course of two years. The selected respondent from each household was interviewed every three months during the survey period for a total of eight survey waves. This representative sample of New York City residents was recruited primarily through random digit dialing of cell phones and landlines, though residents in poor neighborhoods and neighborhoods affected by Hurricane Sandy were oversampled (Wimer et al. 2014). Oversampling these populations, in part by using Robin Hood Foundation agency referrals, means the survey includes people who tend to be difficult to reach, such as those who do not have landlines because of homelessness. With more socioeconomic and racial diversity than most U.S. household surveys, the NYC-LSW is uniquely suited to study the dynamic relationship between reflected race and material hardship.
Multiple Measures of Race
NYC-LSW collected two types of racial categorization data: reflected race and self-identification. Self-identification was measured at two points in time, in the baseline survey and again at wave 7. Reflected race was added in wave 7. With these data, we can compare the reflected race measure to either self-identification measure alone, as well as to a measure that captures change in self-identification over time. If reflected race outperforms both static and dynamic self-identification that would provide stronger evidence that racial reflected appraisals offer unique information above and beyond racial identification, including knowing whether a person’s identity was fluid or complex.
Racial self-identification and Hispanic origin were measured using similar question wording and answer options at both time points. Respondents were asked, “Are you of Hispanic origin?” and “What is your race?” and were instructed to select all that apply from the following racial categories: “White or Caucasian,” “Black or African American,” “Asian,” “American Indian or Alaska Native,” “Native Hawaiian and Other Pacific Islander,” or “something else.” If respondents chose “something else,” they were asked to write in a response. 6 For racial self-identification at both points in time, the majority of respondents who chose “something else” wrote in answers that could be classified as Hispanic. See the Online Appendix for a detailed discussion of how we (re)coded these responses.
After recoding write-in responses, we constructed (1) a static, mutually exclusive measure for each wave and (2) a dynamic measure of racial self-identification. The static measure is similar to what is traditionally reported: it captures whether a respondent identified at a given point in time as White, Black, Hispanic, any other single race, or selected multiple races. The dynamic measure represents whether a respondent “always” (i.e., in baseline and wave 7), “ever” (in either wave), or “never” selected a given response. We use these dynamic categories to account for changes in self-identification among the three largest categories: White (baseline n = 480), Black (baseline n = 398) and Hispanic (baseline n = 252). 7 About 10 percent of the sample self-identified differently between the two points in time. A cross-tabulation of the static self-identification measures from baseline and wave 7 is shown in the Online Appendix (see Table A2).
The reflected race measure was included in wave 7 immediately following the standard self-identification questions. 8 The reflected race question asked, “How would most people in this country describe you, for example if they walked past you on the street?” 9 The answer options for reflected race were the same as the racial self-identification question, and respondents could select more than one response. Unlike the self-identification measure, Hispanic origin was not explicitly assessed in a separate question. Nevertheless, much as research finds for self-identified race (Brown et al. 2006; Vargas 2015), many respondents wrote in Hispanic reflected appraisals because “Hispanic, Latino or Spanish” was not provided among the explicit list of answers. Of the 194 respondents who checked “something else,” 147 wrote in Hispanic origin responses for the appraisal question (e.g., “Hispanic,” “Latino,” “Dominican”). We combine these reflected race responses in an “Hispanic” category for the purpose of our analysis and construct mutually exclusive measures of reflected race following the same logic as the racial self-identification question.
Table 1 shows cross-tabulations of reflected race and dynamic self-identification in our analytic sample, following the coding rules described above. From this table, we see that there are no empty cells for any of the comparisons, indicating variation between all categories of dynamic racial self-identification and reflected race. For example, four percent of people who never self-identify as Hispanic report a Hispanic appraisal, and 56 percent of people who always self-identify as Hispanic report a non-Hispanic reflected race. This pattern is broadly consistent with previous literature that documents racial contestation among those who self-identify as Hispanic (e.g., Vargas and Stainback 2015), though the proportion of people with “matching” self-identification and reflected race likely would have been higher had “Hispanic” been offered as an explicit answer option. 10 We also see that seven percent of people who always self-identify as White nevertheless report a non-White reflected race, while 12 percent of people who always self-identify as Black report a non-Black reflected race; that the latter proportion is larger runs counter to expectations on the basis of the history of the “one-drop rule.”
Reflected Race and Dynamic Self-Identification.

Source: New York City Longitudinal Survey of Wellbeing, Panel 1.
Note: Row percentages are shown, with n in parentheses; total n = 1,054. All cases are included in each paired comparison. Reflected race was measured at wave 7, while dynamic racial self-identification combines measures from two waves, such that “always” represents reporting the given category in both the baseline survey and wave 7, “ever” represents reporting the given category in one wave or the other but not both, and “never” represents not reporting the given category in either wave.
We provide a cross-tabulation of respondents’ reflected race and self-identification using only their wave 7 responses to allow comparison with previous cross-sectional surveys that collect reflected race and self-identification at just one point in time (see Table A3). As in previous studies (e.g., Vargas and Kingsbury 2016), we find some discordance between measures across all categories, with the lowest levels for “White” and “Black” (both 100 percent – 84 percent = 16 percent) and the highest levels for “other” (100 percent – 61 percent = 39 percent) and “Hispanic” (100 percent – 72 percent = 28 percent).
Measuring Material Hardship
NYC-LSW also collected multidimensional and dynamic socioeconomic data, including a series of questions about material hardship experiences that were asked consistently in every wave from baseline through wave 8. 11 Following the recommendations of previous research (Ouellette et al. 2004), we chose questions that most directly assessed the individual’s ability to meet absolute basic needs in order to construct a measure of hardship. The four questions we included assessed the following: (1) how often the respondent worried that food would run out before there was money to buy more; (2) whether the respondent had stayed in a shelter or another place not meant for regular housing; (3) whether utilities such as gas, oil, or electricity had been shut off; and (4) whether the respondent or anyone in the household had to forgo a doctor or dentist visit because of cost. 12 If the respondent answered often, sometimes, or yes to any of these questions, we coded them as experiencing material hardship in that wave.
For analyses of future hardship, we use a binary indicator of whether the respondent reported experiencing any hardship in wave 8. Our dynamic measure of hardship is analogous to our dynamic measure of racial identification and distinguishes respondents who “always,” “ever,” or “never” reported experiencing hardship. Those coded “ever” reported hardship in at least one wave, while respondents coded “always” reported hardship in all waves in which they were observed. We chose this strategy because it does not require that respondents have complete data in all eight survey waves. 13
Cross-tabulations of dynamic hardship and reflected race are shown in Table 2. Those always observed in hardship are most likely to report a Black reflected race (44 percent) followed by Hispanic (23 percent) and White (18 percent). The distinction between persistent and intermittent hardship is also related to reflected race: 23 percent of respondents always in hardship report a Hispanic reflected race, but that proportion falls to 16 percent when we examine respondents only in hardship intermittently. The reverse pattern is true for White appraisals, where 18 percent of respondents always in hardship report a White reflected race versus 33 percent of respondents only sometimes in hardship. This descriptive comparison echoes familiar patterns of racial inequality found using racial self-identification.
Reflected Race and Dynamic Hardship.

Source: New York City Longitudinal Survey of Wellbeing, Panel 1.
Note: Row percentages are shown, with n in parentheses; total n = 1,054. All cases are included in each paired comparison. Reflected race was measured at wave 7, while dynamic hardship combines measures from the baseline survey through wave 7, inclusive, such that “always” represents reporting hardship in every survey wave, “ever” represents reporting hardship in at least one survey wave, and “never” represents not reporting hardship in any survey wave.
Models
The most novel aspect of our analysis explores time ordering in the relationship between a person’s reflected race and their experiences with material hardship. However, because reflected race is not a common measure in studies of racial inequality, we begin by demonstrating that reflected race can be distinguished empirically from racial self-identification in our sample. We do this in several steps, beyond simply providing cross-tabulations of the two measures in Table 1. First, we estimate a series of logistic regressions predicting the experience of material hardship in wave 8, controlling for having experienced material hardship in wave 7. 14 Each regression includes a different mutually exclusive measure of race: (1) baseline self-identification, (2) wave 7 self-identification, and (3) wave 7 reflected race. Then, we examine the multiple measures of race simultaneously, factoring in change over time in self-identification. 15
Once we demonstrate that reflected race is a significant predictor of future hardship, net of self-identification, we explore the possibility of reverse causality: that previous experiences of hardship are associated with reflected race. We do this by predicting Hispanic, Black, and White appraisals in a series of separate logistic regressions, controlling for experiences of material hardship between baseline and wave 7, self-identification, and other demographic factors. 16
Our demographic controls include gender, age, educational attainment, nativity, parental status, survey language, residence in New York City during the relevant survey wave, and recent travel to one’s home country (if not the United States). 17 We include whether respondents were born in the United States and whether they ever completed the survey in Spanish because we expect immigrant status and English proficiency to be related to both perceptions of race and experiences of hardship. We include recent travel in case the differing conceptions of race in one’s home country influence self-identification or reflected race (Roth 2012). Educational attainment, parental status, age, and gender are all based on self-reports at baseline. Education is a binary indicator for having received at least a bachelor’s degree by baseline.
Limitations
Although the design of the NYC-LSW creates a unique opportunity to construct both multidimensional and dynamic measures of socioeconomic status and race, there are several limitations to our study. First, to appear in our sample, respondents had to have valid data on all measures of race and measures of material hardship from at least three waves: baseline, wave 7, and wave 8. 18 The resulting analytical sample includes 1,054 people. T tests comparing baseline characteristics of respondents who were lost to follow-up to people who were retained in the analytical sample show that the former are significantly more likely to report experiencing hardship at baseline, more likely to identify as Hispanic, less likely to identify as White or Black, less likely to have a bachelor’s degree, less likely to be born in the United States, and less likely to be female.
As attrition is positively associated with baseline hardship experiences, our estimates may be downwardly biased because fewer people in hardship are retained in our analytical sample. If we expect that respondents with baseline hardship experiences are more likely to differ in reflected race from their otherwise similar peers who were not in hardship (i.e., people who are in hardship and identify as Hispanic would be more likely to report Hispanic appraisals than people who identify as Hispanic but were not in hardship), our estimates should be conservative. Unfortunately, we cannot conduct explicit tests or corrections for attrition bias because we do not have a measure of reflected race for respondents who leave the sample before wave 7.
Second, we acknowledge that New York City is not representative of the United States as a whole and that the relationship we reveal between reflected race and material hardship might not apply to other places or times. Furthermore, as our focus is not on generalizability per se but on better understanding the complex relationship between reflected race and material hardship, we opted not to present weighted results and instead include many of the factors used to create the weights as controls. The NYC-LSW survey weights are only available for 1,019 respondents in our analytic sample. They include baseline racial self-identification in their calculation, which is counterproductive for our purposes. Nevertheless, weighted analyses yield substantively similar results (available upon request); when the weighted estimates are not statistically significant, they remain in the same direction and are within the confidence intervals of the results reported here.
Last, there are some limitations to the NYC-LSW race measures. Although the two measures of self-identification are very similar, ideally the question wordings and answer options would have been identical. The only major survey to date that includes repeated racial self-identification with identical question wording and answer options is the multi-year panel in the General Social Survey (which does not include a reflected race measure). Reflected race ideally would be asked at multiple points in time along with racial self-identification. Unfortunately, reflected race is only asked once in wave 7, so we cannot leverage models with person fixed effects to make stronger claims about the relationship between reflected race and experiences of material hardship. The number of respondents who wrote in “Hispanic” responses for reflected race also suggests that future measures should explicitly include “Hispanic” among the answer options to better represent how people perceive others see them. Despite these limitations, our analytic approach and the dynamic measures we do have allow us to uncover important initial evidence of a reciprocal relationship between how people report being perceived racially and their experiences of material hardship.
Results
Although multiple measures of race are theoretically distinct, and responses can change over time and across contexts, the various measures might not always be statistically distinguishable from one another. We begin our analysis by exploring whether the measures of race available in the NYC-LSW yield different results when predicting reported experiences of material hardship in wave 8. Table 3 shows estimates from basic models that only account for the given measure of race (noted in the column heading), whether race responses were write-ins, and previous experience of hardship. We include a control for previous hardship (reported in wave 7) to highlight whether any of the race measures are associated with reporting future hardship even after accounting for having been in hardship in the past, as expected on the basis of previous research (Neckerman et al. 2016; Perkins and Sampson 2015).
Comparison of Different Race Measures Predicting Future Hardship.

Source: New York City Longitudinal Survey of Wellbeing, Panel 1.
Note: Logistic regressions predicting reported hardship in wave 8. “Other” is a residual racial category that includes people who chose the Asian, American Indian, and Native Hawaiian or Pacific Islander preset responses, wrote in any of those categories, or wrote in responses not elsewhere classified. An indicator for write-in responses is included as a control but not shown. AIC = Akaike information criterion; BIC = Bayesian information criterion; OR = odds ratio.
p < .10. *p < .05. **p < .01. ***p < .001.
The first finding to note in Table 3 is that the two measures of self-identification, one from the baseline survey and one assessed in wave 7, provide similar results in terms of racial disparities in hardship. 19 The two measures capture different members of the various racial populations, as people both join and leave categories over time (see also Liebler et al. 2017). These estimates suggest that despite inflows and outflows, the direction of the association between race and material hardship changes little, particularly for the two largest categories shown: respondents who identify as Black alone or Hispanic. 20 People who identify as Hispanic in either wave are more likely (1.8 or 1.7 times, respectively) to experience new or persistent hardship, compared with people who have similar recent hardship experiences but identify as White. People who identify as Black in either wave are also more likely to report hardship in wave 8, though the odds ratios do not reach a conventional level of significance (p = .10 and p = .07, respectively).
When we account for reflected race instead of self-identification, the substantive conclusions remain similar, but there is clearer evidence that people who report being perceived as Black or Hispanic are more likely to experience difficulty meeting basic needs three months later, relative to people who had similar experiences with recent hardship but report others view them as White. Both odds ratios are greater than one and statistically significant at conventional levels (Table 3, model 3). The model estimates using reflected race also provide slightly better fit, according to both the Akaike information criterion and Bayesian information criterion fit statistics. This indicates reflected race accounts for more of the variation in hardship experiences in this sample than measures of racial identification recorded at a single point in time.
Predicting Material Hardship with Multiple Measures of Race
The evidence that reflected race better captures observed differences in experiences of material hardship presented in Table 3 is positive but not particularly strong. We further investigate the relationship between the various measures of race by including them simultaneously in the same model predicting future hardship (cf. Saperstein et al. 2016). This analysis is presented in Table 4. The results should be interpreted cautiously because of the empirical overlap between the race measures. 21 However, the substantive conclusions do not change across the various model specifications, and the odds ratios are stable, despite changes in the number and types of controls included, which increases our confidence in the main findings.
Logistic Regressions Predicting Future Hardship with Reflected Race, Net of Racial Self-Identification.

Source: New York City Longitudinal Survey of Wellbeing, Panel 1.
Note: Coefficients are odds ratios (ORs). Controls for write-in responses are included in all models. Additional controls for gender, age, educational attainment, baseline parental status, wave 8 New York City residence, nativity, taking the survey in Spanish, recent travel to home country (if not United States), and missing data indicators are included in models 2 through 4, but not shown.
p < .10. *p < .05. ***p < .001.
The relationships identified in Table 3—that people who report others see them as Black or Hispanic are significantly more likely to experience future hardship than people who report others see them as White—carry over to Table 4. These results remain consistent in direction and significance as we introduce demographic controls also associated with experiencing persistent hardship (such as gender, age, and educational attainment), and account for changes in self-identification over time. The association between Black appraisals and future hardship is at least marginally statistically significant across all four models and indicates that people who report strangers perceive them as Black are between 2.4 and 3.2 times more likely to experience future hardship than otherwise similar people who strangers perceive as White. 22 A Hispanic appraisal is also associated with greater odds of future hardship, between 2.4 and 2.7 times the odds estimated for an otherwise similar person who reports a White appraisal.
The other noteworthy finding implied by the results in Tables 3 and 4 is that the relationship between reflected race and future hardship is not attributable to other measured factors, including self-identification. As would be expected, past experiences with hardship are the strongest predictor of future hardship. Also, like Neckerman et al. (2016), who use the same data set to study hardship among families with children, we find that people with college degrees are less likely than those with less than a college education to experience future or persistent material hardship, all else being equal (estimates not shown). More surprising is the absence of a statistically significant relationship between racial self-identification and material hardship. Previous research often finds that multiple measures of race complement rather than supersede one another (e.g., Bailey, Saperstein, and Penner 2014; Saperstein et al. 2016). However, in this sample, and for this particular outcome, reflected race seems to be capturing disparities better than even a dynamic measure of self-identification.
That said, we do not want to imply that sociologists or inequality scholars should simply replace self-identification with reflected race in their research. The greater specificity and explicit decision criteria provided in the reflected race question makes it a clearer and more concrete question than the typical vaguely worded “What is your race?” self-identification, but reflected race should not be considered a more objective measure of race (or even racialized appearance) than any other. To underscore this, we reverse our lens on race and inequality by moving reflected race to the left-hand side of our regression equation and asking whether previous experiences of material hardship might also inform the race responses people give when asked how others perceive them.
Predicting Reflected Race
Table 5 shows results from a series of logistic regression models predicting reflected race separately for Hispanic, Black, and White appraisals. All models control for racial self-identification, using either a static measure (models 1 and 2) or our dynamic measure (models 3, 4, and 5). The first model for Hispanic appraisals includes wave 7 racial self-identification and our demographic controls. The second model adds our measure of dynamic material hardship as a predictor, and the third incorporates dynamic self-identification. Given the similarity in hardship estimates regardless of how we code our self-identification controls for the Hispanic models, we present one model each predicting Black and White appraisals that acknowledges fluidity in racial self-identification. 23
Logistic Regressions Predicting Reflected Race with Dynamic Hardship Experiences, Net of Racial Self-Identification.

Source: New York City Longitudinal Survey of Wellbeing, Panel 1.
Note: Coefficients are odds ratios (ORs). Dynamic hardship measures account for responses from baseline through wave 7, inclusive. Controls not shown (gender, age, parental status, New York City residence in wave 7, recent travel to one’s home country, and college education) were not significant at conventional levels. Write-in response indicators and missing data indicators also not shown.
p < .10. *p < .05. **p < .01. ***p < .001.
The results provide clear evidence that past hardship predicts Hispanic appraisals. The odds ratios in columns two and three indicate that people who previously had difficulty meeting basic needs are more than two times as likely to report being perceived as Hispanic, compared with all other possible reflected race responses. This remains the case even after controlling for changes in self-identification. Unsurprisingly, people who always or sometimes identify as Hispanic are significantly more likely to say others see them as Hispanic than people who never identify that way. But the association between previous hardship and reporting a Hispanic appraisal is positive and significant above and beyond the association with self-identification.
The estimates from model 5 in Table 5 indicate that people who have had recent difficulty meeting basic needs are less likely to report being perceived as White, with the largest and most significant drop in odds observed for those who experienced hardship consistently across survey waves. The positive association between racial self-identification and reflected race is also notable in predicting White appraisals, with people who always identify as White almost uniformly saying that others perceive them the same way.
Given the challenges of interpreting magnitudes with logistic regressions, we compare predicted probabilities adjusted for multiple comparisons for a hypothetical modal respondent: a childless woman of average age who was born in the United States, has no college degree, never self-identified as Hispanic, had no write-in race responses, was never interviewed in Spanish, and lived in New York City at the time of the wave 7 survey (see Figure 1). From this figure, we can see that people who do not consistently identify as White (i.e., those who are “ever White”) exhibit the most dramatic decrease in their predicted probability of reporting a White appraisal with greater experience of material hardship. The negative association with hardship is also present for those who never and always identify as White, despite their much lower and higher starting probabilities of saying others see them as White, respectively. As Figure 1 illustrates, the strength of the association between how people identify and how they report others perceive them can shift depending on factors such as previous hardship.
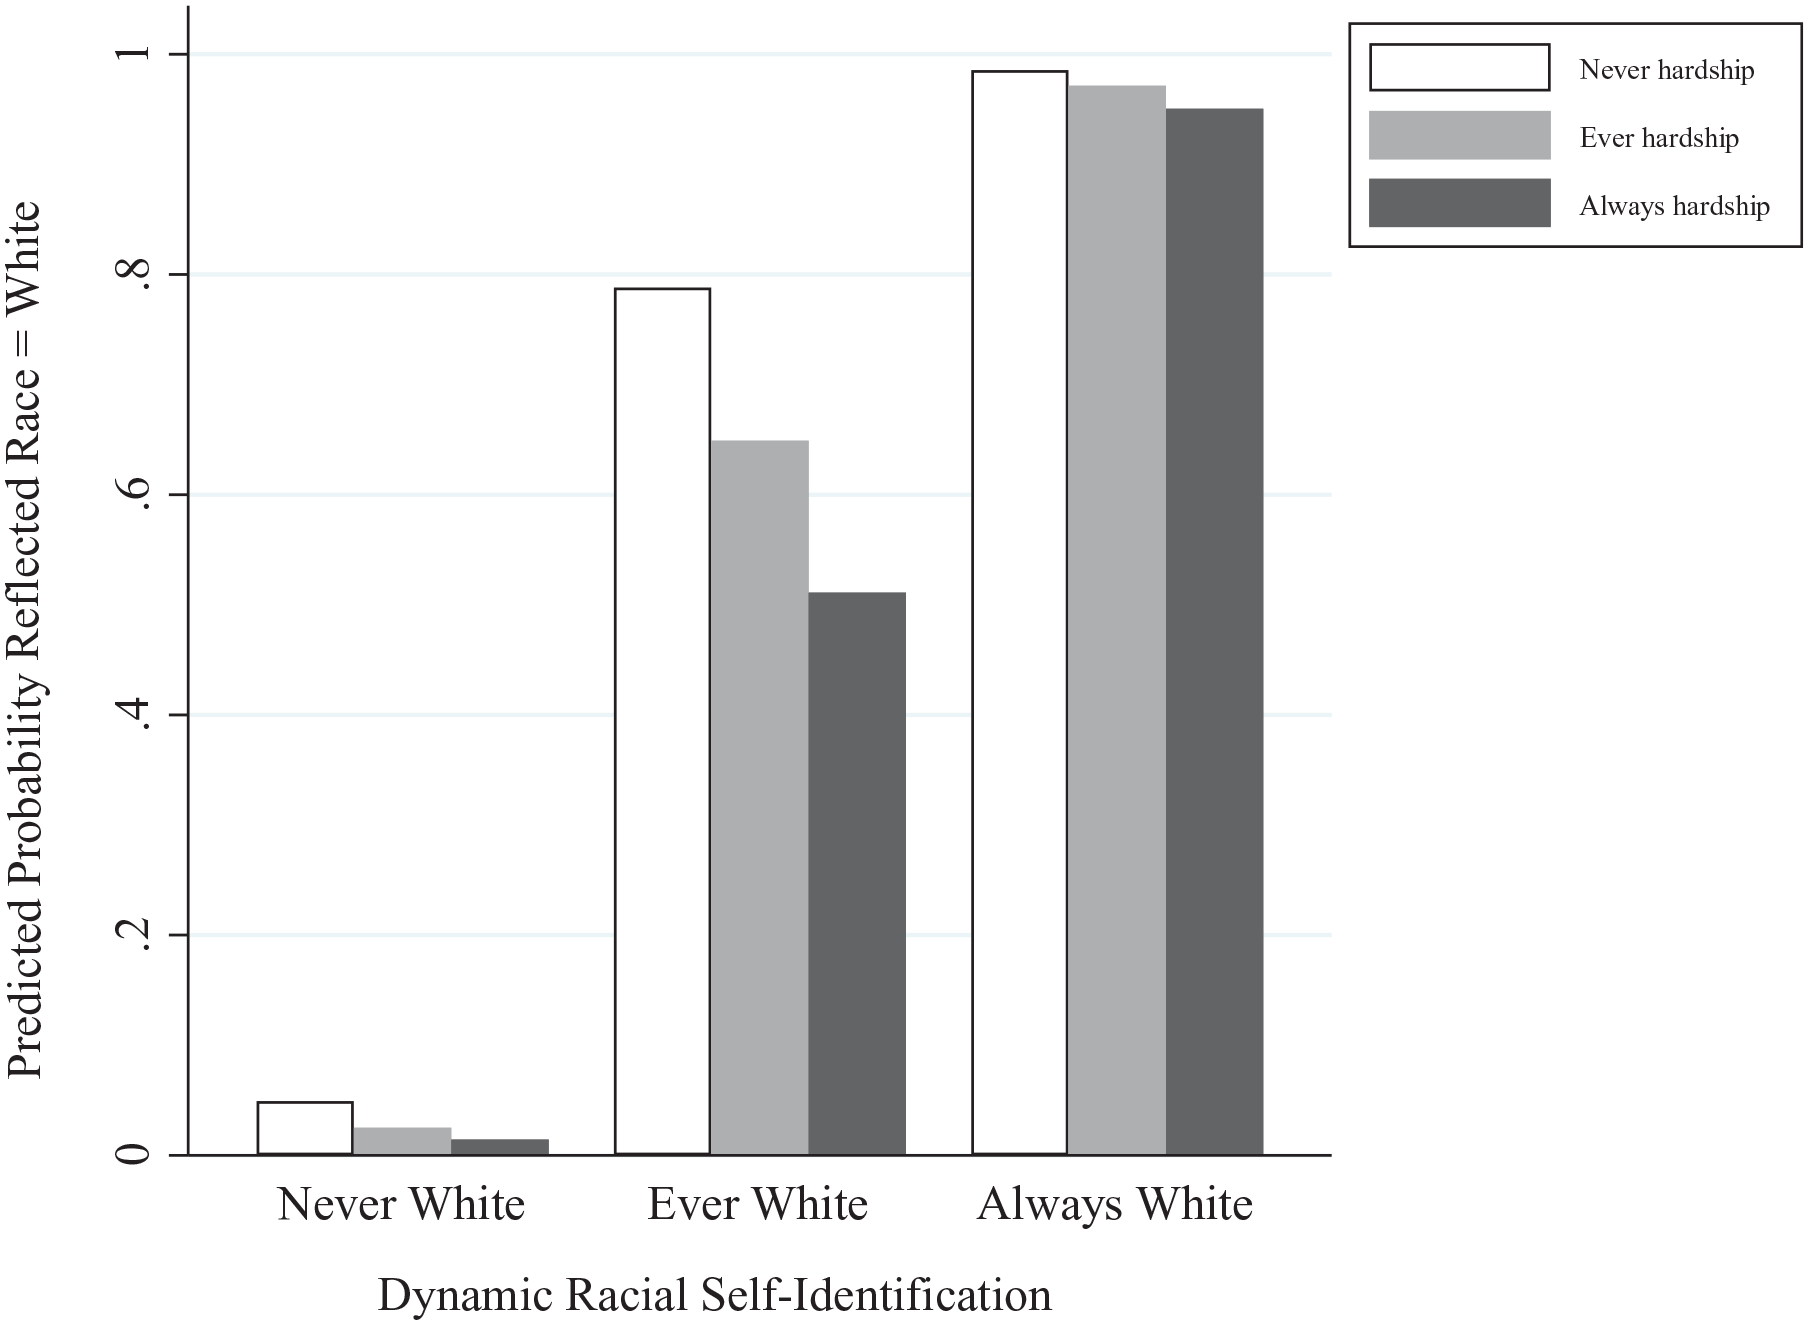
Predicted probabilities of reporting a White appraisal, by racial self-identification and hardship experience.
The relationship between past hardship and reporting a Black reflected appraisal is less clear. Given the previous results, we would expect that those who experienced hardship also would be more likely to report a Black appraisal; however, the results in Table 5 suggest we cannot reject the null hypothesis that there is no relationship. 24 Instead, the results indicate that the strongest predictors of Black appraisals are always or ever self-identifying as Black.
Other measured characteristics, beyond material hardship and self-identification, are also significant predictors of racial reflected appraisals. All else being equal, people who were born in the United States are significantly more likely to report being perceived as White and significantly less likely report being perceived as Black. This is consistent with previous research on how nationality is related to the formation and maintenance of racial categories. For example, many immigrants attempt to distance themselves from identification with blackness, even when they might externally be ascribed as such (Itzigsohn, Giorguli, and Vazquez 2005; Marrow 2009). Other work details the centrality of national origin and perceived foreignness in the racialization of Asians and Arab/Middle Easterners (see, e.g., Kim 1999; Maghbouleh 2020; Zopf 2018). Also, as might be expected, people who completed at least one survey in Spanish are marginally less likely to say that others see them as White and more likely to say that others perceive them as Hispanic (see Davis and Moore 2014 for a discussion of the racialization of the Spanish language). One’s language use and nativity may not be as visible as socioeconomic status, but these findings suggest both are (or are perceived to be) racially coded as well.
Discussion and Conclusions
In this analysis, we explored the relationship between reflected race and material hardship to better understand the mechanisms and processes linking race to inequality. Specifically, we asked (1) whether reflected race predicts hardship after accounting for racial self-identification and (2) whether racial reflected appraisals are shaped, in part, by past experiences with material hardship. Our first set of findings indicates that reflected race is a significant predictor of future economic experiences. New York City residents who report being seen by others as Hispanic or Black are significantly more likely to experience hardship in the future than residents who report being seen by others as White, net of other factors identified in previous research, including their experiences of hardship in the past. The relationship holds even after controlling for measures of racial self-identification. This supports the claim that race has multiple dimensions, each of which provide a different perspective on patterns of racial inequality. In this case, we show that how New Yorkers report they are racially perceived by others is a stronger predictor of experiences with hardship than self-identification.
Our second set of findings combines with the first to provide suggestive evidence of a bidirectional relationship between reflected race and material hardship. New York City residents who have experienced hardship are significantly less likely to report being perceived as White and significantly more likely to report being perceived as Hispanic. These results mirror well known associations between race and status. However, our data not only account for racial self-identification at two points in time but also time ordering between the measures of race and hardship, as well as a wide range of controls, including nativity, educational attainment. Although we cannot provide direct causal evidence of a link between reflected race and both past and future hardship, our findings offer important indications along those lines that should be taken into account in future research.
As a reminder, though, readers should exercise caution in generalizing our results beyond New York City. At minimum, we might expect cities with similar demographic contexts to experience similar relationships between racial categorization and socioeconomic status. For example, cities such as Boston, where Puerto Ricans are one of the largest Hispanic subgroups, as in New York, might exhibit similar patterns. 25 Even in cities with different Hispanic origin compositions (such as Miami), or different compositions of immigrant and native born racial populations (such as San Francisco), we still might expect to find both that minority populations disproportionately experience hardship and similar perceptions that whiteness is associated with the lack of previous hardship experiences. 26 However, the ability to explore spatial patterns in the relationship between reflected race and hardship, and their implications for the processes underlying the reproduction of racial inequality, is contingent on multidimensional measures of race being available on national surveys.
Implications for Race Measurement and Dynamic Perspectives
The significance of reflected race for predicting future hardship has implications for best practices in race measurement. Results from our first set of analyses, along with findings from previous research (e.g., Gonlin 2020; Roth 2016; Vargas et al. 2021; Vargas and Kingsbury 2016), provide support for broader use of reflected race in studies of inequality. If reflected race primarily captures physical appearance, then it is easy to imagine that reflected race offers a better measure of appearance-based discrimination for people whose racial self-identifications differ from how they would typically be seen by others. There is tremendous within-group variation in phenotype even among people who self-identify the same way that is generally not accounted for in stratification research (for discussions of Black, White, and Hispanic skin color variation, see, e.g., Branigan et al. 2013; Monk 2014; Vargas 2015). Thus, reflected race measures can augment analyses of inequality both within and between conventional self-identified racial categories. This supports the importance of asking people about racial reflected appraisals as a regular feature of social science research (see also López and Hogan 2021), especially in settings in which assessing observed race (i.e., actual racial classifications by others) is not feasible. Indeed, increased reliance on online surveys in general, and especially amidst the coronavirus disease 2019 pandemic, makes incorporating reflected race measures more pressing moving forward.
Yet if reflected race is more than just a proxy for physical appearance, as our second set of analyses suggests, then reflected race measures will be useful not only as an alternative option but in addition to the information provided by measures of phenotype or observed race. For example, reflected race may be uniquely useful in understanding who reports racial discrimination, regardless of whether the perception would be considered accurate by others (Farrell 2020; Stepanikova and Oates 2016). In this way, each measure of race relates to distinct processes that connect racial categories to consequences (Roth 2016; Saperstein 2012). Explicitly combining different measures of race also can be fruitful, as when reflected race and self-identification together speak to whether someone feels their racial identity is “validated” by others (Rockquemore and Brunsma 2002), a perception that also has been linked to well-being. Furthermore, it follows that we might expect people’s racial reflected appraisals to change as their circumstances change, and such fluidity could occur in addition to, or instead of, changes in self-identification (cf. Duncan and Trejo 2011). Future research can provide additional insight into these processes of racial categorization by assessing reflected race at multiple points in time alongside other dimensions of race.
Indeed, when taken together, our findings highlight the potential for a vicious cycle: experiencing hardship is a predictor of New York City residents reporting they are perceived as Hispanic, and New Yorkers who report being seen as Hispanic are also at greater risk for experiencing hardship in the future. Research that relies on static, one-dimensional measures of racial categorization and deprivation cannot do justice to this complex process. These findings also have implications beyond research practice: if not experiencing material hardship is one of the criteria for being seen as White, then racial inequality is structured into U.S. society even more deeply than most Americans realize.
Supplemental Material
sj-docx-1-srd-10.1177_23780231221124578 – Supplemental material for Reflecting Race and Status: The Dynamics of Material Hardship and How People Are Perceived
Supplemental material, sj-docx-1-srd-10.1177_23780231221124578 for Reflecting Race and Status: The Dynamics of Material Hardship and How People Are Perceived by Victoria E. Sosina and Aliya Saperstein in Socius
Footnotes
Acknowledgements
We would like to thank Michelle Jackson, Becky Pettit, Cecilia Ridgeway, Emma Williams-Baron, members of the Stanford Inequality Workshop, and members of the Stanford Race, Religion, and Ethnicity Group for their comments and suggestions and Julien Teitler and Chris Wimer for data access and assistance. Data from the New York City Longitudinal Survey of Wellbeing are available through Columbia’s Center on Poverty and Social Policy. See, ![]() .
.
Funding
The author(s) disclosed receipt of the following financial support for the research, authorship, and/or publication of this article: This work was supported by the Russell Sage Foundation and the Institute of Education Sciences, U.S. Department of Education, through grant R305B140009 to the Board of Trustees of the Leland Stanford Junior University. The opinions expressed are those of the authors and do not represent views of the Institute of Education Sciences or the Department of Education or the Board of Trustees of the Leland Stanford Junior University.
Supplemental Material
Supplemental material for this article is available online.
Notes
Author Biographies
References
Supplementary Material
Please find the following supplemental material available below.
For Open Access articles published under a Creative Commons License, all supplemental material carries the same license as the article it is associated with.
For non-Open Access articles published, all supplemental material carries a non-exclusive license, and permission requests for re-use of supplemental material or any part of supplemental material shall be sent directly to the copyright owner as specified in the copyright notice associated with the article.