
Abstract
Americans disagree on legal abortion now about as much as they did in the 1970s, but their attitudes now sort much more according to political identity. Differences of opinion by religion, gender, race, and work that were key to understanding abortion attitudes in the 1970s persisted through 2021. The General Social Survey shows that first conservatives increased their opposition to legal abortion rights; their mean score dropped 1.1 points (on a 6-point scale) from 3.8 to 2.7 from 1974 to 2004. As conservatives’ opinions leveled off, liberals increased their support of abortion rights from 4.7 in 2004 to 5.3 or 5.4 in 2021 (because of Covid-19, survey mode changed, creating uncertainty about the sources of change). Women were significantly more divided by political ideology than men were throughout the time series, but gendered political differences did not displace or reduce religious, educational, racial, or work-life differences.
Few Americans support banning abortion completely; far more think it should be legal regardless of circumstances, but even more, possibly a majority, think that access to legal abortion should be limited after some point in the woman’s pregnancy or depending on other circumstances. That rough breakdown describes most results in academic surveys and public polling on abortion opinion since the 1970s, with Americans’ attitudes remaining remarkably stable over the past 50 years or so (Fiorina 2017; Fischer and Hout 2006; Wilcox and Norrander 2002). Abortion is far more partisan now than it was 50 years ago. Liberals and Democrats support abortion rights and conservatives and Republicans oppose those rights to a greater degree than in the past (Fiorina 2017; Hout 1999). We think of this pattern of little change in the distribution of opinions but ever-sharper political division as “stasis and sorting.” Past research established the pattern as of the early 2000s. We extend the time line through 2021 (with a caveat about data collected during the Covid-19 pandemic).
Accurate information about Americans’ abortion attitudes is particularly important given the new legal landscape in the wake of the U.S. Supreme Court’s decision to revoke the individual protections established in Supreme Court rulings in the cases of Roe v. Wade and Casey v. Planned Parenthood in the case of Dobbs v. Jackson Women’s Healthcare (2022). Of course, the Supreme Court does not consult public opinion in reaching a judgment; it rules on matters of the law. However, the opinion opened as our article does, with the observation that Americans disagree on abortion, although the court failed to note the relative sizes of the three groups. In a crucial passage the decision reads, “Our decision returns the issue of abortion to those legislative bodies, and it allows women on both sides of the abortion issue to seek to affect the legislative process by influencing public opinion, lobbying legislators, voting, and running for office” (Dobbs v Jackson Womens Health Care 2022:65). Since 2020, in anticipation of just this kind of outcome, several states have aggressively limited abortion rights, and 13 states have passed laws that would outlaw abortion altogether now that the Supreme Court has overturned Roe v. Wade. A dozen or so other states are considered very likely to do the same. Other states, in contrast, have strengthened legalized abortion (Thomson-DeVeaux 2022). At this moment, when abortion law now falls within the purview of state legislative bodies, we turn our attention to the long arc of abortion public opinion.
We examine representative samples of the nation’s adults and the degree to which abortion attitudes have sorted by political ideology and party and assess whether rising political differences have overshadowed other differences: by religion, education, labor force participation, and race. In doing so, we rely on nationally representative samples that ask the same questions the same way over time, that is, the General Social Survey (GSS).
Results we will show after our discussion of prior research confirm stasis and sorting. Specifically, support for legal abortion varied little over time, but the correlation between abortion opinion and ideological identification increased from .13 to .38. Political sorting occurred in phases. First, self-identified political conservatives increased their opposition to abortion from the mid-1970s to 2004, and then liberals increased their support for legal abortion after 2004. The difference between liberals and conservatives grew threefold between 1977 and 2018 (from .8 to 2.5 points on a 6-point scale). It was bigger among women than among men throughout the time series (Hout 1999). By 2004, the political gap was greater than the biggest social gap (the difference between people with no religion and religiously active evangelical Protestants). Finally, as strong as it has become, political sorting did not supplant religious, class, and gender cleavages that divided opinion on abortion in the 1970s and 1980s.
Public Support for Abortion Rights Increased and Then Polarized
Gallup first asked about abortion in 1962; Americans supported legal abortion by wide margins if the mother’s health was “in danger” or “the child may be born deformed” but opposed abortion when “the family does not have enough money to support another child” (Blake 1971). The questions that would form the “Rossi scale” first appeared in 1965 in a National Opinion Research Center (NORC) survey of all adults and the National Fertility Study that surveyed married women under the age of 55. The NORC survey showed somewhat less support than the 1962 Gallup poll had (Rossi 1967).
Public support for legal abortion rose dramatically between 1965 and 1972 before stable majorities emerged during the 1970s and 1980s (Fiorina, Abrams, and Pope 2011; Rossi and Sitaraman 1988). In 1965, three out of four Americans agreed pregnant women should be able to get a legal abortion if their health depended on it, a majority agreed if she had been raped or a birth defect was likely, but only one in five or one in six agreed abortion should be legal for poor women, single women, or women who wanted no more children (Granberg and Granberg 1985; Rossi 1967). Those percentages rose an average of 28 points by the mid-1970s, to the point where majorities favored legal abortion in five of the six conditions and 47 percent favored it for the least popular reason, preventing more births (Granberg and Granberg 1985).
Around the time of Roe v. Wade, Democratic elected officials supported legal abortion more than their Republican counterparts, but there were many exceptions (Layman and Carsey 2002; Luker 1985). Republican Congressman Henry Hyde’s 1975 amendment that banned federal funding for abortions, still among the most consequential federal abortion policies, exemplified the way abortion politics cut across political lines. Democratic Senator Jim Oberstar sponsored the Hyde Amendment in the Senate. The roll call vote to adopt the amendment “crossed the aisle”; 44 percent of Democrats voted for it, and 26 percent of Republicans voted against it. Although elected officials began aligning more with their parties’ prevailing views in the 1990s, prominent Democrats like Senator George Mitchell of Maine, then-Senator Joe Biden of Delaware, and Governor Bob Casey of Pennsylvania supported abortion restrictions while prominent Republicans like Senator-then-Governor Pete Wilson of California and Senators William Roth (Delaware) and John Warner (Virginia) supported abortion rights. The current near-perfect correlation between party and abortion stance among elected officials was not fully realized until the 2000s.
We know little about partisan sorting of abortion attitudes among regular people prior to the first GSS in 1972; neither Rossi (1967) nor Blake (1971) tabulated data from the 1960s by political party, nor can we make tabulations from their data because their individual-level data are not available in public data archives. Our own calculations from the first GSS in 1972 show Republicans supported legal abortion slightly more than Democrats in each of Rossi’s six conditions; independents supported legal abortion the most. Compared to advocacy groups and political actors, the American public held more moderate opinions on abortion (Fiorina et al. 2011), and partisan and demographic sorting on the issue remained strong but imperfect through 2010 (Fiorina 2017). Liberals and conservatives were farther apart than Democrats and Republicans in the 1990s (Hout 1999); our analysis will show that is still true.
Religion, Race, Gender, and Other Social Divisions
Most recent articles treat abortion attitudes as exclusively or primarily political (Baldassarri and Park 2020), although, when Adamczyk, Kim, and Dillon (2020) recently weighed several social and demographic factors, religion stood out as a particularly strong predictor. Research in the first decade after Roe v. Wade routinely linked the public’s abortion attitudes to religion, class, and gender ideology (Granberg and Granberg 1985).
In the 1970s, Americans’ abortion opinions differed most among people of different religions. Researchers emphasized how Catholics, especially those who attended services or prayed frequently, were much more likely to oppose legal abortion in some or all circumstances than people from other religions (Blake 1971; Granberg and Granberg 1985). Later research made clear that evangelical Protestants closely resembled Catholics (Hout 1999), although this difference varies by ethnicity (Bartkowski et al. 2012). Religious and secular Americans’ views of legal abortion remained far apart through the end of the century (Evans 2002).
Black and Latinx Americans supported legal abortion less than White Americans did during the 1970s and 1980s; as support among Whites waned, their views came more in line with Black Americans’ level of support for legal abortion (Wilcox 1990). At the same time, racial differences interacted with gender: Black women supported legalized abortion more than White women; Black men supported legal abortion less than White men. Most accounts attributed differences among racialized groups to differences in religion and religiosity (for a broader discussion on the tension between the liberal and religious values of racialized groups, see Schnabel 2021). 1
The popular press sometimes frames abortion as a women’s issue (as did Alito 2022), with an implicit expectation that women support legal abortion more than men do. While women have a greater interest in accessing legal abortion and are closer to the issue generally (Barkan 2014), support is far more contingent than coverage hints. Luker (1985:217) emphasized major changes in women’s roles: “As more women combine jobs and careers with motherhood and as the public comes to assume that the ordinary woman can readily do this, women who choose to be exclusively housewives and mothers find their values, their status, and their way of life devalued,” also noting that abortion opponents she interviewed cited abortion as “an ultimate devaluation” of women’s traditional roles. Most scholarly research in the 1990s showed trivial gender differences (Hertel and Russell 1999; Walzer 1994), but that did not contradict Luker’s view of women on both sides of the issue. Women’s views varied more than men’s did, though, and that variation aligned with political ideology. Luker (1985) discussed how and why women were more involved than men in leading organizations on both sides of the abortion issue and set the terms of the national debate. Similarly, Hout (1999) found that conservative women opposed abortion more than conservative men did while liberal women supported it more than liberal men did. Barkan (2014) concluded that women’s religiosity suppressed their support for legal abortion, which would otherwise be greater than that reported by men. Employment status divided women, too; working women supported abortion rights far more than homemakers did (Glass 1992).
Our goals in this article are to quantify the degree of political sorting—the correlation between political identity as conservative or liberal and abortion stance—in recent data and resolve the question of whether political sorting flattened religious and other differences or just added to them.
Findings
Americans’ support for legal abortion averaged 3.9 points on a 6-point scale since 1972, and annual estimates were all within ±.3 of that long-term average (see Figure 1). That is the “stasis” identified in prior research. Support was significantly higher than average for a few years after abortion became legal nationwide in 1973 and significantly lower than average in the 2000s. Since 2004, support trended back up to the long-term average. Although these changes were statistically significant, they were small compared to change in other controversial attitudes (Hout 2021). 2

Support for legal abortion by year among adults: United States, 1972–2021.
An irony of polarization is that under extreme polarization, nobody is average; they cluster at the extremes. Abortion attitudes come about as close to that as Americans get (DiMaggio, Evans, and Bryson 1996). Throughout the time series, 6 was the most common score (44 percent in 2018), followed by 3 (18 percent in 2018; Cowan, Hout, and Perrett 2021). 3
The 2021 GSS shows what appears to be a sharp uptick in abortion support. While the new data may reflect some change, we have reason to suspect that the way the GSS accommodated the Covid-19 pandemic makes it hard to take the 2021 data at face value (see methods section). Accordingly, we show the 2021 average as a stand-alone data point in the figure and did not include it in the data smoothing.
Political Sorting
The American public sorted itself into ideological camps characterized by increasingly distinct attitudes on many subjects during the period of our study (Baldassarri and Park 2020). 4 Abortion attitudes exemplified that process, as Figure 2 reveals. 5 In 1974 (the first year GSS asked about ideology), conservatives supported abortion rights in a majority of the six Rossi items and averaged 3.8 on the Rossi scale. 6 Conservatives supported legal abortion less each year from then until the mid-2000s, by which time, they averaged just 2.7 on the Rossi scale. Conservatives changed very little since 2004; their mean trickled down one-tenth of a point to 2.6 in the most recent few years (ignoring the problematic 2021 data point). Liberals, on the other hand, changed little until recently. Their average hovered near 4.6 on the Rossi scale throughout the period from 1974 to 2008. Since then, liberals have slightly increased their support for legal abortion, scoring 5.1 on the Rossi scale in 2018. The gap between liberals’ and conservatives’ abortion attitudes more than tripled in the span of 44 years, from .8 points to 2.5 points. Through it all, moderates changed remarkably little, never deviating significantly from their long-term average of 4.0 on the Rossi scale.
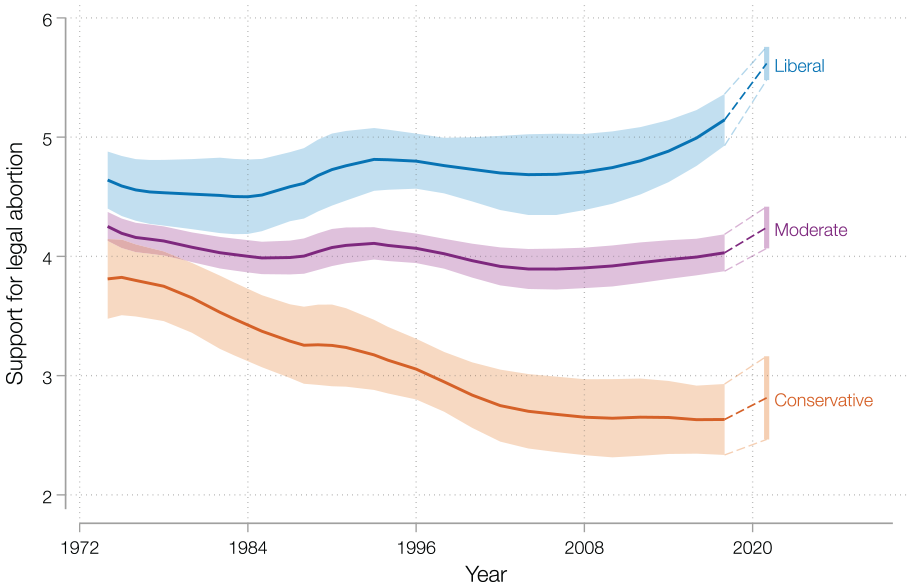
Support for legal abortion by year and political ideology: Adults, United States, 1974–2021.
Many political scientists argue that Americans are not ideological (e.g., Kinder and Kalmoe 2017); they recommend that researchers use party instead of ideology in research about political identity. We think abortion is an important exception to that recommendation. The abortion issue emerged as the parties were in the midst of an historic realignment, replacing regional appeals and traditions with cultural stances, including abortion, and identities as major axes. With the purported independent variable changing more than the outcome of interest, focusing on party seems wrong for this issue. In support of using ideology here, we note that liberals scored higher than conservatives on the Rossi scale in every year for which we have data, but parties flipped. Republicans supported abortion rights more than Democrats in the 1970s, were not significantly different from Democrats in the 1980s, and only since the 1990s have they supported abortion rights significantly less than Democrats. In 2018, liberals scored 2.5 points higher than conservatives on the Rossi scale, while Democrats scored just 1.6 points higher than Republicans; furthermore, liberals supported abortion one-half point more than Democrats did, while conservatives opposed abortion one-third of a point more than Republicans did.
Social and Demographic Differences
Our other research questions concern how political differences compared with differences in support for legal abortion by religion, race, gender, labor force participation, education, and other factors. In particular, how do differences between pairs of groups analogous to liberals and conservatives in other domains compare with political liberals and conservatives? We compared religious with nonreligious people, college graduates with high school graduates, Black people with White people, and full-time workers with homemakers. Did growing political differences overshadow or reduce other cleavages? To address those questions, we developed a multivariate model (Equation 1 in the methods section) and calculated the conditional marginal differences that the model implied for each variable in each decade (Williams 2012).
The panels of Figure 3 show conditional marginal differences for political ideology and five social and demographic predictor pairs by decade. Hout (1999) found that politics divided women more than men, so our model included the interaction between ideology and gender, yielding separate marginal differences between liberals and conservatives for women and men. Greeley and Hout (2006) found that religion mattered more for active members of a religion than for inactive ones, so we included an interaction between denomination and attendance at services in our model and calculated the marginal differences by religion for those who never attend services and those who attended weekly. We also hypothesized that labor force participation only affected women’s attitudes (see Bolzendahl and Myers 2004; Glass 1992). The results confirmed that hypothesis, so we only show the conditional marginal difference between full-time workers and homemakers for women.
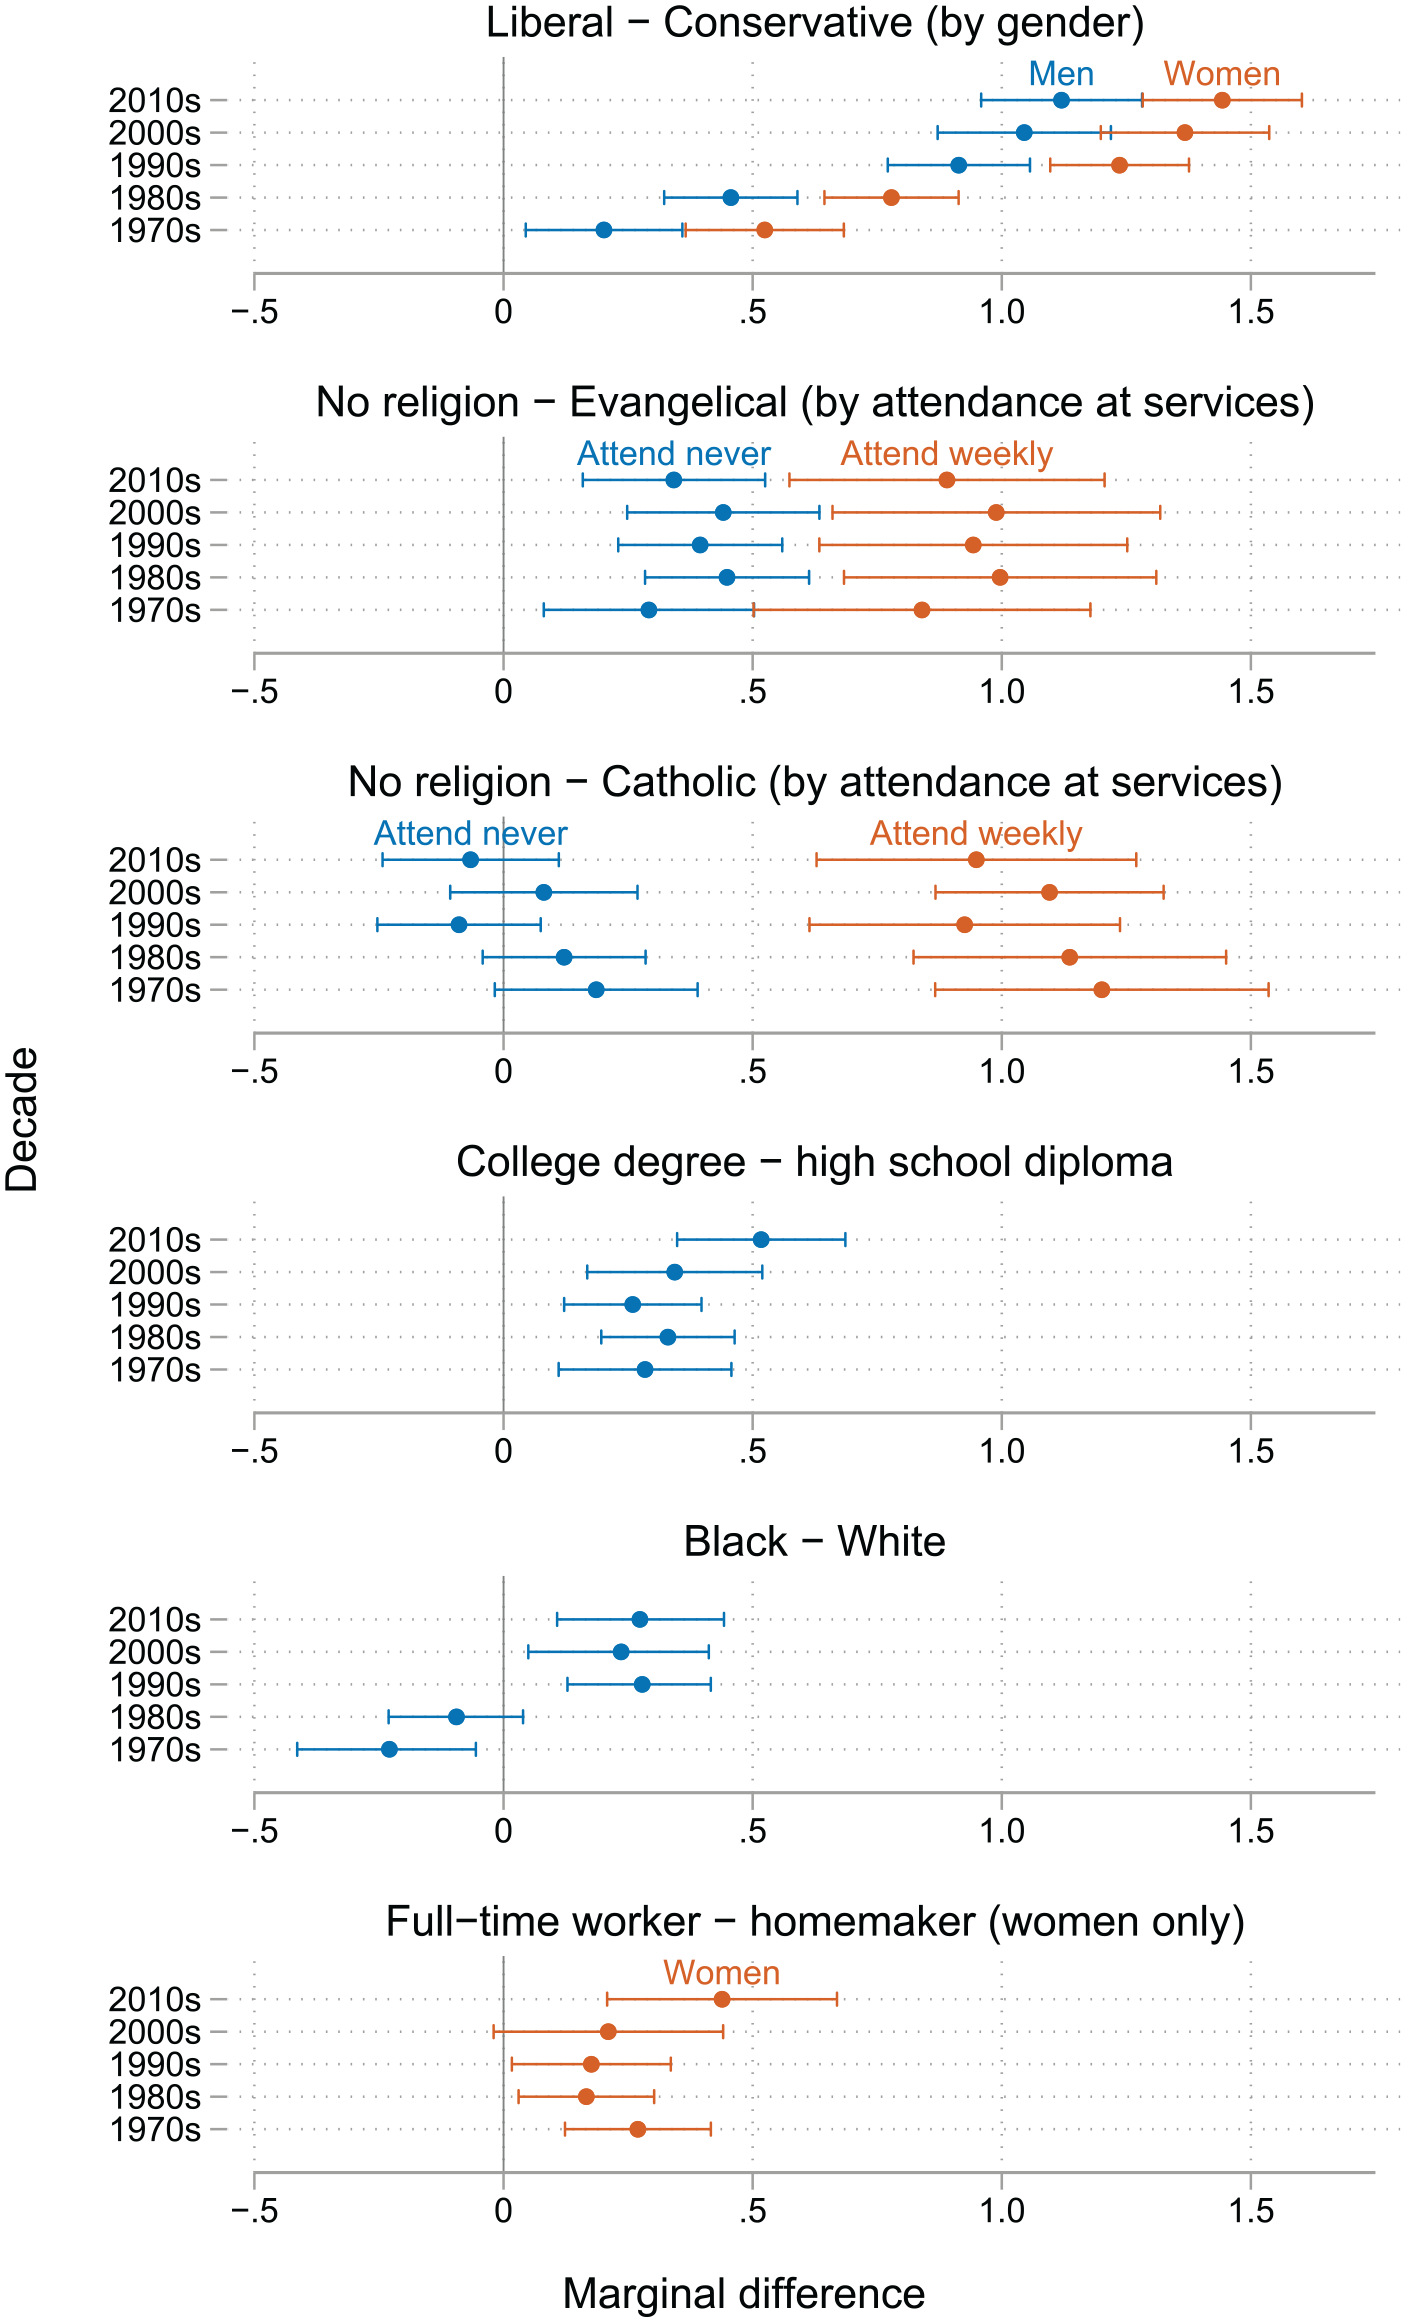
Marginal differences for select categories of five predictors by decade: Adults, United States, 1974–2018.
Comparing the top panel of Figure 3 with the others, we see that prior to 1990, the marginal difference between liberals and conservatives was smaller than the difference between religiously active and nonreligious people and roughly comparable to the key differences in the other variables. This ideological differential increased substantially from the 1970s to the 2010s. By the 2010s, the ideological gap was bigger than the other gaps, even those associated with religion. Ideological differences were, in each decade, significantly greater for women than for men.
People with no religious preference supported legal abortion more than religiously active evangelicals or Catholics in all five decades. For evangelicals, their religious identity induced some opposition to abortion, even if they never attended religious services, but there was no difference between the abortion views of inactive Catholics and people with no religious preference. We included the two religious groups that differed most from people with no religion in Figure 3; our model also estimated differences for Jews, mainline Protestants, and other religions. Jews at all levels of attending services supported legal abortion the most, even more than people with no religion. Mainline Protestants (active and inactive) supported legal abortion slightly less than did people with no religion (the conditional marginal difference was –.17), and people of other religions were not significantly different from those with no religion.
In each decade, college graduates supported legal abortion about one-third of a point more than high school graduates. Women who worked full-time supported abortion rights about one-fourth of a point more than homemakers, again, in all five decades. High-status workers supported abortion rights more than low-status workers in each decade (status is a continuous measure that is hard to show on a figure like Figure 3).
The conditional marginal difference between Black and White people reversed over time. In the 1970s, Black people supported legal abortion significantly less (on net) than White ones, the two groups differed slightly in the 1980s, and Black people have supported legal abortion significantly more than Whites have since the 1990s.
The tendency toward polarization, indicated by the growing difference between liberals and conservatives, added to but did not eclipse important social and demographic differences by religion, education, occupation (not shown), and labor force participation (among women). In that time, Black people shifted from modestly opposed to modestly supporting legal abortion (compared to Whites). In each decade, women were more politically divided than men.
Conclusions
Americans have disagreed about legal abortion to approximately the same degree since 1972. Over time, those differences of opinion became increasingly aligned with ideological identities. In 1974, liberals and conservatives were about .5 SD apart on abortion; by 2018, their attitudes were 1.2 SD apart. Social and demographic divisions that were important in the 1970s persisted into the 2010s (except for differences in opinion by race, which reversed over time). Our findings are telling for abortion opinion specifically and for the nature of disagreement in public opinion more generally.
First, political divisions on abortion opinion have continued to grow in recent years. Abortion is distinct from other issues in the way liberals and conservatives moved in opposite directions. On most “culture wars” issues, liberals and conservatives moved in the same direction; a gap opened when one group (usually liberals) moved sooner or faster than the other (Baldassarri and Park 2020). On abortion, conservatives supported legal abortion in 3.8 of six conditions in 1974 but only 2.7 by 2004; liberals supported 4.6 throughout that period. Since 2004, conservatives’ abortion attitudes have changed less since the 1980s than attitudes about public policy (Fiorina et al. 2011) or those about other moral issues—on which opinion has become both more progressive and less politicized in the past three decades (Baldassarri and Park 2020). The trends we document contrast with, for example, the convergence on views on the legalization of cannabis or same-sex marriage (Hout 2021; Schnabel and Sevell 2017).
Yet, abortion is not just a political issue. As we have shown, meaningful social and demographic differences persisted as abortion became politicized. These differences are independent of those associated with ideology. Although the magnitude of differences by ideology are now greater than those among social and demographic groups, it is worth reiterating the importance of social and demographic cleavages in the political domain. Factors of the sort we considered here are more predictive of political identification than they were 50 years ago, as social sorting has grown (Mason 2018). Party identification is, in turn, more predictive of abortion opinion than it used to be (although a weaker predictor than ideology, as we noted previously). The direct connection between demographics and abortion opinion, net of political identification, contradicts the classic causal model in which demographic attributes influence issue positions through political identification (Campbell et al. 1960).
Indeed, the ideological sorting of abortion attitudes makes us wonder if opposing abortion has become part of what it means to identify as “conservative.” The overall distribution of political views changed only slightly more than the overall distribution of abortion attitudes since the 1970s (Hout 2021). If Kinder and Kalmoe (2017) are right that, for the most part, Americans are not ideological but Adamczyk et al. (2020) are right that most Americans take a stand on abortion, it follows that many people, when asked if they are liberal or conservative, think about their abortion stance before answering. The evidence to this point is circumstantial and associational. We hope to see more research into the link between ideology and issues, including abortion, in the future.
Data, Methods, and Statistics
Data for our analyses come from the GSS, a succession of cross-sectional surveys dating from 1972 (Smith et al. 2019). The GSS sample represents American adults who live in households. Most interviews were conducted in person, although some were done via telephone; interviews are available in English or Spanish (since 2002). Response rates were about 77 percent from 1974 to 1998, 70 percent from 2000 to 2014, and 60 percent in 2016 and 2018. The sampling design was changed in 2004 to better cope with falling response rates. The 2004 design change requires weights; we used the wtssnr weight in our analyses (Smith et al. 2019). In 1982 and 1987, the GSS oversampled the Black population; we used the oversamp weight for those two years.
Covid-19 and the 2021 GSS
The Covid-19 pandemic and subsequent social lockdown seriously disrupted the 2020 GSS. Fieldwork was about to begin in March 2020 when the pandemic ruled out in-person interviewing. Although no one questioned the need to protect respondents and interviewers in this way, all involved agreed that collecting data during the crisis was essential, too. The GSS team designed two online data collections. First, NORC invited a sample of 2016 GSS respondents and all 2018 GSS respondents to complete the 2020 GSS online or by phone; that is known as the 2020 GSS panel study. Second, a cross-section of households sampled in the usual way was contacted in December 2020 and asked to complete the 2020 GSS online. Most who responded did so in 2021 so that data set is known as the 2021 GSS cross-section. Although everyone in both studies was invited to complete a web survey, 30 percent of the 2020 GSS panel respondents opted to be interviewed by phone, and 12 percent of the 2021 GSS cross-section respondents also opted for the phone.
The 2021 GSS had markedly lower response rate than prior years (Davern et al. 2021). If supporters and opponents of abortion rights are equally likely to participate in the online GSS, then the 2021 data reflect real change, but if abortion rights supporters were more likely to participate than abortion rights opponents, then some of the apparent increase in support for legal abortion between 2018 and 2020 may be an artifact of the change in how the data were collected. GSS built experiments into the 2022 data collection (and plan to repeat them in 2024) to help quantify the difference between face-to-face and web modes. But we can use responses to the 2020 GSS panel study, which uses a different sample of respondents than the 2021 GSS, to get a strong indication of how much a factor selective nonresponse might be in the difference between abortion opinion reported in the 2018 and 2021 surveys.
Of the people who were invited to participate in the 2020 GSS panel study, 40 percent (N = 1,823) responded. As suspected, abortion rights supporters were more likely to participate than abortion rights opponents, based on the differences between the 2016 and 2018 responses of those who subsequently did and did not participate in 2020 (compare the left and middle panels of Figure 4). For example, 46 percent of people who participated in the 2020 panel favored keeping abortion legal in all six conditions, while 38 percent of those who refused the reinterview did—a statistically significant 8-point difference. Among panel participants, 2020 responses showed both more support and more opposition than in their first interview; more scored 0 as well as 6 in 2020 (compare the middle and right panels of Figure 4). The 2016 and 2018 means for participants were 4.0 and 4.2, respectively (both higher than the cross-sections for those years), and their mean in 2020 was 4.1; the standard deviation of support rose from 2.08 at first interview to 2.15 in 2020.

Support for legal abortion by year and reinterview status: United States, 2016–2018 (pooled) versus 2020.
These results from the 2020 GSS panel study are sufficient for us to conclude that much, if not all, of the change between the 2018 and 2021 GSSs is an artifact of how the GSS had to modify data collection amid the Covid-19 pandemic. Final disposition will come with the mode experiments planned for 2022 and 2024. For now, we flag the 2021 data in descriptive statistics and do not use them in our multivariate analyses.
With all these unprecedented procedures, the 2021 GSS cross-section is a break from the rest of the time series. We depicted the disruption with dotted lines in our graphs.
Missing Data
Our analysis excluded people who had missing data on political views, religion, marital status, occupation, education, or labor force participation. After exclusions, the total sample size was 32,471. Most missing data was by design—the abortion items usually appeared on only two of the three GSS ballots (Smith et al. 2019); those data were missing completely at random and, thus, were not a bias in our analyses. Among independent variables, GSS has little missing data. Ideological identification was missing in 6 percent of otherwise usable cases (mainly because it was not asked until 1974), and occupation was missing in 4 percent (mainly because questionnaires were lost or damaged between data collection and coding in 2012).
The main reason for missing data in the 2020 GSS panel data was refusal to participate in the reinterview. As explained in the main text, we compared respondents who refused the online reinterview with those who participated to gain insight into how onine data collection might have introduced bias into the 2021 data. For that analysis, we compared 2016 and 2018 answers to the abortion questions for the 1,465 respondents who declined to be interviewed in 2020 with those of the 1,025 who participated (and were asked the abortion questions) in 2020.
Measurement
Six abortion questions, fielded in each GSS since 1972, have formed the backbone of research on abortion public opinion, now spanning 50 years. The questions focus on the legality of an abortion while varying the characteristics of a hypothetical woman seeking an abortion or the conditions under which she became pregnant. Specifically, they ask whether it should be possible for a pregnant woman 7 to obtain a legal abortion if 8 there is a strong chance of a serious defect in the baby, she is married and does not want any more children, the woman’s own health is seriously endangered by the pregnancy, her family is very low income and cannot afford more children, she became pregnant as a result of rape, or she is unmarried and does not want to marry the man. We follow the common practice of summing these six questions to form what is known as the Rossi scale (Rossi 1967). It measures support for legal abortion on a scale from 0 to 6, where 0 denotes opposing legal abortion under all six hypothetical circumstances asked and 6 denotes favoring legal abortion under all six hypothetical circumstances.
The Rossi scale is a highly effective summary because the answers form a hierarchical order such that very few people who oppose the item with most support (health) support any of the other items and very few people who support the two items with least support (unmarried and wants no more children) oppose any of the other items (Clogg and Sawyer 1981; Hout 1999). The Rossi scale is also highly reliable; its average interitem reliability was
Many researchers add a seventh item that asks about for “any reason.” That item was not introduced until 1977. Including it shortens the time series by five years without adding any appreciable insight in later years. Indeed, it actually adds confusion because in later years, 20 percent of people who disagreed with one or more of the original six items agreed with “any reason.” Additionally, we note that the seven-item scale proved to be less reliable than the six-item scale (Hout & Hastings 2016).
Factor analyses typically suggest that two factors underlie responses: broad support (the health, rape, and birth-defect conditions) and narrower support (single, poor, and family-size limitation; Jozkowski, Crawford, and Willis 2021).
The Rossi scale items neglect important elements of the current debate (Cowan et al. 2021). For example, they cannot distinguish between respondents’ personal moral position and their view on the law; they do not relate to interpersonal behavior or reflect the fact that policy before and after Roe v. Wade was more frequently set at the state level than at the federal level. Nevertheless, these items best facilitate the analysis of long-term trends we wish to conduct here.
Our key predictor variable is ideological identification, a 7-point, self-coded scale: “We hear a lot of talk these days about liberals and conservatives. I’m going to show you a seven-point scale on which the political views that people might hold are arranged from extremely liberal—point 1—to extremely conservative—point 7. Where would you place yourself on this scale?” For descriptive analyses, we grouped people who scored themselves as 1 or 2 into a “liberal” category, people who scored themselves as 3, 4, or 5 as “moderate,” and people who scored themselves as 6 or 7 as “conservative.” For multivariate analyses, we created an interval scale variable by subtracting four from the category numbers. Changing the scale in this way does not affect fit (relative to the 1–7 scoring), but it makes the interaction effects between political views and gender easier to interpret. The multivariate analysis includes social and demographic variables that have been significant in others’ analyses, coded according to standard practice (see Table S1 in the supplement).
Modeling
Our goal is to provide a useful description of patterns of support for and opposition to legal abortion. To that end, we use the simplest statistics appropriate to each task. We began with smoothed trends in abortion opinions for all adults. Then we separated the trends for political liberals, moderates, and conservatives. We then assessed the degree to which those differences might be spurious reflections of other differences. Finally, we showed the net differences for key covariates by decade.
The multivariate analyses are based on this linear model:

where
We use ordinary least squares (OLS) to estimate the
We use Equation 1 to calculate conditional marginal differences between political liberals and conservatives, people with no religion and those who identify as evangelical Protestants or Catholics, college graduates and high school graduates, Black and White people, and full-time workers and homemakers in each decade, controlling for all covariates in Equation 1 (see Williams 2012). We incorporate interaction effects in those calculations, separating men and women when considering ideology and labor force participation and separating those who attend services weekly and never attend when considering religious denomination.
While OLS is generally quite robust against violations of key assumptions (Efron and Hastie 2016:11), we checked for heteroskedasticity and the prospect that our conclusions might not hold up if we used trivially different modeling assumptions. To check heteroskedasticity, we calculated the standard deviation of
To check the functional form of the model, we considered a negative binomial model with the same outcome variable and the exact same specification of the independent variables. The model did not converge because the overdispersion parameter was a very large negative number. When we dropped an arbitrary year from the middle of each decade, we got convergence for the model with no covariates and an estimated value of −16.56 for the overdispersion parameter in log form; that implies near-zero overdispersion, exp(−16.56) = .000000064, which in turn implies we can use a poisson model. When we did so, we got nearly identical estimates for most key parameters, as we show by adding the poisson marginal estimates to Figure 3 (see Figure S5 in the supplement).
Supplemental Material
sj-pdf-1-srd-10.1177_23780231221117648 – Supplemental material for Stasis and Sorting of Americans’ Abortion Opinions: Political Polarization Added to Religious and Other Differences
Supplemental material, sj-pdf-1-srd-10.1177_23780231221117648 for Stasis and Sorting of Americans’ Abortion Opinions: Political Polarization Added to Religious and Other Differences by Michael Hout, Stuart Perrett and Sarah K. Cowan in Socius
Footnotes
Supplemental Material
Supplemental material for this article is available online.
Notes
Author Biographies
References
Supplementary Material
Please find the following supplemental material available below.
For Open Access articles published under a Creative Commons License, all supplemental material carries the same license as the article it is associated with.
For non-Open Access articles published, all supplemental material carries a non-exclusive license, and permission requests for re-use of supplemental material or any part of supplemental material shall be sent directly to the copyright owner as specified in the copyright notice associated with the article.