
Abstract
The author advances the theory that when evaluation bears high stakes and is subject to high uncertainty of quality, a greater presence of numbers in the evaluated materials positively influences the evaluator’s assessment of the quality of the evaluated object and leads to less variance in the overall assessment of quality by evaluators. The author explores these ideas in a case study of the MacArthur Foundation’s 2016–2017 $100 million winner-take-all grant competition for nonprofit organizations and tests them using judges’ numeric scores and comments together with information from the application materials, tax records, and previous funding histories of the applicant organizations. In this competition, organizations that included more numbers of any kind in their application materials received on average higher scores. Furthermore, the independent judges on the nondeliberative panel were more likely to give the applicants similar scores. Quantification thus both carries a premium—it predicts higher scores—and produces evaluative convergence.
Systemic patterns of advantage and disadvantage in processes of evaluation shape lives in myriad ways. Evaluators distribute resources, reward past merit, and invest in future promise, in hiring (Rivera 2015), college admissions (Stevens 2007), promotions (Castilla and Benard 2010), venture capital investing (Sorenson and Stuart 2008), and online customer and consumer evaluations (Curchod et al. 2020; Luca and Zervas 2016).
Understanding how evaluators navigate high stakes and high evaluative uncertainty in the absence of established frames of reference, guidelines, or standards is important to both equity and access. Prior research has focused on understanding the biases that emerge from long-standing institutional practices. Organizational decision makers purposefully privilege certain features to improve accountability and control, giving up accuracy in exchange for consistency (Mazmanian and Beckman 2018). Rules and rubrics can unintentionally privilege features nearly orthogonal to the evaluation target (Gorman 2005; Kleinberg et al. 2018). Architectures of evaluation can heighten individual evaluators’ biases on the basis of targets’ status characteristics (Bohnet, van Geen, and Bazerman 2015; Quadlin 2018; Rivera and Tilcsik 2019).
What would evaluators do without these decision-making crutches: status markers, prior experience, and established rubrics? Given that these systems cause bias, one possibility is that evaluators would be fairer without them. Alternatively, though, they could also deal with the cognitive burden by turning to unpredictably subjective and idiosyncratic preferences or perhaps relying on even more simplistic markers of quality. Researchers and managers need to understand the answer to this question before proposing to moderate or reform the institutional features that create bias.
Some large organizations have tried to eliminate algorithms from their evaluative decision making. In 2016, the MacArthur Foundation announced the 100&Change competition, with tremendous rewards to favorable evaluation: one charitable organization, from any topic or geographic area, would be granted $100 million to push ahead one transformational project. The competition attracted 1,904 applicants, 798 of which remained after administrative review. The foundation then faced a mammoth task: evaluating and selecting from so many diverse applications. The organization decided to score all organizations and then promote the best-scoring applications for further review. When doing so, the foundation deliberately avoided using automated or algorithmic methods; each viable application was to be evaluated by a human expert, ideally a team of experts.
In this, the MacArthur competition differed from many other large-scale evaluations, which automate the first round of eliminations. For example, college admissions use algorithmic cutoffs based on applicants’ use grades, test scores, and subjects studied, and many labor markets use computers to score résumés algorithmically before human review. In the MacArthur competition, in contrast, each viable application was evaluated by five independent expert judges. Yet, as I will show, this all-human, subjective outcome was surprisingly similar to the output of an algorithmic, metrics-driven machine.
I argue that the presence of quantifiers (i.e., numbers) in application materials leads to both more favorable evaluations and more agreement between evaluators. This numeric bias holds because numbers have the appearance of commensurability (Espeland and Stevens 1998). I show that numbers are privileged even when the units they are describing do not lend themselves to easy comparison. In the grant competition, judges were tasked with comparing seemingly incomparable things: is it more pressing to eradicate river blindness (which threatens 120 million people) or provide educational access to 9.4 million children in a humanitarian crisis? Such a decision may necessarily rely on subjective values regarding the moral worth of different lives. On a more practical level, even the feasibility of the proposals might seem incommensurable. How does an improvement in water quality in a pilot intervention cited by one proposal compare with a scientific innovation in increasing the starch content and CO2 retention of rice discussed by another?
I investigate the evaluation process using a rich data set that combines information from application materials, tax records and previous funding histories of applicant organizations, and judges’ numeric scores and comments. I find that applications that include more quantifiers of all kinds receive higher scores and that their scores from different judges have lower variance. This association holds when accounting for various features of the application and the applicant organization. Qualitative analysis of judges’ comments further supports the argument that the apparent commensurability of numbers drives this association. The judges’ comments show that they seek out numbers when they are otherwise uncertain of an applicant’s quality.
When decision makers privilege quantitative indicators, there are far-reaching consequences: some interventions, and some organizations, become unintendedly privileged by the focus on numbers. Certain domains, such as childhood health in densely populated countries, are inherently more measurable than others, such as human rights in autocratic countries, which can affect judges’ ratings. This can reverberate through nonprofit funding more broadly, as organizations that achieved visibility through the competition are more likely to receive funding from other funders afterward. Thus, it is important to understand what guided evaluation in this competition.
Numbers as the Lens of Evaluation
I argue that under conditions of high stakes and high uncertainty, evaluators use the numeric or quantified content of applications as a lens of evaluation. A fundamental assumption of the theory is that evaluation requires commensurability of the objects of evaluation. Commensuration, the transformation of different qualities into a common metric, is a core aspect of decision making (Espeland and Stevens 1998; Lamont 2012). Commensuration eases the cognitive burden of decision making because translating differences between two options into a third scale simplifies the choice between them. Quantification is a particularly prominent form of commensuration in which decision makers transform objects of evaluation into countable dimensions (Porter 1994). Information presented in numeric quantities provides a clear commensurable metric: a program affecting 50,000 children has more impact than one affecting only 5,000.
Because of their ease of commensurability, numbers can have what Dahler-Larsen (2014) called constitutive effects: a domain that is numerically quantifiable becomes more valuable for that reason. These effects have been used to explain why, over time and repetition, policies may begin to target rankings or ratings rather than more holistic success, even when adopters agree that rankings are inadequate (e.g., Sauder 2008). I argue that constitutive effects can even apply when judges are making a nonroutine assessment for the very first time. Evaluators treat numbers as anchors, and thus they evaluate an application’s numerically quantified dimensions with greatest care, while discounting information that is hard to evaluate (Fourcade 2011; Zuckerman 1999). For example, if application A provides one type of benefit to 5,000 adults and application B provides a different type of benefit to 4,000 children, evaluators would focus on the numbers of lives and disregard the less readily compared units (the types of lives affected and the types of benefits conferred). The numbers themselves, rather than the features of which they are indicators, guide evaluation. Furthermore, applications that ease evaluators’ cognitive burden by including numbers at all should receive overall greater care than those with fewer numbers and thus receive more positive scores. As information functions in organizations as both signal and symbol (Feldman and March 1981), numeric information should take on positive meaning.
Hypothesis 1: A greater presence of numbers in the evaluated material positively influences the evaluator’s assessment of the quality of the evaluated object.
A greater presence of numbers should also predict convergence of evaluations across independent evaluators. Intuitively, it makes sense that people will vary less in their performance when a task is easier, but I further theorize a second, distinct psychological reason why the presence of numbers leads to greater agreement in evaluation. If, as I argued earlier, numbers draw evaluators’ attention and become a lens of evaluation, then different judges should focus on the same (quantified) dimensions when numbers are provided. In contrast, they may focus on entirely different aspects when rating less quantified applications. Thus, I expect lower variance in evaluation for more quantified applications, not just because it is easier to compare numbers with one another but also because the presence of numbers should make judges implicitly agree on the focus of evaluation.
Hypothesis 2: A greater presence of numbers in the evaluated material leads to less variance in the assessment of quality by a set of independent evaluators.
Note that the numbers bias I propose here is different from previous accounts of overreliance on numbers, because I predict a bias even in novel and open-ended situations such as 100&Change. Previous researchers have argued that people overvalue numbers because numeric dimensions provide more managerial control and oversight (Mazmanian and Beckman 2018; Michaud 2014), are more measurable (Merry 2016; Porter 1994), appear more scientific (see Bechky 2020), and can simplify work processes (Miller 2001) or even replace human work outright with numeric algorithms (Kleinberg et al. 2018; Logg, Minson, and Moore 2019; Stone et al. 2015). Instead, I propose that numbers have a pull on evaluators even in the absence of agreed-upon standards, the organizational pressures of conformity, established rubrics, or precommunicated rules of evaluation. The mere presence of numbers, or quantification, directly leads to greater focus on those aspects of the material that are being quantified.
Scope Condition 1: High Stakes
There are two interlinked scope conditions to the argument. First, the stakes must be sufficiently high. Evaluators must be motivated, thoughtful, and sufficiently committed to the correct outcome. The 100&Change competition meets this condition, because the judges were likely highly motivated. On one hand, these judges submitted scores independently and did not need to reach consensus (Azoulay, Graff Zivin, and Manso 2011; Lamont 2009), and they had no economic stakes in the MacArthur Foundation’s success (Stevens 2007). On the other hand, the decision was impactful because of the amount of grant money at stake and the winner-take-all structure of the competition. Also, judges probably wanted to be viewed favorably by MacArthur internal evaluators who would read their scores and reviews. There can be social stakes to decision making, in that evaluators often seek to identify not their personal favorite option but rather the one others will approve of most (Correll et al. 2017); this may have been part of the stakes for judges. Moreover, participation as a judge was voluntary, so those who volunteered were sufficiently committed to volunteer their time. Overall, even without the social pressures of a panel or committee, judges should be motivated enough to show the hypothesized effects.
Scope Condition 1: The higher the intrinsic or extrinsic motivation of the evaluator, the greater the tendency of the evaluator to focus on numbers in the evaluation material and thus to lead to behavior in accordance with hypotheses 1 and 2, subject to a minimum degree of scope condition 2 being met.
Scope Condition 2: High Uncertainty
The second scope condition is that the evaluator must face a sufficient degree of uncertainty. Uncertainty means the difficulty of assessing possible outcomes and the value of those outcomes. Decision makers may be uncertain if they lack knowledge about what outcomes are possible (what factors can go wrong in drug development?), understanding about how outcomes map to values (is blindness worse than malaria?), or information about the correctness of their estimates. When uncertainty is high, evaluators should rely more on heuristics that ease their cognitive burden; prior research has already shown that they rely more on gender as a status characteristic (Botelho and Abraham 2017), and I expect similar results for quantification. In other words, once an uncertainty threshold is met, the focus on numbers will be heightened.
Scope Condition 2: The greater the evaluator’s uncertainty in the determinants of quality of the target of evaluation, the greater the tendency to engage in behavior in accordance with hypotheses 1 and 2, subject to reaching a minimum sufficient motivation to do so (see scope condition 1).
When the scope condition of either high stakes or high uncertainty is not met, I would not expect that numeric information would improve evaluations or reduce variance. This can help explain why some prior case studies of decision making have not revealed the pattern I expect for 100&Change. For example, Huang and Pearce (2015) found that angel investors make investment decisions guided by “gut feel,” eschewing the use of more grounded or rigorous (quantitative) analysis. Angel investors face extreme uncertainty, fulfilling scope condition 2, but the stakes they face are low, not fulfilling scope condition 1. Investment decisions are entered into under the full expectation that the entire investment will, in most cases, be lost. Similarly, when nonprofit foundations issue many smaller scale grants over time—the traditional arrangement, although big-bets grant making is becoming more widespread (Foster et al. 2016)—quantification should not be as powerful a lens.
Application to the 100&Change Case Study
This problem of evaluating incommensurable objects is amplified in the nonprofit sector. By definition, the sector lacks market signals of value; consumers’ willingness to pay does not determine the value of famine relief, and the profitability of malaria prevention is not a guide to its efficacy. At the same time, foundations, as important funders in the sector, have received explicit calls to take inspiration from venture capital in their assessment of nonprofit organizations (Letts, Ryan, and Grossman, 1997). To behave like venture capitalists, foundations starting a relationship with a grantee would need to create financial and organizational projections with clear quantifiable performance measures. Nonprofit organizations respond to pressures from foundations when trying to earn their patronage (Ashley and Faulk 2010) and thus have begun to use strategic plans and independent financial audits and to employ business school graduates (Hwang and Powell 2009). These projections and performance targets become easier when the “investments” (i.e., the funded projects) are quantified.
Yet it is also widely accepted that outcome metrics in the nonprofit sector do a poor job of capturing what frontline workers find meaningful (Benjamin 2012). Even nonprofit organizations themselves may not believe their own program evaluations are useful tools for assessing value. For example, larger organizations may face stronger normative pressures to adopt evaluative tools, while smaller organizations may use evaluations to please specific funders they depend on (Carman 2011). Nonprofits vary widely in how much they use metrics-based program evaluation at all, because of such factors as whether they rely on federal government funding (Carman 2009).
Within this varied context, evaluators in the 100&Change grant competition face a complex task. They are expected to assess organizations engaged in very different charitable activities while setting aside personal convictions and preferences. Furthermore, the competition is brand new, meaning that none of the judges are familiar with this specific grant application form, increasing uncertainty. Finally, applications are randomly assigned to judges, meaning that most end up with judges who lack relevant expertise (e.g., a biology professor reviewing a legal defense fund). Given all of these factors, I predict that 100&Change judges will turn to commensurable features, specifically quantified information, as a guiding decision-making heuristic.
Alternative Hypotheses
There are at least four alternative evaluation standards that judges might follow. First, judges could look for proposals that attend to problems the judges perceive as critical. Judges were not punished or rewarded for strictly adhering to the proposed evaluative criteria and thus could have focused on their own values. For example, among the 10 or so proposals they reviewed, judges could have picked whichever ones felt the most pertinent to their personal interests.
Second, judges with different backgrounds (e.g., demographic features, employment histories) likely differed in their preferences for types of interventions and their approaches to assessing worth. We might expect each judge to bring heuristics from contexts in which they have either served as evaluators or have been evaluated themselves (Castilla and Ranganathan 2020). For example, each professor evaluates the proposals as if they were academic grant applications and each art critic as if they were works of art.
Third, competition scores might have reflected current trends in fashion or state of the art. Purportedly innovative solutions might be preferred, even if they did not seem impactful (Seelos and Mair 2017). Currently topical or popular intervention areas might garner broad approval.
Fourth, judges could have catered to their beliefs about the MacArthur Foundation’s preferences. Even though the judges were not affiliated with the foundation, they could have tried to infer the foundation’s preferences, for example, by looking at its past behavior. Thus, intervention areas the foundation funded in the past might score particularly highly.
Of these four alternative theories, the first two predict judges’ behavior on the basis of their individual preferences and biographies, and the second two posit social motivations to be objective and to achieve unanimity and harmony with the foundation’s values. Thus, under the first two hypotheses, we would expect the specific selection of judges reviewing a given proposal to determine its score, and under the second, we would expect a proposal’s topic area to determine its score. My empirical analyses account for these alternative hypotheses. None of the alternative hypotheses would predict evaluator convergence on the basis of how proposals use numbers.
Data and Methods
Data Construction
The 100&Change grant competition provided a fertile ground to test my theory. Previous studies of evaluative panels have focused either on ethnographic case studies of specific panels and their relatively few judges (e.g., Lamont 2009) or on quantitative analyses of anonymous panel decisions (e.g., Azoulay et al. 2011). The MacArthur data are unique because a different random selection of five judges evaluated each application. Any trends across the data set, then, could not be driven by the specific selection of judges. Moreover, the judges did not act as a deliberative panel, so their judgments were truly independent. Thus, this unique data set provided a test case for my theoretical hypotheses. I supplemented with data from tax records and the Foundation Center, discussed later.
Dependent Variable: Competition Score
Judges scored each of the applications in the sample on four traits: whether the proposed intervention was meaningful, verifiable, feasible, and durable. As noted above, 5 judges, selected at random from a pool of 412, scored each trait on a scale from 0 to 5 and provided a qualitative evaluation to support each numeric score. For my analyses, I took the average of these four trait scores and called this the competition score. I also jointly modeled these four scores’ relationship with the quantifier count (detailed later) and other covariates using seemingly unrelated regression models in Table A5 in the Appendix. The competition score was normally distributed and centered at 3. I hence had information on 798 organizations, their applications, and 3,990 scores and associated qualitative assessments.
Explanatory Variable: Quantifier Count
To operationalize quantification, I counted the occurrence of quantifiers in the applications materials submitted by each organization. I defined two types of quantifiers: concrete numbers (e.g., digits or spelled-out numbers) and vague verbal quantifiers. 1 I did not count dates or stylistic signposting with ordinal numbers (e.g., numbered lists) as quantifiers. Concrete numbers were weakly negatively correlated with vague quantifiers (correlation coefficient = −0.14). I included only these concrete numbers in my measure of quantifiers. Quantifiers were approximately normally distributed in the applications, centered at 30 but with a longer right tail.
Text-Based Controls: Readability and Technicality
Counter to my hypothesis, applications with more quantifiers could be rewarded simply because they are more technical. To control for this, I constructed a variable to capture the technical level of the submitted materials on the basis of the Flesch reading ease score (Flesch 1949). 2 A scientific journal would typically score less than 30 (see Hengel 2017), Reader’s Digest about 60 to 70, and a comic book greater than 90. In the application materials, technical level was normally distributed, with a median of 27.76 and a 90th percentile of 41, suggesting highly technical applications overall. In addition, to capture the processing difficulty evaluators might have had, I used the Simple Measure of Gobbledygook (SMOG) measure to estimate a reading grade level for each application (McLaughlin 1969).
Prior Funding
The Foundation Center collated information on whether applicants had received grants from organizations in its Foundation Directory Online (https://fconline.foundationcenter.org). Having received grants in the past might suggest a high-quality proposal from an organization with a proven track record. I controlled for whether an applicant had received prior funding from any organization in the directory, and specifically from the MacArthur Foundation. If judges were considering what they believed to be the MacArthur Foundation’s preferences, there should be a positive effect of prior funding. one ought to see a positive association here.
Organizational Type and Subject Area
Each applicant organization was classified as a for-profit business or a nonprofit. Although the grant was to fund a charitable project, for-profit organizations could still apply, and some did. I also distinguished universities and foundations from other nonprofit organizations. Finally, I used the subject area categories the Foundation Center later used to organize its online repository of applications (e.g., health, education). Each application was listed in one or more subject areas. I controlled for subject area in all analyses.
Size and Organizational Capacity
Applicants submitted financial statements along with their applications. These varied in quality and detail, and some organizations submitted nothing, either because they were newly formed or because they wanted to submit only if selected to a later round. For organizations that submitted sufficient data, I used total expenses and net assets as measures of size. For organizations that did not report these values, I used information from their tax records, when available. I hand-matched all 501(c)(3) organizations to their Internal Revenue Service form 990 (or 990-EZ) records in the 2016 Exempt Organizations Business Master File Extract. These two data sources yielded financial controls for 705 applications. The remaining 93 organizations are undoubtedly different: on average, they had a half-point lower competition score, were more likely to be for profit, and were much less likely to have received funding previously. As a robustness check, I report models excluding these organizations in Tables A2, A3, and A4.
To better capture each organization’s ability to use both existing resources and potential grant money, I constructed a measure of administrative overhead using a ratio of administrative expenses to program expenses. I could construct this measure for only 297 applicants, and I ran additional models separately on this subsample.
Judge Fixed Effects
Because each judge evaluated multiple applicant organizations, I controlled in all models for judge fixed effects (i.e., the tendency of specific judges to be more generous evaluators). The modal number of applications reviewed was 10, with a mean of 11.5.
Qualitative Readings of Judges’ Comments
A research assistant, naive to the research question and hypotheses, coded judge comments using RQDA software (Huang 2016). The themes thus identified structure the qualitative discussion of judge comments, complementary to my quantitative analysis.
Descriptive Statistics
Table 1 summarizes the distribution of the key variables in the data. Figure 1 visualizes competition scores (the average of scores across all five judges for each organization) against the number of quantifiers included in the proposal, both standardized. Each subfigure presents the same organizations, varying the visualization by features of the organizations. The upper right and lower left quadrants include those proposals that fit hypothesis 1: their score and number of quantifiers were both high or both low. The off-diagonals provide counterfactuals to hypothesis 1: organizations that scored high despite including few quantifiers (upper left) or scored low despite including many quantifiers (lower right).
Summary of Analytic Case.

Sources: MacArthur Foundation, Internal Revenue Service Exempt Organizations Business Master File Extract, and Foundation Center.
Note: NGO = nongovernmental organization; SMOG = Simple Measure of Gobbledygook.

Scatterplots of standardized score against standardized number of quantifiers, broken down along (a) organization type, (b) size as (the inverse hyperbolic sine of) expenses, (c) whether the applicant has been funded in the past, and (d) whether the applicant has been funded in the past by the MacArthur Foundation.
What types of organizations are in these off-diagonals? The subfigures show that all four quadrants include organizations of all types (foundations, public charities, schools, and businesses; Figure 1a), sizes (Figure 1b), and grant histories (Figure 1c). Figure 1b shows that proposals from larger organizations, as measured by total expenses, did better overall than small ones, and large organizations appear to dominate the upper left quadrant. Thus, it is not the case, then, that only large nonprofits with prior experience of funding competitions included quantifiers in their proposals. At the same time, some large and experienced organizations did not include quantifiers: the upper left quadrant includes proposals from large research institutions (Figure 1b), including large U.S. state universities and teams. The upper left quadrant also includes many organizations that had previously received funding from the MacArthur Foundation (Figure 1d). These findings are consistent with scope condition 2, regarding uncertainty: large organizations may have other means aside from quantifiers of reducing uncertainty about the quality of their project, and prior funding from the foundation should also reduce uncertainty. I discuss the off-diagonals further later.
Modeling Uncertainty
Ordinary Least Squares
I tested my first hypothesis with an ordinary least squares (OLS) model 3 of competition score on quantification, with the controls discussed above. Hence, I ran regressions of the form
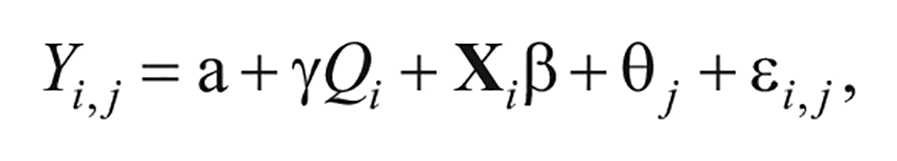

Where Yi,j is organization i’s score for a judge j, Q is the quantification score of the submitted application materials,
Variance Function Regression
The first hypothesis predicts that applicants with commensurable qualities should receive higher scores than those with less commensurable qualities. Equation 1 tested this hypothesis. The second hypothesis predicts that the lack of commensuration should increase variance in scores across judges and was not tested directly by equation (1). To test hypothesis 2, I ran variance function regressions (Western and Bloome 2009). This form of regression explains differences in heterogeneity between groups, as it fits linear functions for both the conditional mean and the conditional variance. The estimated coefficients from the conditional variance function reflect systematic differences in score variance between different groups of applications.
The variance function model relaxes some of the assumptions of the usual linear regression. Unlike the constant variance linear regression, the variance function model directly incorporates heteroskedasticity, allowing the residual variance to depend on covariates. Although the variance function regression is relatively general, the model assumes that the mean and variance are linear functions of covariates. A crucial assumption is that the mean and variance of observation Y are independent, conditional on covariates
Variance function regression can be estimated by first fitting a linear regression and then fitting a generalized linear model to the transformed residuals (Nelder and Lee 1991). First, I estimated the conditional mean function:

and computed the residuals from this regression. Second, I used a gamma regression—a type of generalized linear model suitable for positive right-skewed dependent variables—to estimate the coefficients of the conditional variance function:

where ε2 i,j is the square of the estimated residuals from equation 2. The point estimates with this method are consistent, but the standard errors are incorrect. In particular, the standard errors for the estimates of λ take no account of the uncertainty in γ and β, and estimates of γ and β are inefficient because they ignore heteroskedasticity in Y. By iterating on the two-stage method, I obtained efficient maximum likelihood estimates whose score vector produced the correct standard errors (Aitkin 1987).
Results
Evidence from Regression Analysis
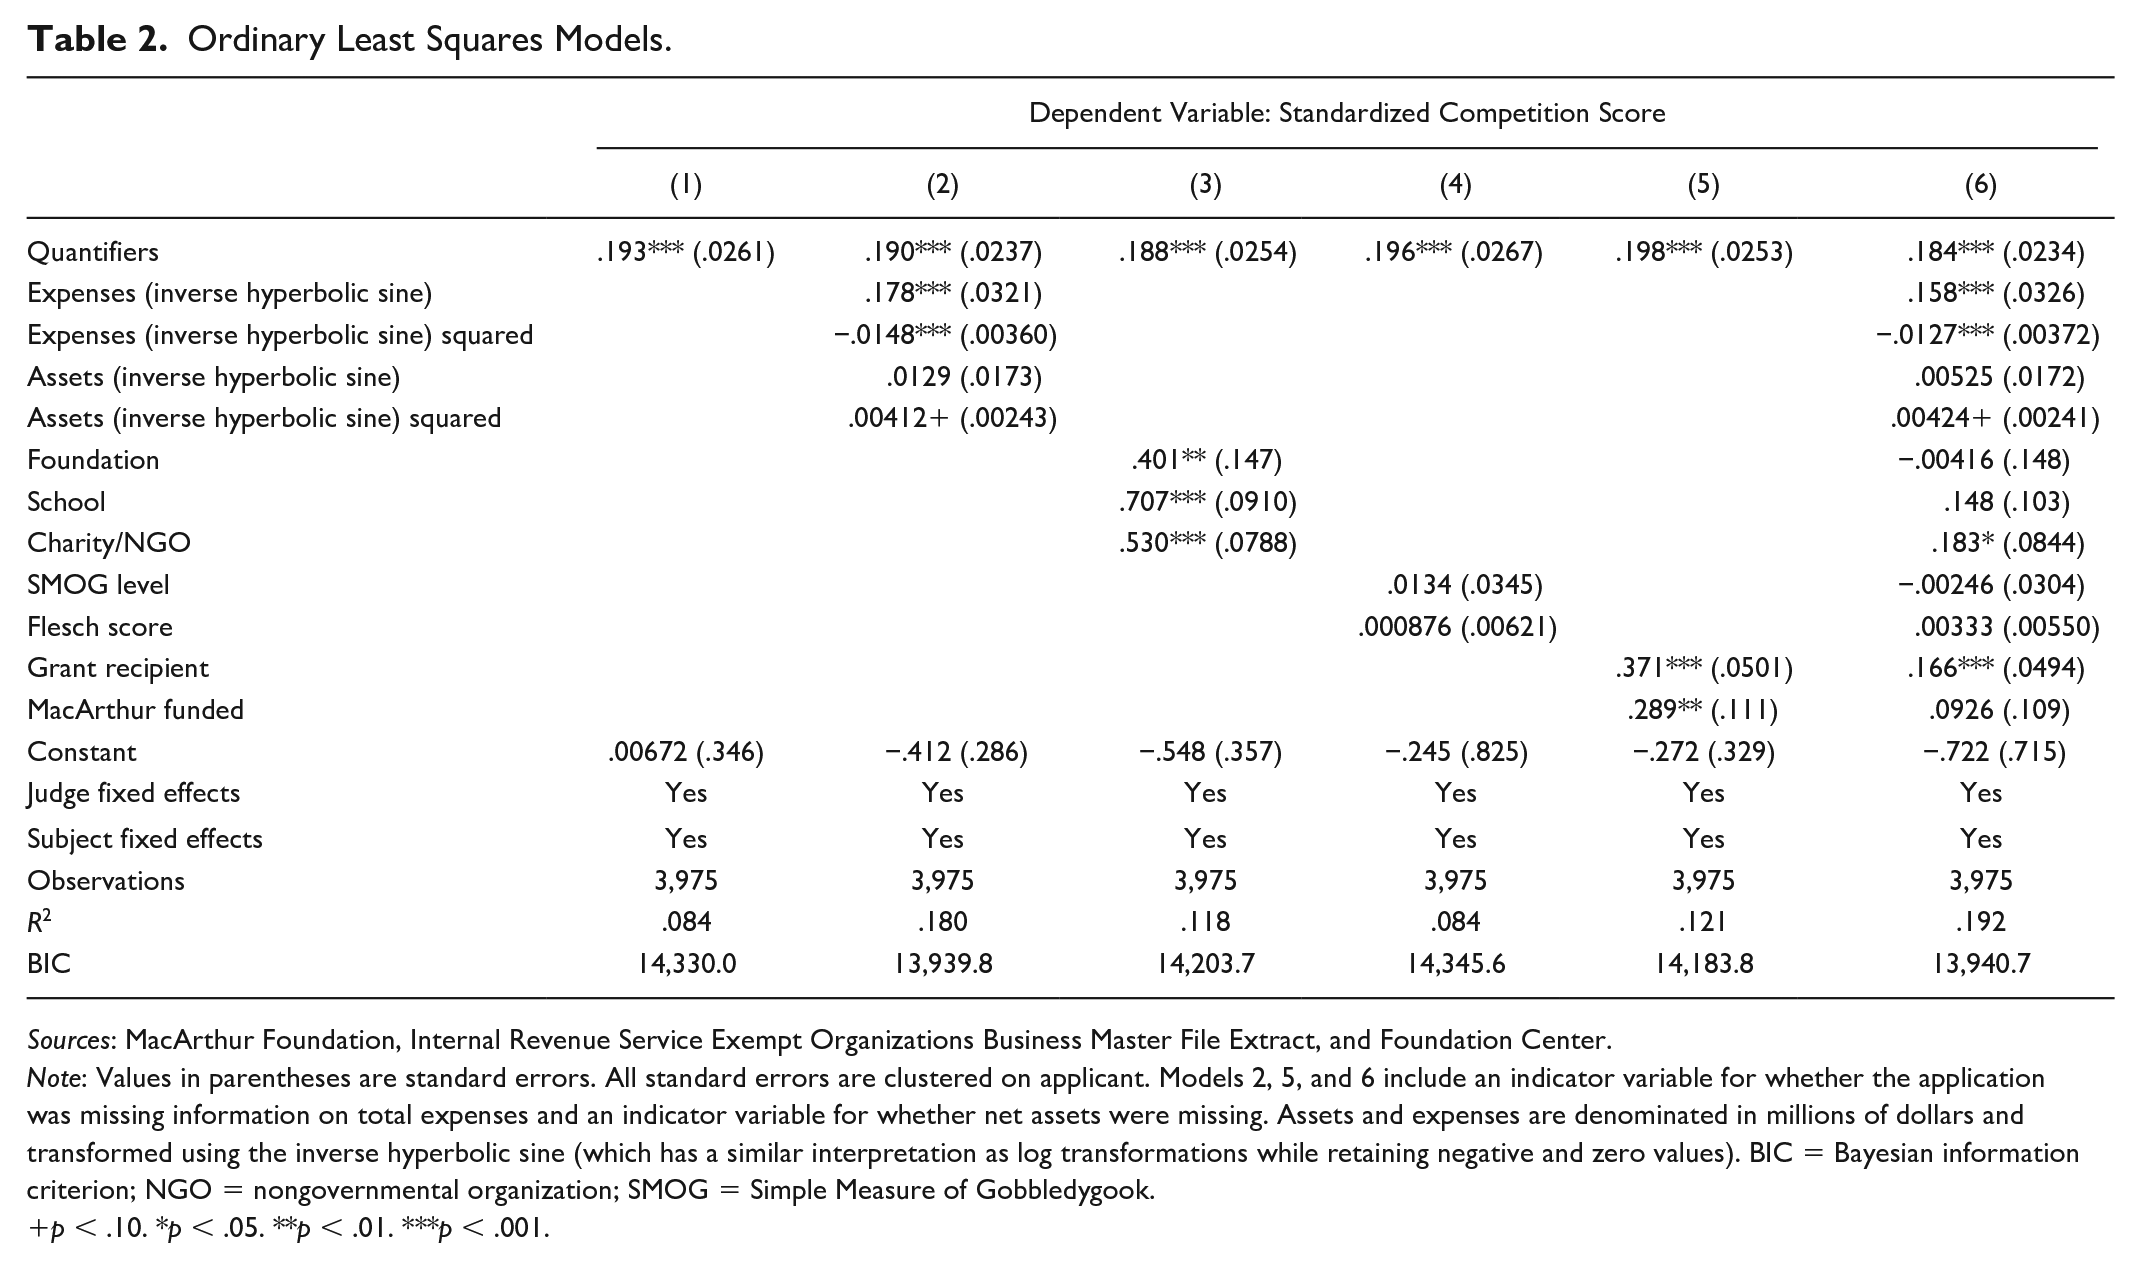
Table 2 shows the main results of OLS regression models as given in equation 1, which supported hypothesis 1. In model 1, controlling for subject area and judge fixed effects, quantifier use 1 standard deviation higher (mentioning numbers approximately 14 more times) was associated with a competition score 19.3 percent of a standard deviation greater (p < .001).
Ordinary Least Squares Models.
Sources: MacArthur Foundation, Internal Revenue Service Exempt Organizations Business Master File Extract, and Foundation Center.
Note: Values in parentheses are standard errors. All standard errors are clustered on applicant. Models 2, 5, and 6 include an indicator variable for whether the application was missing information on total expenses and an indicator variable for whether net assets were missing. Assets and expenses are denominated in millions of dollars and transformed using the inverse hyperbolic sine (which has a similar interpretation as log transformations while retaining negative and zero values). BIC = Bayesian information criterion; NGO = nongovernmental organization; SMOG = Simple Measure of Gobbledygook.
p < .10. *p < .05. **p < .01. ***p < .001.
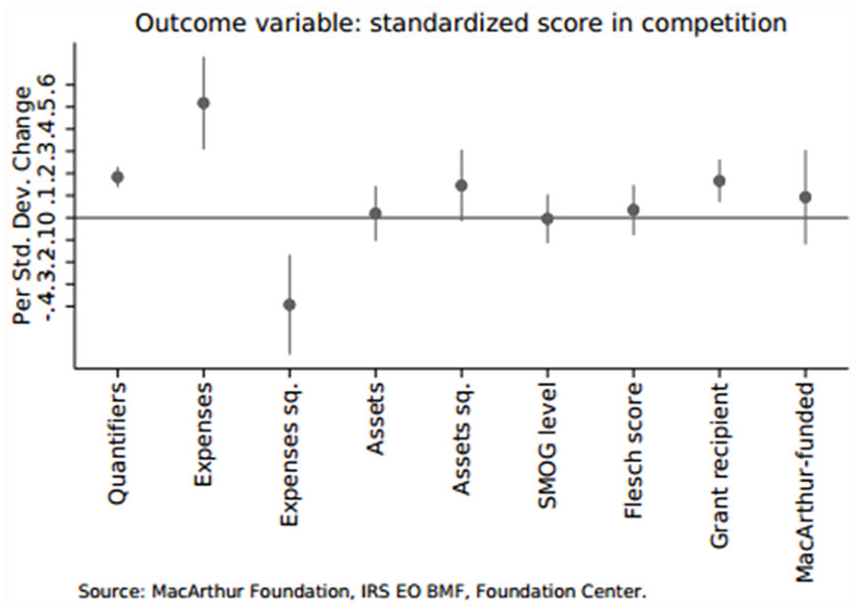
Coefficient plot for the equivalent of model 6 from Table 2 using explanatory variables (i.e., all continuous independent variables are standardized to mean 0 and standard deviation 1), for better comparability of effect magnitudes.
The coefficient remained significant and similar in magnitude in models 2 (adding financial controls), 3 (organization type), 4 (SMOG level and Flesch score), 5 (past funding), and 6 (all controls from models 1-5). In all models, a standard deviation increase in number of quantifiers was associated with a highly significant increase in score by approximately a fifth of a standard deviation (Figure 2.
I ran these same models on the subsample of applications with more detailed financial data. Findings are presented in Table 3. The coefficient for the presence of quantifiers was broadly stable across models for this subsample. Notably, in model 2, the effect of size as measured by expenses was no longer present, whereas administrative ratio was positively associated with competition score. This suggests that administrative ratio may be a better measure of capacity.
Ordinary Least Squares Models with Administrative Overhead.

Sources: MacArthur Foundation, Internal Revenue Service Exempt Organizations Business Master File Extract, and Foundation Center.
Note: Values in parentheses are standard errors. All standard errors are clustered on applicant. Assets and expenses are denominated in millions of dollars and transformed using the inverse hyperbolic sine (which has a similar interpretation as log transforms while retaining negative and zero values). BIC = Bayesian information criterion; NGO = nongovernmental organization; SMOG = Simple Measure of Gobbledygook.
p < .10. *p < .05. **p < .01. ***p < .001.
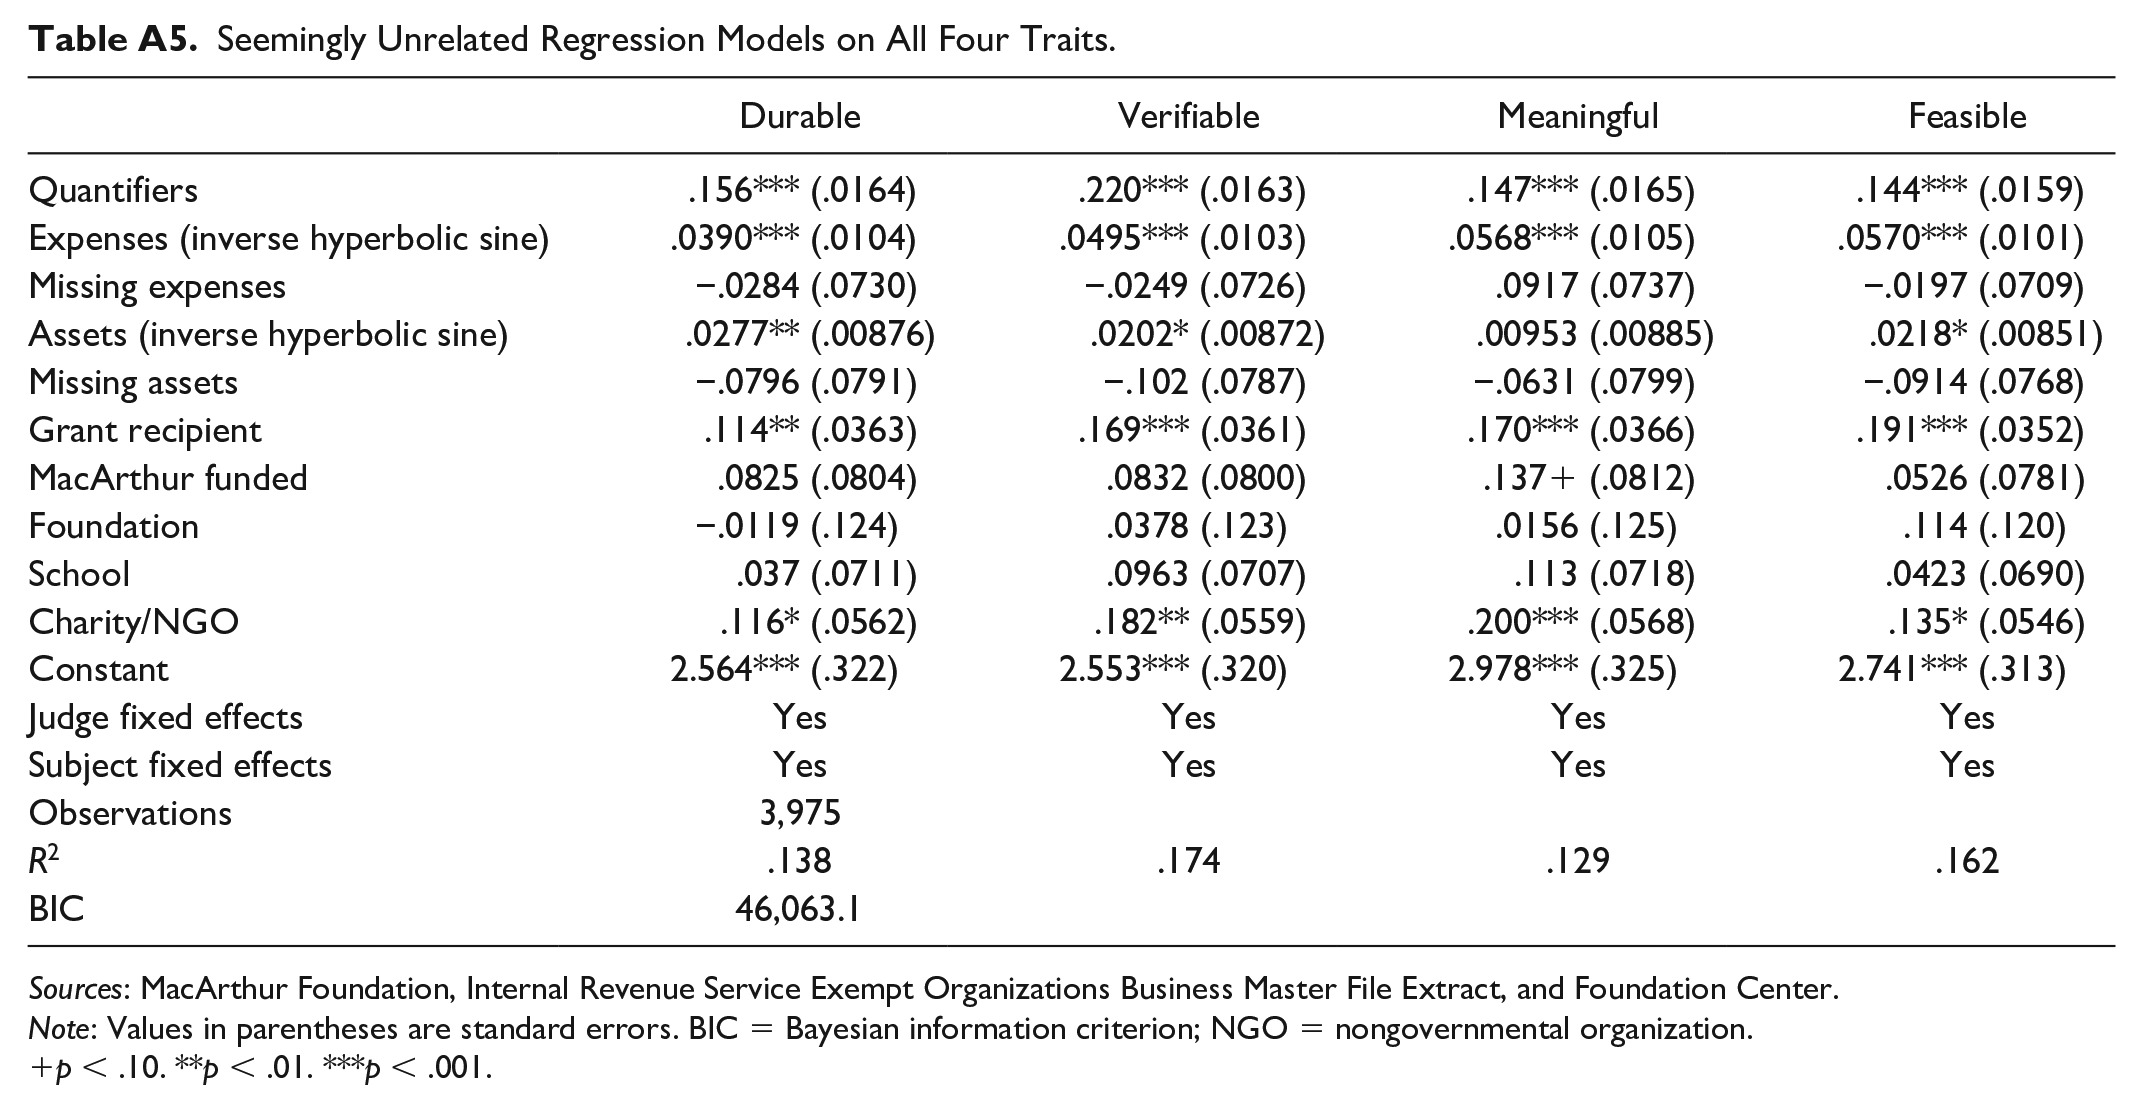
I also jointly modeled the relationship between the quantifier count and other covariates and the four components of the competition score, using seemingly unrelated regression models, in Table A5. All four traits showed similar relationships. Effect sizes ranged from 0.15 for “meaningful” to 0.22 for “verifiable.”
Quantifiers Reduce Uncertainty
Table 4 shows results of the variance function regression, as described in equation 3. The presence of quantifiers was again associated with an increase in the competition score. Furthermore, supporting hypothesis 2, the presence of more quantifiers was associated with reduced variance around the competition score. This effect was significant at the 0.1 percent level without subject area controls and at the 1 percent level with subject area controls.
Results from Uncontrolled Variance Function Joint Regression for Effects of Standardized Quantifiers on Standardized Score.

Note: Values in parentheses are standard errors.
p < .01. ***p < .001.
The judges’ open-text comments suggested that concerns about quantification, and its absence, indeed informed their evaluations. First, they expressed considerable uncertainty about appropriate scoring, and in turn this uncertainty produced a lower score. Two judges noted, I feel that I don’t know enough to truly assess feasibility of such a solution so my score reflects that. I don’t know enough about the domain to know whether the solution is durable.
Some judges did, however, opt for a different strategy. One judge commented that she gave a “neutral” score because she “just can’t evaluate” the relevant features of the proposal. Rather than penalizing the proposal, the judge gave it a middling score.
Some judges explicitly highlighted that the lack of quantified information contributed to their uncertainty: I am not an expert and so I don’t know how innovative a solution this is. Unfortunately, the proposal does not describe how much progress they will actually make. What percentage of the market will this penetrate? How does that translate into measurable difference in water or soil quality? Quality is X and this project will bring it up to Y. Without this, I can’t say whether the solution is bold or will significantly improve target beneficiaries.
This judge explicitly stated that he was uncertain about the quality of the application, and he further stated that quantified variables to measure impact (“quality is X and this project will bring it up to Y”) would allow him to assess it. In its current state, however, he gave the applicant a below-median score, presumably lower than what he would have given the same proposal with more quantified information.
Judges also used quantification to justify high scores. In praising applicants, many judges repeat numeric information from the application materials. This repetition suggests a shared belief that quantification legitimizes applicants’ proposals. In sum, the judges’ comments supported the hypothesis that judges penalize uncertainty, and quantification reduces uncertainty.
Counterfactual Quadrants
Despite these strong patterns, some organizations did land in the counterfactual quadrants: the upper left and lower right in Figure 1. Numbers may have heterogenous effects on evaluation for different types of organizations. Prior research has established that organizations, products, and professionals are evaluated according to different standards given established status markers. For example, hedge funds are evaluated differently on the basis of whether they are category conforming (Smith 2011), award-winning books are held to higher standards (Kovács and Sharkey 2014), and securities analysts are judged on different bases depending on their educational credentials (Giorgi and Weber 2015). In the 100&Change competition, it appears that numbers were an important lens for evaluating organizations that lacked other strong signals of quality.
Numbers are not the only way to reduce uncertainty. Without quantifiers, a proposal can still foster confidence through a clear, well-articulated plan, a credible team of expert executors, and scientific backing. One high-scoring proposal that included few numbers was commended for providing a “very detailed and well planned project that clearly has the potential for incredible impact on lives worldwide” with a “well-articulated approach and very credible solution based on clearly laid out prior research and findings and a clear methodology and approach” that is “definitely backed by significant science and verified methodology.” Here, the judges displayed little uncertainty and thus did not need to rely on quantified information to form an evaluation, supporting the importance of scope condition 2.
Strong, reliable teams, particularly those that had already won past funding competitions, also reduced uncertainty, rendering numbers less relevant. All five judges lauded one such team: Team seems very well equipped and balanced, with the right skills to deliver. The team seems world-class and fully qualified for this challenging endeavor. Strong existing team and body of work, along with a clear understanding of the additional people and equipment needed to take on a project of this scale. Excellent team and consortium.
Here, the strength of teams became the primary factor of distinction.
Even though numbers did not guarantee success, they were associated with greater certainty about quality—sometimes poor quality: The ratio of millions of actions taken to a couple hundred results and even fewer specific outcomes, suggest that the impact may be substantially less than the reach. I question whether they could grow from 3M users to 100M users in 6 or even 10 years as is outlined in the proposal. Essentially 100M users divided by $100M from MacArthur would seem to indicate an acquisition cost of $1 per person. I think the acquisition costs will be higher.
In other cases, applications with relatively many quantifiers were rated poorly if judges wanted even more quantifiers. Commenting on an application that provided 1.5 standard deviations more quantifiers than the mean, one judge commented that she “would have liked to have seen more concrete results and metrics”, while the other found the proposal was “not clear how success will be measured.”
Threats to Identification
Alternative theories could also predict some of these hypothesized patterns. First, applications with more quantifiers may have been evaluated more favorably if the use of quantifiers was spuriously associated with other features of the application or applicant organization, such as technical level, detail, or writing quality. These features could lead to higher scores for reasons unrelated to quantifiers. Inconsistent with this alternative, I found that the effect of quantification was robust to controlling for readability and technical detail and that technical detail was not closely correlated with quantification in the first place. 4
Second, applicant organizations that included quantifiers could also be different from other organizations. To generate precise numeric estimates, for example, an organization might need greater capacity, a more managerial mind-set, or prior grant-writing experience (Hwang and Powell 2009). Small organizations may not have the resources to finding numbers to put in their applications, and experienced organizations may have easier access to previously quantified information such as earlier interventions or pilot programs. Thus, when judges appeared to reward organizations for using quantifiers, they might instead have reacted favorably to these organizations’ greater organizational capacity, age, and experience. However, my results showed that the association was robust to controlling for capacity. Furthermore, and in line with other theories (e.g., Sørensen and Stuart 2000), capacity had a curvilinear association with grant success, with both young and old organizations being penalized.
Third, perhaps applications with more quantifiers do receive better evaluations, but not because quantifiers reduce uncertainty; rather, because they demonstrate professionalization or knowing “the rules of the game.” Judges could see quantification as a marker of quality: they may believe that organizations good enough to make use of the grant money should know to include numbers in their application materials. My results did indeed show an association between organizational capacity and use of quantifiers, consistent with this explanation. However, although controlling for organizational capacity and other possible proxies for underlying quality did improve my overall model fit (R2), it did not reduce the size of the direct effect of quantifiers on scores. This suggests that the unobserved variable of underlying quality cannot explain the results. 5 My findings were also robust to where in the application the quantifiers appeared: whether they were in the problem, proposed solution, evidence for the solution, or general summary of the project (see additional results in Table A1), suggesting that any numbers increased an application’s ratings even if they were not specifically quantifying the efficacy of the solution. Finally, the alternative explanation that quantifiers signal underlying quality (rather than reducing uncertainty) would not lead to predicting hypothesis 2: that quantifiers also reduce variance around the mean score. I found support for hypothesis 2 in quantitative analyses and furthermore in examining judges’ written comments. I found that judges discussed (lack of) quantification and commensurability more broadly in instances in which they expressed (un)certainty about the quality of the organization and (in)security about their own expertise. These results lend support to my proposed mechanism, as numeric content appeared to produce higher scores by providing commensurable information and reducing uncertainty, rather than by signaling capacity or underlying quality.
Discussion and Conclusion
I hypothesized that evaluators would turn to quantification as a feature that is easy to commensurate, specifically under conditions of high stakes and high uncertainty. I tested my hypothesis in a rich data set of ratings and comments from the MacArthur Foundation’s 100&Change grant competition, using OLS alongside variance function regression modeling plus a qualitative reading of the judges’ comments. First, I found that a more frequent use of quantifiers in the grant application materials was associated with a more favorable score. This association was prominent when judges were uncertain about the quality of applications and about their own expertise in the relevant area.
Second, quantifiers were also associated with lower variance in scores across judges. Proposals with few numbers might have gained a favorable evaluation from one judge but poor assessments from others, whereas proposals with more numbers received more uniform evaluations, be they good or bad. I showed that the use of numbers as a common lens of evaluation reduced uncertainty and increased agreement among judges. This relationship between quantification and conformity in evaluation has not been previously theorized or documented in the literature. Indeed, showing that difficulty of commensuration leads to higher variance in judges’ scores sheds light on the puzzle of why different evaluating bodies have responded so divergently in the past to similar situations (e.g., Fourcade 2011). Wide variance should be expected when no clear quantification can guide judges.
These evaluative patterns can create advantages for particular types of interventions. Figure 3 shows the distribution of numbers by the subject area of each proposal. Seven of the eight semifinalists of the 100&Change competition focused on health, education, or both. These are subjects that I found lend themselves well to quantification, along with housing and economic opportunity topics. Proposals in other subject areas, including peace, disasters, justice, and human rights, had fewer quantifiers. Such fields may be inherently hard to quantify. On what metric do we measure how much peace we have scaled? Disasters, by their very nature, are often incommensurable, one-off, grand-scale issues. Justice and human rights, too, might be considered invaluable and priceless (though see Merry 2016 on quantification of human rights issues). When evaluators focus on quantifiable metrics, these subject areas face an inherent disadvantage, despite how worthwhile they are. Even in the readily quantified subject areas, focusing on quantification could privilege immediate impact over more long-term and transformational interventions, obscuring worthwhile objectives even here. Quantifiable metrics may provide a seductive aura of scientific credibility, evidence basis, and objectivity, but falling too hard for them could come at a cost.

Number of quantifiers in proposal by subject area.
When evaluating charitable endeavors, judges experience many dimensions of uncertainty that activate the association between quantified information and more favorable and less dispersed assessment. Evaluators must assess whether an organization’s strategy is likely to be efficacious, feasible, and morally worthwhile. Which endeavors are meaningful must be constructed anew in each evaluative situation, depending on personal, organizational, and societal values and aims of funding projects. Karpik (2010) showed how musicians and doctors alike are evaluated by judgment devices, using qualities rather than prices, giving rise to a complex economy of evaluating uniqueness or singularity. The nonprofit sector combines the uncertainties inherent in both these fields: uncertainty about what the good is (what is good music?) and uncertainty arising from the perceived incommensurability of the outcome (how priceless is human health?). Moral worth, perhaps the most uncertain, is a signature feature of the nonprofit sector, whose activities cannot be justified by the bottom line per se (Weisbrod 1989).
We can expect evaluators to look for guidance from past evaluation procedures. Funding bodies shape their actions according to other funders’ past actions, and applicants tailor their applications to adhere to previous winners’ standards and formats. Just as schools elevate a dialect “by authoritative fiat” to an official language (Weber 1978:941), leading foundations’ evaluative criteria can become elevated and hence widely adopted. As a leader in the sector, the MacArthur Foundation used an evaluation design that, though popular for innovation competitions, for example (Boudreau, Lacetera, and Lakhani 2011; Murray et al. 2012), was unprecedented in the nonprofit sector. As other foundations and grant-giving bodies likely adopt this design and place big bets, its consequences will reverberate well beyond the 100&Change competition.
How far would the theory provided generalize to other funding competitions? Data analyzed in this article are from the initial round of evaluation in the competition. On the basis of the assigned scores, a finalist pool of 12 organizations was created, from which the foundation’s board chose a winner. Would numbers have mattered in the selection of the finalist? Although the selection of the finalist certainly carries high stakes and high uncertainty, my answer is no, but not because the board was now able to devote more time to evaluation and no longer needed to rely on numbers, or because they were now more intimately familiar with the organizations and could use other metrics. Instead, reminiscent of the findings of March and March (1997) regarding Wisconsin school superintendents, the earlier process of selection eliminated all variation at the top. March and March suggest that leaders are chosen almost randomly from a pool of indistinguishable managers. The finalists in the 100&Change competition were remarkably similar, certainly in terms of all having very high levels of quantification. These considerations suggest other important conditions for the generalizability of my findings beyond the nonprofit world. In many evaluative settings, such as school admissions or startup competitions, candidates have already been selected, and often algorithmically scored, on the basis of quantified information. Thus, an investor may choose on the basis of gut feeling, interpersonal connections, or social media presence (Ren, Raghupathi, Raghupathi 2020), because the choice might as well be random.
Experts now evaluate alongside other intermediaries, rankings, and crowd-sourced assessments (Sharkey, Kovacs, and Hsu forthcoming). In today’s evaluative marketplace, expert elites are as much consumers of these numbers as they are producers of them. Porter (1994, 2012) described how numbers are used by elites to justify their ends and themselves to nonelites, for example by using meaningless numeric targets to create an appearance of accountability. My case shows that elites, such as large funding bodies and the elite expert judges, also use numbers to justify decisions to themselves and others like them. Quantification not only provides a veneer of objectivity to external pressures, as Porter (1996) argued, but is internalized as the standard of objectivity. Other examples of this internalization abound. For example, Abend, Petre, and Sauder (2013) noted that one might find it puzzling that ethnographic research published in U.S. journals contains such a high degree of numbers, particularly compared with its Mexican counterparts. These numbers are performative, and they are a performance to other peer elites and to oneself, showcasing the acceptance of a specific theory of scientific objectivity and causality, valued by U.S. ethnographers. Future work on quantification and ratings should consider when ratings are a performance or signal for others and when to oneself and one’s peers.
I have shown that quantifiers serve as a lens of evaluation, garner better evaluation scores, and reduce the spread of scores. We should not, however, expect numbers to make evaluations objective with their Midas touch. Emergent evaluative standards, such as a focus on quantification, have the potential to shape what evaluators—and we more broadly—consider worthwhile. In the nonprofit context, this implies certain interventions will be considered worthier than others, not because of a considered judgment about the relative value of certain kinds of nonprofit activities over others but merely because of ease of evaluation.
Footnotes
Appendix
Seemingly Unrelated Regression Models on All Four Traits.
| Durable | Verifiable | Meaningful | Feasible | |
|---|---|---|---|---|
| Quantifiers | .156*** (.0164) | .220*** (.0163) | .147*** (.0165) | .144*** (.0159) |
| Expenses (inverse hyperbolic sine) | .0390*** (.0104) | .0495*** (.0103) | .0568*** (.0105) | .0570*** (.0101) |
| Missing expenses | −.0284 (.0730) | −.0249 (.0726) | .0917 (.0737) | −.0197 (.0709) |
| Assets (inverse hyperbolic sine) | .0277** (.00876) | .0202* (.00872) | .00953 (.00885) | .0218* (.00851) |
| Missing assets | −.0796 (.0791) | −.102 (.0787) | −.0631 (.0799) | −.0914 (.0768) |
| Grant recipient | .114** (.0363) | .169*** (.0361) | .170*** (.0366) | .191*** (.0352) |
| MacArthur funded | .0825 (.0804) | .0832 (.0800) | .137 + (.0812) | .0526 (.0781) |
| Foundation | −.0119 (.124) | .0378 (.123) | .0156 (.125) | .114 (.120) |
| School | .037 (.0711) | .0963 (.0707) | .113 (.0718) | .0423 (.0690) |
| Charity/NGO | .116* (.0562) | .182** (.0559) | .200*** (.0568) | .135* (.0546) |
| Constant | 2.564*** (.322) | 2.553*** (.320) | 2.978*** (.325) | 2.741*** (.313) |
| Judge fixed effects | Yes | Yes | Yes | Yes |
| Subject fixed effects | Yes | Yes | Yes | Yes |
| Observations | 3,975 | |||
| R 2 | .138 | .174 | .129 | .162 |
| BIC | 46,063.1 |
Sources: MacArthur Foundation, Internal Revenue Service Exempt Organizations Business Master File Extract, and Foundation Center.
Note: Values in parentheses are standard errors. BIC = Bayesian information criterion; NGO = nongovernmental organization.
p < .10. **p < .01. ***p < .001.
Acknowledgements
I thank the MacArthur Foundation for making this project possible. I am grateful for funding for this project from the Stanford Center on Philanthropy and Civil Society and the Stanford Interdisciplinary Graduate Fellowship for financial support while writing this article. Earlier drafts benefited enormously from discussions with Walter W. Powell, David S. Pedulla, Christof Brandtner, and Tamar A. Kreps. I am grateful for feedback from participants in the Networks and Organizations Workshop at Stanford University and the Stanford PACS seminar. I thank Manami Suenaga for excellent research assistance.
Authors’ Note
Previous versions of this article were presented at the 35th EGOS Colloquium in Edinburgh, Scotland, and at the 2019 American Sociological Association annual meeting in New York City.