
Abstract
Using a unique data set of millions of advertisements for rental housing and data on the geographic distribution of housing voucher holders, we examine the limits of housing market policies that rely on private-market landlords to meet public needs. We find that although advertised affordable housing is more prevalent in some zip codes than others, voucher households are more geographically clustered than affordable housing. Moreover, voucher holders are overly concentrated in “lower opportunity” zip codes, those with fewer resources for children’s well-being, despite the advertisement of affordable housing in higher opportunity neighborhoods. Using text-analysis techniques, we identify advertisements that explicitly accept or reject voucher holders and find that ads seeking voucher-holding tenants are overrepresented in lower opportunity neighborhoods. We evaluate the significance of these findings for theories of predatory inclusion.
Over the past 50 years, housing policies in the United States have focused on commodifying and marketizing housing itself and the financial means necessary to attain it (McCabe 2016; Pattillo 2013). Many of these novel policies—particularly ones that intervene in the market for rental housing—were in response to problems associated with concentrated poverty and, as such, were designed to expand housing consumers’ access to a wide set of neighborhoods (Khadduri 2001; Owens 2015; Tach and Emory 2017). The Housing Choice Voucher Program (HCVP), which has existed since the 1970s but was greatly expanded after 1998, is currently the largest federal rental assistance program, with over 2.4 million households receiving vouchers. The program requires low-income households to pay 30 percent of their income in rent, and the voucher, which is paid directly to the landlord, covers the remainder. Yet voucher holders continue to live in high-poverty, racially segregated neighborhoods (Metzger 2014; Schwartz, McClure, and Taghavi 2016). Why?
As a market-based policy intervention, the HCVP is constrained by the structure of the private rental market. Indeed, a great deal of research has revealed how policy interventions with the stated goal of increasing choice within markets have the unintended consequences of consolidating the power of private service providers (Centeno and Cohen 2012; Hacker 2002; Rich and Jennings 2015; Young and Chen 2020; see also Merton 1936). This is especially pronounced in housing markets where consumers are usually unaware of the full range of housing options available to them (Besbris 2020; Krysan and Crowder 2017), landlords exercise a great deal of discretion in to whom they lease their available housing units (Garboden and Rosen 2018b; Reosti 2021), and renters seek housing under various constraints (DeLuca and Jang-Trettien 2020; DeLuca, Wood, and Rosenblatt 2019; Harvey et al. 2020).
Recent research focuses on renter exploitation via exclusion: identifying the ways that landlords prevent poor renters from moving into certain housing units and/or neighborhoods (DeLuca, Garboden, and Rosenblatt 2013; Garboden et al. 2018; Garboden and Rosen 2019). Less attention has been paid to identifying inclusionary practices that may also exploit renters in an effort to draw profit. Predatory inclusion, a term developed by Taylor (2019), describes how the real estate industry creates products that vary in their terms in ways that exploit home seekers of color. Predatory inclusion practices often evade or even emerge as workarounds to policy solutions (e.g., antidiscrimination laws) and are thus particularly insidious. It is possible that landlords, in addition to discriminating against certain kinds of renters, also target certain kinds of renters for particular units. Such actions would be predatory if they provide already disadvantaged renters with intentionally narrow choice sets that include poor-quality housing in disadvantaged neighborhoods. In fact, in ethnographic fieldwork in a poor Baltimore neighborhood, Rosen (2014, 2020) found that some landlords seek out voucher holders for their worst quality units, typically located in high-poverty neighborhoods. Considering this past qualitative and theoretical work, in this article, we ask: Do landlords practice predatory inclusion for voucher holders? Are landlords’ practices potentially contributing to the unequal distribution of voucher holders across neighborhoods?
To answer these questions, we use computational techniques to generate a unique data set of online rental housing advertisements from Craigslist and gosection8.com, a website specifically advertising to voucher holders, posted in the 49 largest metro areas from August to October 2019. This allows us to compare the distribution of advertised affordable rental housing across zip codes within metro areas—advertisements theoretically available to voucher holders looking for housing—with the concentration of existing voucher households across zip codes. We expect a correlation between the supply of affordable housing and the location of voucher households. The absence of such a relationship would suggest that landlord advertising practices may attract voucher households into some neighborhoods and not others. To analyze landlord behaviors, we then use text-analysis techniques to examine the content of housing advertisements, focusing on language that explicitly welcomes or excludes voucher holders.
We find that the overall supply of affordable housing marketed online has only a modest relationship with the concentration of voucher households. Moreover, landlord advertising practices vary across neighborhoods in ways that correlate with voucher holders’ residential outcomes. Rather than being driven simply by the supply of available or advertised affordable housing, our results suggest that landlord practices that market particular units in particular neighborhoods specifically to voucher holders help explain voucher holders’ spatial concentration in disadvantaged neighborhoods. Using aggregate, combined measures of educational opportunity, health, and economic opportunity from the Children’s Opportunity Index to define higher and lower neighborhood opportunity (see Noelke et al. 2020), we find that landlords are more likely to use language welcoming voucher holders in advertisements for housing in lower opportunity neighborhoods and are more likely to use language excluding voucher holders in higher opportunity neighborhoods.
In addition to operating in the credit market, we find that predatory inclusion practices—actions that target disadvantaged consumers for more exploitative products—are present in the market for rental housing. By advertising directly to voucher holders, landlords are fulfilling one goal of the HCVP—providing low-income households with affordable housing—while at the same time potentially reproducing the underlying spatial concentration of disadvantage that the program is meant to reduce. Demand-side market-based solutions to housing inequality lead to adjustments in supply, and our findings suggest that landlords respond to the availability of voucher holders by refashioning the market in ways to maximize the profit and ease of leasing units located in areas that may be less desirable. 1 In addition to insights on the limits of demand-oriented policy interventions, we show how understanding the geography of opportunity requires attention to the market actors who have the power to sort home seekers.
Voucher Holders’ Residential Outcomes
Research over the past 25 years tells a fairly consistent story: Compared to public housing residents, voucher users live in lower poverty neighborhoods with fewer black and Hispanic neighbors, but voucher holders’ neighborhoods are poorer and have larger black and Hispanic populations than those of all renters (Galster 2013; Owens 2017; Pendall 2000). Voucher holders live in slightly more disadvantaged neighborhoods than other similarly low-income households (McClure and Johnson 2014; Metzger 2014), but evidence is mixed. Although nearly all neighborhoods (90 percent) are home to at least one voucher holder, voucher holders—especially black and Hispanic ones—are unevenly distributed and disproportionately represented in socioeconomically disadvantaged neighborhoods (Metzger 2014; Wang, Varady, and Wang 2008; Wilson 2013). Studies on neighborhood features beyond demographics show that voucher holders tend to live in places that likely offer less opportunity, especially for children, than all renters or other low-income renters and that voucher households are also clustered in higher crime areas (Hendey et al. 2016; Horn, Ellen, and Schwartz 2014; Lens, Ellen, and O’Regan 2011; Mazzara and Knudsen 2019).
What are the barriers that keep voucher holders in disadvantaged neighborhoods? The voucher program limits the time a household can search for a unit, and households often move off the wait list (after years of waiting) with little to no notice, forcing them to make potentially unanticipated residential moves in a short time window of 60 to 90 days. In contrast to more advantaged households who make deliberative moves, such “reactive” moves often lead to mobility into similar or more disadvantaged neighborhoods (DeLuca et al. 2019; DeLuca and Jang-Trettien 2020; Harvey et al. 2020). Quick searches also force voucher holders to rely heavily on their social networks—which likely include others with similarly low socioeconomic statuses—to learn about available housing, which may also contribute to their concentration in disadvantaged neighborhoods (Ellen, Suher, and Torrats-Espinosa 2019; see also McCabe 2018). Voucher holders often find it difficult to lease up and are prompted to expand the set of places they might potentially live to find a voucher-accepting unit. As a result, they prioritize unit features over less known neighborhood qualities (DeLuca et al. 2013; DeLuca and Rosenblatt 2017; Rosenblatt and DeLuca 2012). Under these circumstances, housing advertisements that mention the acceptance or denial of vouchers may be especially strong signals about the appropriateness of a particular unit (see Besbris, Schachter, and Kuk 2021; Boeing et al. 2021; Kennedy et al. 2021), and past research has shown that restricted search conditions and fear of discrimination lead voucher holding households to scan rental advertisements specifically for positive or welcoming language (Rosenblatt and Cossyleon 2018).
In addition to voucher program limitations and household-level barriers, voucher holders are constrained by the structure of the private rental market. Although total rental supply is increasing, supply of rental stock affordable to very low-income households is declining, and vacancy rates in the 2010s were lowest among rental units affordable to low-income households (Watson et al. 2017). HUD historically set Fair Market Rent (FMR), the rental cap for voucher holders, at the 40th percentile of the metropolitan area rental distribution and raised it to the 50th percentile in some large metropolitan areas in the early 2000s to promote geographic dispersal of voucher holders. Since 2018, HUD uses Small Area FMRs (SAFMR) in 24 metropolitan areas, which sets rent limits for zip codes or small geographic areas in an effort to assist voucher holders in moving to more expensive neighborhoods. Therefore, about 40 percent of the rental stock in each metropolitan area should be “voucher affordable” based on the historic FMR definition, plus or minus some fraction in SAFMR metropolitan areas. Analyses of Craigslist advertisements from 2014 and 2019 found that nationally, 35 percent to 37 percent of rental listings advertised rents below FMR (Boeing and Waddell 2017; Olsen 2019). However, there is considerable variation between metropolitan areas, and in many areas, fewer than 10 percent of units advertised online had rents below FMR. Affordability, however, is just one aspect of supply. Rental housing must be currently available and “adequate”—without physical problems to pass HUD inspection. In 2015, there were only about 74 affordable, available, and adequate units for every 100 households who could not afford to pay more than FMR (Watson et al. 2017).
Voucher-affordable housing is underrepresented in low-poverty, high-opportunity areas, and voucher households continue to be overrepresented in disadvantaged neighborhoods relative to the geographic availability of voucher-affordable units (Mazzara and Knudsen 2019; McClure 2010, 2013; Schwartz et al. 2016). 2 This indicates that factors beyond housing supply shape the locational outcomes of voucher holders.
The Role of Landlords and Predatory Inclusion
Although housing supply is a necessary condition for voucher households’ locational outcomes, the gatekeepers of housing supply—landlords—may matter more in determining where voucher households live. 3 In most states, landlords can legally refuse to rent to households with vouchers categorically, and landlords in higher opportunity neighborhoods are less likely to respond to voucher holders than other prospective tenants (Aliprantis, Martin, and Phillips 2019; Freeman 2012; Garboden et al. 2018; Hanson and Hawley 2011; Reosti 2020; Tighe, Hatch, and Mead 2017). Why landlords refuse voucher tenants varies. Smaller landlords report that leasing to voucher holders is onerous, adding time—due to the additional screening and required unit inspections—that could be saved by leasing to non-voucher holders (Greenlee 2014; Varady, Jaroscak, and Kleinhans 2017).
However, other research has shown that for certain types of landlords renting certain types of units, voucher holders might be particularly attractive tenants. In other words, there are various reasons why a landlord might seek out (i.e., ‘include’ in the predatory inclusion framework) voucher holders for certain units. Landlords charge voucher holders more than comparable non-voucher tenants, at a large cost to local housing authorities, and landlords have more power to inspect voucher-dedicated units and evict voucher tenants compared to non-voucher units and tenants (Desmond and Perkins 2016; Edin, DeLuca, and Owens 2012).
Rosen (2014, 2020) finds that landlords in Baltimore often work with community organizations and local housing authorities to target voucher holders, match them to lower quality units in less desirable neighborhoods, and then keep these tenants in units that would otherwise be difficult to rent due to their quality and location. Indeed, this work highlights how the voucher program more broadly leads to perverse market outcomes. Landlords with units in disadvantaged neighborhoods may desire voucher tenants because they are a guaranteed source of income, fill units that more advantaged renters would reject, and have trouble leaving because other landlords with more desirable units may refuse to rent to voucher holders.
Such a pattern would provide evidence of a distinct form of predatory inclusion. The term has previously been applied to the real estate industry creating different products that vary in their terms, with the most expensive products reserved for home seekers of color and financing housing consumption in nonwhite neighborhoods (Taylor 2019). Subprime mortgage lending provides a clear illustration of the phenomenon: Although there is a negative association between subprime lending and income for whites, the opposite is true for blacks and Latinos—even after the Great Recession—and more racially segregated black and Latino neighborhoods have a disproportionate share of high-cost mortgages (Faber 2013, 2018). Voucher holders are a disadvantaged, racialized group that may be subject to a theoretically similar process of predatory inclusion by landlords.
Appreciating the possible effects of landlords on the distribution of voucher holders is critical for several reasons. First, using our novel data, we are able to test whether the patterns documented in past qualitative work are widespread. That is, recent ethnographic studies (e.g., Rosen 2014, 2020) showing that landlords successfully target voucher holders for low-quality housing leads us to predict substantial overlap in the locations of advertisements recruiting voucher holders and the locations of voucher-holding households. If there is no relationship between where landlords advertise specifically to voucher holders and where voucher holders live, we can conclude that landlord advertising practices are not efficacious in determining voucher holders’ location outcomes. Second, if there is a relationship between advertisements and the geographic concentration of voucher-holding households, we can then examine whether the neighborhoods in which landlords seek voucher holders as tenants differ in terms of the opportunity they provide residents. Given past research on how landlords exploit low-income tenants (e.g., Desmond 2016; Garboden and Rosen 2018a; Greif 2018; Rosen and Garboden 2020), and voucher-holding tenants in particular (Desmond and Perkins 2016), we predict that these neighborhoods will have lower levels of opportunity.
The housing market remains a site of intense economic exploitation (Sullivan 2018) and information asymmetry (Besbris 2020; Krysan and Crowder 2017). If our predictions are borne out—namely, that landlords’ advertising practices correlate with voucher holders living in particular kinds of neighborhoods—we would effectively demonstrate how housing policies that seek to give searchers choice will likely fail in their efforts to widen access without simultaneous interventions that reshape the supply and advertisement of available housing. Lastly and relatedly, if we find that landlords are indeed welcoming voucher holders to lower opportunity neighborhoods while simultaneously discouraging them from applying for housing in higher opportunity ones, it would reveal that the housing market is rife with predatory inclusion—the targeting of certain vulnerable consumers for lower quality products at higher cost.
Data and Methods
To examine the relationship between landlord advertising practices and the distribution of voucher holders, we combine data on rental housing advertisements, policy-defined rent limits, voucher household location, neighborhood demographic characteristics, and neighborhood opportunity classifications for zip codes in the 49 largest metropolitan areas in the United States. Our data set includes over 1.5 million Craigslist ads and over 25,000 gosection8.com listings posted from August 1 to October 10, 2019.
We focus on listings posted to these two sites because qualitative studies of housing search processes in multiple metropolitan areas indicate that voucher holders use online listings from Craigslist and gosection8.com (Greif 2018; Harvey et al. 2020; Metzger et al. 2019). In addition, Craigslist is widely recognized as the most comprehensive platform for today’s metropolitan rental housing market, which overwhelmingly operates online (Boeing and Waddell 2017; Hess et al. 2021; Kroft and Pope 2014; Kuk et al. 2021; Schachter and Besbris 2017). The number of novel ads for rental housing on Craigslist has far outpaced any other source in many U.S. cities for over a decade, and Internet sites like Craigslist have become one of the most common ways renters find their housing—particularly renters with families and low levels of education (Besbris et al. 2021). We supplement our Craigslist data by also collecting listings posted to gosection8.com, a website explicitly designed for private-market landlords to advertise listings to voucher households. Gosection8.com partners with many housing authorities so that home-seeking voucher holders are directed to the site. We include gosection8.com to more accurately represent the online rental listings that voucher holders likely use when choosing a unit. Although our combined set of listings is not a census of all available rental housing in the private market, it is more comprehensive than any existing data source for representing the universe of listings that voucher holders use when searching for housing. We discuss potential biases the data and overlap between Craigslist and Gosection8 in the Appendix in the Supplemental Material.
Listings on gosection8.com and on Craigslist can be observed in real time—our data set is based on twice-weekly collection of all posted advertisements—and most postings include a geolocation. Across our metro areas, 12 percent of all listings are missing a geocode and are thus excluded from all analyses presented here. We use the geocodes to assign each advertisement to a zip code using spatial overlay with a census-provided shapefile that delineates zip codes. We use zip codes as our neighborhood definition because Craigslist ads that do not provide specific address information are geolocated to the centroid of their zip code, making it impossible to identify their true census tract. Although zip codes are larger than tracts, which are more commonly used in urban scholarship, they capture important submetro variation. In addition to location, we collected the listing date, rent (price), square footage and other rental unit characteristics, neighborhood name, and the full text of each advertisement.
We consider listings to be affordable if they are at or below HUD’s FMR values. 4 HUD provides FMR data at the county level and SAFMR at the zip code level by number of bedrooms in the unit, up to four bedrooms. We use HUD’s multiplier of 15 percent to estimate FMR for up to eight-bedroom units. We merge FMR and SAFMR to each listing’s geocoded county or zip code information, respectively. For ads missing data on number of bedrooms, we assign a mean of local FMR or SAFMR weighted by the distribution of the number of bedrooms. We classify each listing as affordable if its rent is below FMR, or if the listing is in one of the 24 metropolitan areas subject to SAFMR after 2018, if its rent is below SAFMR. Of 1.5 million listings, we exclude around 200 listings without price information and around 700 listings where the listed prices are over $25,000.
To examine landlord advertising practices, we classify Craigslist listings’ sentiment about vouchers using keyword searches. First, we search for listings that contain words referencing vouchers, such as “section 8” or “voucher.” 5 Second, we examine whether these listings include phrases that indicate positive or negative sentiment within a window of five words before or after the mention of “section 8” or “voucher” in the listing. Examples of typically negative sentiment about vouchers include “not accept section 8,” “section 8 not accepted,” and “sorry.” Typical positive mentions include “section 8 accepted” and “section 8 welcome.” 6 In Figure 1, we show example listings from Craigslist that contain a positive or negative sentiment about vouchers. About 2.5 percent of Craigslist listings mention vouchers. Out of Craigslist ads that mention vouchers, 71 percent of them are negative, and 29 percent positively mention vouchers. 7 We classify all approximately 25,000 gosection8.com ads as positive, because they are on a site specifically catering to voucher households, unless we find explicitly negative voucher language, which surprisingly appears in about .2 percent of ads on the site. 8 In our combined data set, then, more ads mentioning vouchers are classified as positive than negative, given that gosection8.com ads are nearly universally classified as positive. About 30 percent of the positive listings come from Craigslist, and 70 percent of them are from gosection8.com.

Example listings from Craigslist.
We create a zip code level data set that includes the total number of rental listings, the proportion of listings from each source (Craigslist or gosection8.com), the proportion of listings that are affordable, the proportion of listings that mention vouchers, and the proportion that mention vouchers positively or negatively. Next, we merge zip code level counts of voucher households from HUD’s Picture of Subsidized Households in 2019. These data include voucher holders living in zip codes at a point-in-time data collection in 2019 that may have occurred prior to our data collection of online listings. Although we ideally would compare online listing data to later voucher counts, we assume that the distribution of voucher holders and online listings did not change drastically in the time separating data collection. Finally, we merge on two sources of information about the zip codes’ resources and features. First, we merge demographic and socioeconomic data from the 2015–2019 American Community Survey 5-year aggregate data set, including racial/ethnic and immigrant composition, several indicators of socioeconomic status, and other neighborhood characteristics relevant to rental market dynamics, such as number and rate of rental units. We estimate a voucher rate for each zip code as the number of voucher households divided by total rental units. (We present descriptive statistics for variables used in analysis in the Appendix in the Supplemental Material.)
Second, we merge data that classify places by their opportunity level for children. Definitions of “opportunity” that use only population demographics (e.g., race, poverty rate; Besbris et al. 2015; Besbris, Faber, and Sharkey 2019) are problematic for various reasons, primarily that scholars often use characteristics of people to proxy for features of a place (Goetz 2017). The Children’s Opportunity Index (COI) goes beyond demographic features to classify places by the actual institutional, social, and environmental opportunities they provide for children. The COI classifies tracts into national quintiles of opportunity, drawing on three main multidimensional opportunity domains: education (local school availability, resources, and achievement level; adult educational attainment), health and environment (access to healthy food and green space, walkability, housing vacancy rate, toxic exposures, and local health insurance coverage), and economic opportunities (employment rate, commute duration, poverty, public assistance, homeownership rates, high-skill employment, median household income, and single-headed households; Noelke et al. 2020). An index is created for each domain, and then the three domain indices are combined into an overall score using weights that reflect the strength of the association between each indicator and future life outcomes: intergenerational mobility, health indicators, and life expectancy. We use the 2015 COI indicators and use tract zip code crosswalks provided by GeoCorr to link the COI quintiles to zip codes. 9 To create zip code level measures, we use population weights to aggregate tract quintile scores on each separate domain and the combined domain to their zip codes, relying on partial weights when zip codes bisect tracts. 10
We use descriptive analyses to address four empirical questions about the relationship between online housing listings and the locational outcomes of voucher households. First, what is the correspondence between the distributions of affordable housing listings and housing vouchers across zip codes? Second, what is the prevalence and spatial distribution of online housing listings that mention vouchers, and what is their sentiment? Third, what demographic, housing supply, and housing listing characteristics predict voucher rates? For this question, we run a series of linear regression models with Metropolitan Statistical Area (MSA) fixed effects that predict voucher rates. Finally, how does the spatial distribution of online listings and voucher rates correspond to measures of neighborhood opportunity? Briefly, we find that voucher holders are more geographically concentrated than the supply of affordable housing in zip codes with lower opportunity and that advertisements for rental housing are more likely to welcome voucher holders in the lowest opportunity neighborhoods. Although, based on our data, we can make no claims about landlords’ motivations or how voucher holders respond to ads, our findings do provide important empirical evidence across 49 metropolitan areas that we interpret as further support for the predatory relationship between landlord practices and voucher-tenant outcomes that has been described in previous qualitative and theoretical work.
Results
As shown in Table 1, about 42 percent of the listings in our sample were affordable to voucher holders, which is consistent with the typical voucher rent limit of FMR or SAFMR—the 40th percentile of the rent distribution in a metro area or zip code.
Prevalence of Affordable Online Listings and Voucher Households, 49 Largest Metropolitan Areas, 2019.

Note: N = 7,970 zip codes. Total rate for housing vouchers is the number of housing vouchers divided by the number of rental units. Average rate in affordable listing’s zip code is the average weighted by the number of vouchers in the zip code. Average rate in voucher household’s zip code is the average weighted by the number of affordable housing listings in the zip code.
At a given point in time, therefore, affordable housing seems well represented among the advertised supply, although affordable listing rates ranged from 11 percent in Los Angeles to 84 percent in Oklahoma City (with a median metropolitan area rate of 44 percent). Online affordable housing listings are not evenly distributed across metropolitan areas or zip codes. As Table 1 shows, the average and median affordable listing rate in zip codes, our level of analysis, is 52 percent, suggesting that many zip codes have affordable listing rates well above and well below the overall rate of 42 percent. Indeed, in 931 zip codes (≈12 percent), no listings were affordable. Clustering is further evident if we weight the zip code averages by their number of affordable listings—equivalent to an exposure measure. The average affordable listing is located in a zip code where 64 percent of other listings are also affordable, compared to the overall rate of 42 percent.
Table 1 also provides information on the prevalence of voucher households among all rental units. Our metropolitan area sample includes 1.7 million voucher holders in 2019, about three-quarters of all voucher holders in the United States. Voucher households occupy 6 percent of all rental units in our sample, and the median metropolitan area rate is also 6 percent. Again, we observe clustering at the zip code level—about 5 percent of the average zip code’s rental stock is occupied by voucher households, and in half of zip codes, the voucher occupancy rate is less than 3.4 percent. Not every zip code has the same number of voucher households. Weighting the average by the number of voucher holders reveals the degree of clustering: The average voucher household is located in a zip code where 11 percent of the rental stock is occupied by voucher holders, compared to the overall rate of 6 percent.
Weighted averages also provide the first examination of the colocation of affordable listings and voucher holders. The average affordable listing is located in a zip code where 6 percent of the rental stock is occupied by voucher holders. This is consistent with the overall rate, although slightly higher than the zip code level average. The average voucher household lives in a zip code where 54 percent of listings are affordable. This is higher than the overall rate of 42 percent, but only slightly higher than the zip code level average of 52 percent. Together, these results indicate low overlap in the location of affordable listings and the location of households with vouchers. Both affordable listings and voucher households are present in most neighborhoods, and although neither is evenly distributed across zip codes, voucher households do not live in neighborhoods where the affordable listing rate is extremely high. Indeed, the voucher rate and affordable housing rate are only weakly correlated (r = .152; see Table 3), underscoring how the supply of affordable housing alone does not explain the geographic distribution of voucher households.
Next, we examine features beyond listing affordability to understand potential explanations for voucher households’ locational outcomes. Looking at rental housing advertisement text, we find that about 4 percent of all listings specifically mention vouchers. This includes the 2.5 percent of Craigslist ads that mention vouchers and all gosection8.com listings (which make up 1.7 percent of all listings), which we classify as mentioning vouchers even if it is not explicit, given the target audience of gosection8.com. This rate varies across metropolitan areas, although the rate is 2 percent to 6 percent in most. About 2.3 percent of all listings in our sample (57 percent of those that mention vouchers) express positive voucher sentiment, and about 1.8 percent of all ads in our sample (43 percent of ads that mention vouchers) mention vouchers in a negative or deterring way. Among only Craigslist listings, negative mentions are more than twice as common as positive mentions (71 percent vs. 29 percent), but with the supplement of gosection8.com listings, which many housing authorities refer voucher households to, positive mentions are more common than negative mentions in our full universe of online listings. Zip codes where more Craigslist ads positively mention vouchers also have more gosection8.com online listings, indicating that landlord practices across the two online listing sources correspond. Regardless of source, these findings support previous studies showing that although some landlords refuse voucher holders, other landlords actively recruit voucher holders and that they do so using online listings.
Online listings mentioning vouchers are unevenly distributed across zip codes, present in only 3,779 zip codes (less than half) in the sample. Table 2, Columns 2 and 3, present zip code level means for all zip codes and only for those with any ads mentioning vouchers, respectively. Comparing zip code means to overall rates in Column 1 further reveals clustering—among the 3,779 zip codes with any voucher ads, vouchers are mentioned in 15 percent of ads. Strikingly, vouchers are positively mentioned in 10 percent of all ads (including all nonnegative gosection8.com ads) and negatively in only 5 percent of all ads on average in these zip codes, suggesting that landlords may seek to attract voucher holders to listings in particular areas.
Prevalence and Sentiment of Voucher Mentions in Online Ads, Craigslist and gosection8.com.
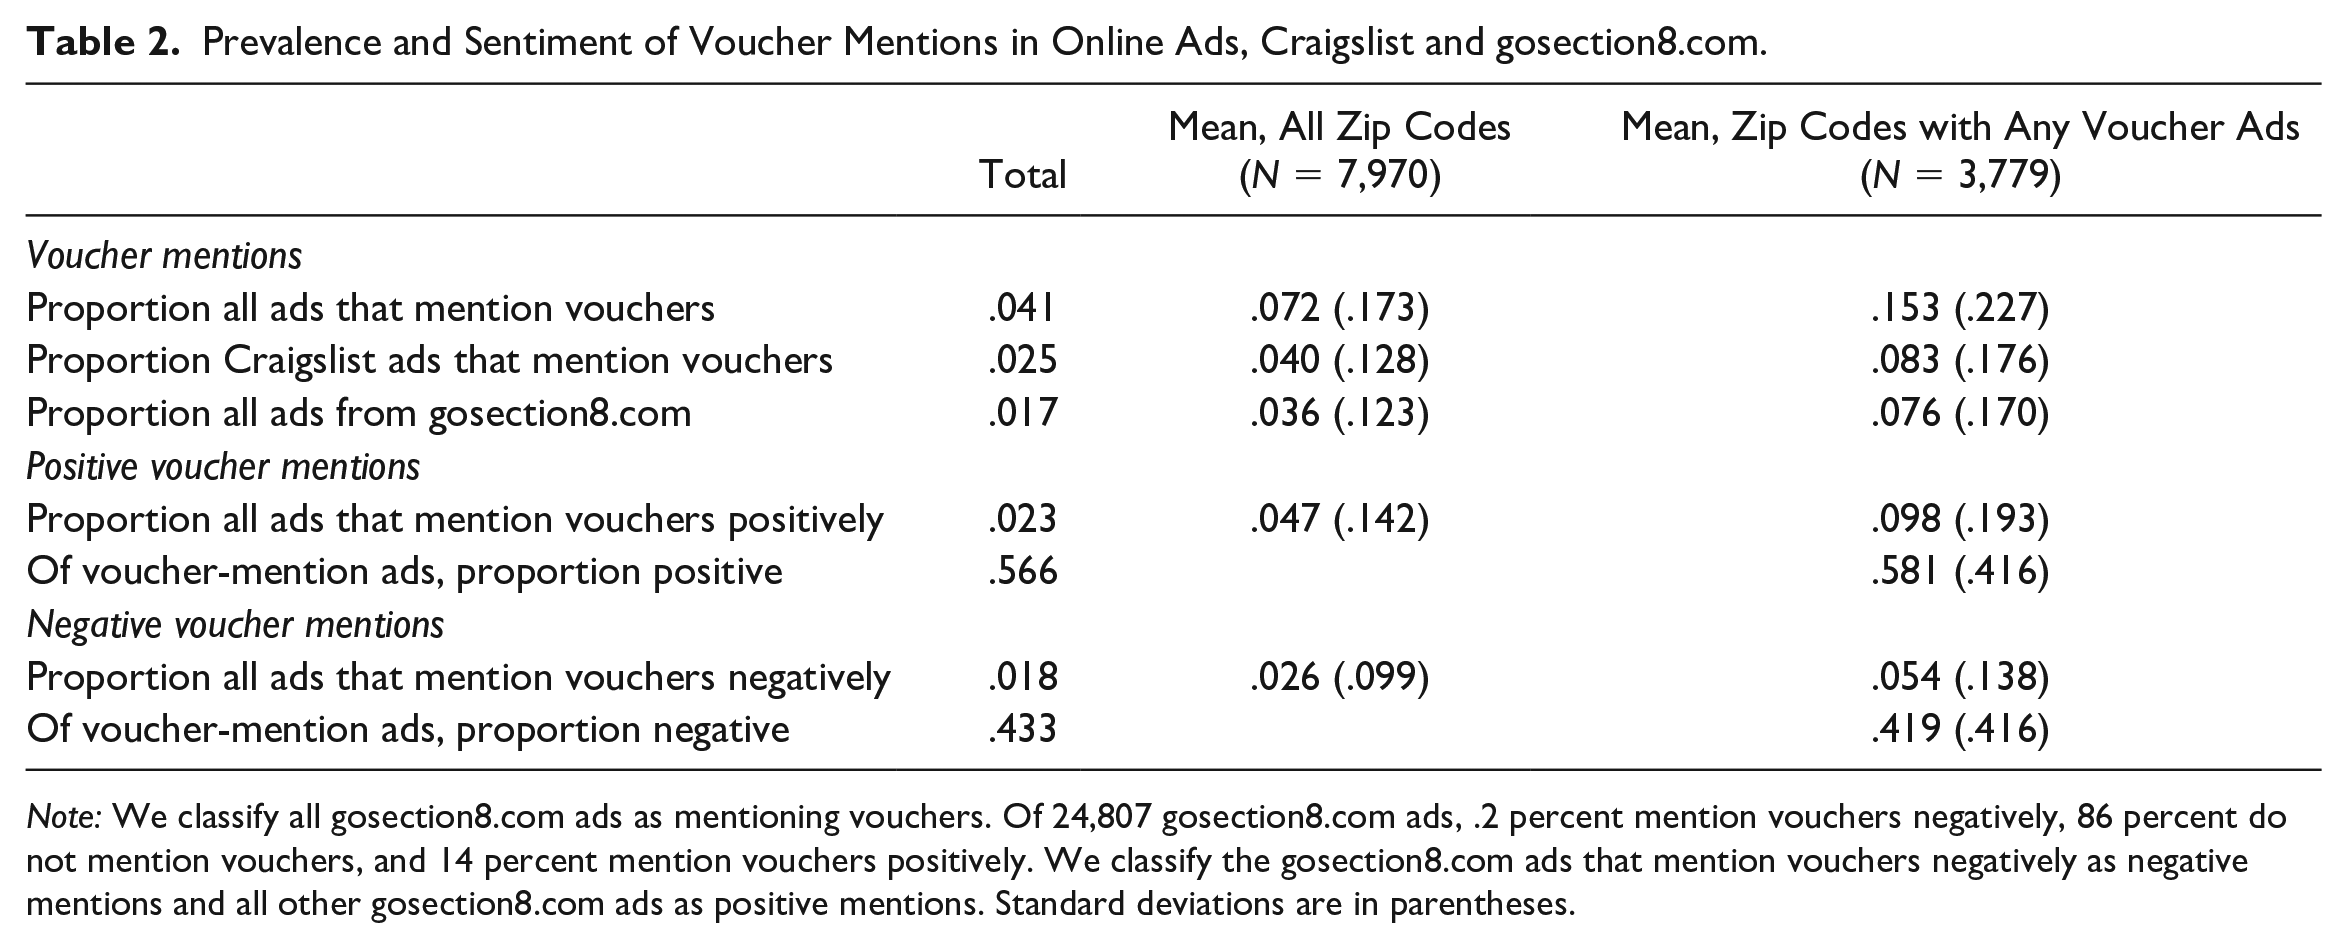
Note: We classify all gosection8.com ads as mentioning vouchers. Of 24,807 gosection8.com ads, .2 percent mention vouchers negatively, 86 percent do not mention vouchers, and 14 percent mention vouchers positively. We classify the gosection8.com ads that mention vouchers negatively as negative mentions and all other gosection8.com ads as positive mentions. Standard deviations are in parentheses.
Table 3 begins to explore the features of zip codes where voucher households, affordable listings, and voucher-mentioning listings are prevalent. The table presents correlations among zip code voucher rate, affordable listing rate, voucher mention rates, and demographic variables. Both voucher rates and affordable listing rates are higher in zip codes with lower median rent, higher poverty rates, and more black residents. However, voucher rates and affordable listing rates are only modestly associated with one another, as suggested in Table 1. To be sure, affordable listing rate measures advertised supply online, not available supply—a zip code could have a high rate of affordable listings but only a small number of available rental units posted online. This modest correlation between voucher and affordable listing rates may also indicate that online housing listings are not the only way that voucher households seek housing or that other variables influence whether voucher holders or nonsubsidized low-income renters live in particular neighborhoods.
Correlations among Voucher Rate, Online Listings, Housing Market, and Demographic Traits.
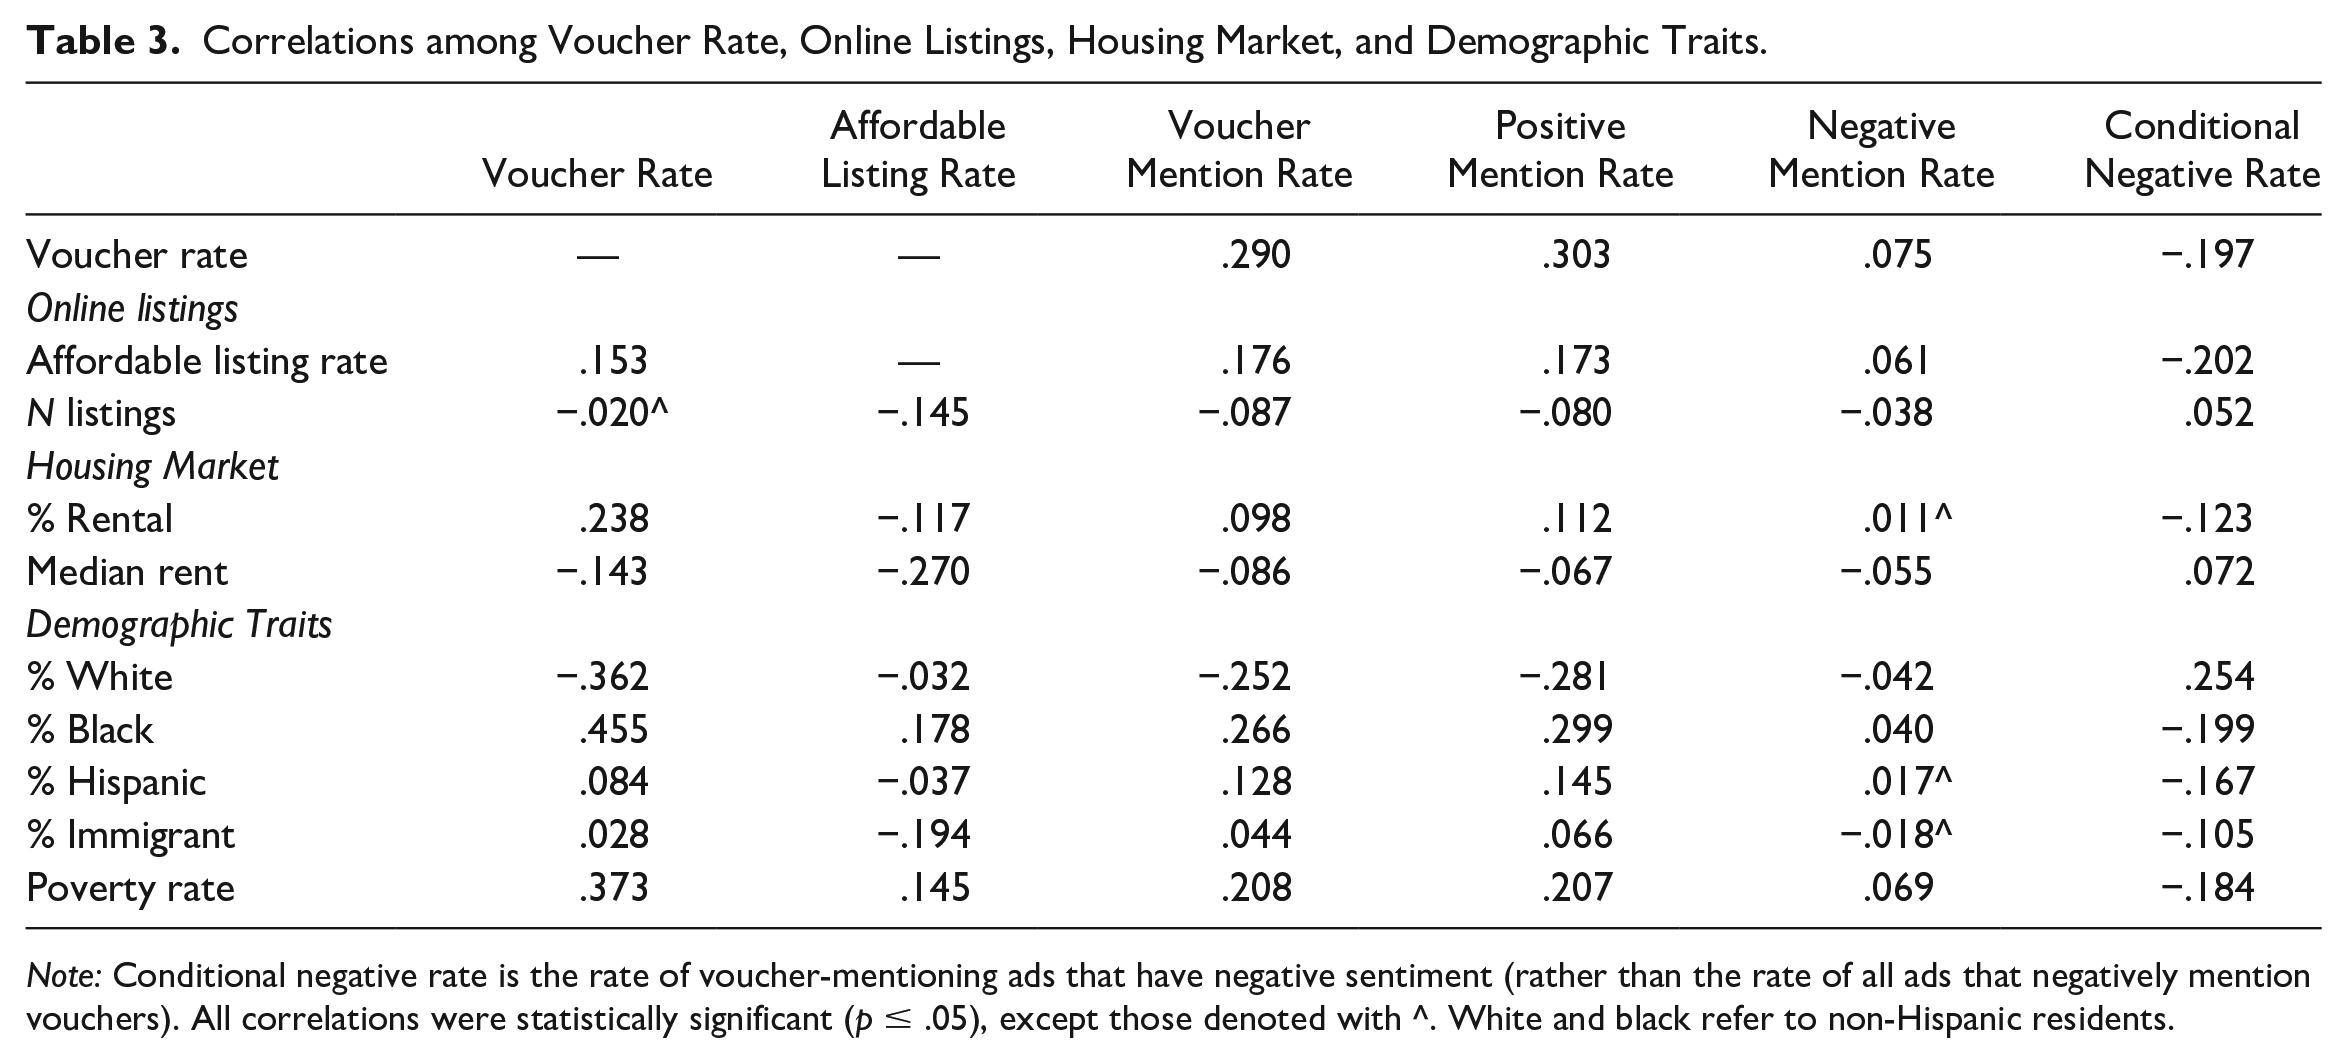
Note: Conditional negative rate is the rate of voucher-mentioning ads that have negative sentiment (rather than the rate of all ads that negatively mention vouchers). All correlations were statistically significant (p ≤ .05), except those denoted with ^. White and black refer to non-Hispanic residents.
Voucher rates are higher in zip codes with greater shares of rental units, whereas affordable listing rates are, surprisingly, lower in zip codes with higher proportions of rental units. Both voucher rate and affordable-listing rate are positively associated with the proportion of advertisements that mention vouchers in the ad text, the proportion of ads that positively mention vouchers, and, perhaps counterintuitively, the proportion of ads that negatively mention vouchers. This is the result of the small number of listings that mention vouchers—ads in fewer than half of the zip codes in our sample mention vouchers at all. Rental listings in most zip codes do not mention vouchers, perhaps because landlords assume their units and neighborhoods are inaccessible to voucher holders or landlords are not interested in participating but do not want to discriminate explicitly (or are prohibited from doing so by source of income discrimination laws). Landlords may also simply not think about vouchers at all when posting an ad, especially in higher cost zip codes. Zip codes with more ads that mention vouchers (regardless of whether these mentions are positive or negative) have higher poverty rates, fewer white residents, and more black and Hispanic residents, with weak relationships with rental rates and median rent. Conditional on having any ads that mention vouchers, zip codes with more negative ads have lower voucher and affordable listing rates, lower poverty rates, higher rent, and more white residents.
It seems, then, there are three types of voucher-mentioning landlord practices that map on to neighborhood features. First, fewer ads in higher socioeconomic status and whiter neighborhoods mention vouchers at all. Second, among ads that mention vouchers, landlords use negative sentiment in ads in some neighborhoods, actively excluding voucher households. Finally, among ads that mention vouchers, landlords discuss vouchers positively in neighborhoods that are poorer and less white than neighborhoods where ads are mentioned negatively. That is, among neighborhoods where voucher holders are likely to be searching for housing—lower socioeconomic status and less white neighborhoods that may be more affordable—landlords indicate positive sentiment for voucher holders in the most disadvantaged neighborhoods. We next examine whether features of online listings, conditional on housing market and demographic features that shape housing affordability and voucher holder search processes, influence voucher holders’ locational outcomes.
In Table 4, we predict the voucher rate (number of voucher households divided by rental units) in each zip code in linear regression models with MSA fixed effects. Fixed effects account for unmeasured variation across metros, including different source of income discrimination laws, different market dynamics, and metro demographics not included in our models. 11 Standard errors are clustered at the MSA level. We begin by examining the demographic features that vary with voucher rate in Model 1. Ethnoracial and immigrant composition are highly determinate for residential mobility in general (Krysan and Crowder 2017), and a robust literature shows that voucher holders tend to live in disproportionately black and Hispanic and higher poverty neighborhoods. As expected, we find that race/ethnicity and immigrant composition are associated with zip code voucher rate. A 10 percentage point increase in zip code proportion black corresponds to an increase of approximately .8 percentage points in voucher rate—a large increase from the overall 6 percent voucher rate. Conversely, a 10 percentage point decline in zip code proportion white corresponds to a voucher rate about .6 percentage points higher. The voucher rate is lower in zip codes with more foreign-born residents, perhaps because undocumented immigrants are not eligible for the voucher program and voucher use is lower among Hispanic and Asian residents, who are more likely to be immigrants, than black and white residents. The voucher rate is also higher in higher poverty neighborhoods, with each 10 percentage point increase in poverty rate corresponding with a 1 point increase in voucher rate. Model 2 adds in housing supply features—the proportion of housing units for rent and the median rent in the zip code. As expected, the voucher rate is higher in zip codes with lower rents. Number of rental units is accounted for in the denominator of voucher rate, so the negative coefficient indicates that zip codes with a greater proportion of rental housing have slightly lower rates of vouchers per each unit. Proportion black and white and poverty rate remain robust predictors.
Linear Regressions Predicting Voucher Rate, with Metropolitan Area Fixed Effects.

Note: Standard errors are clustered at the MSA level. White and black refer to non-Hispanic residents. In Model 5, difference between majority positive and majority negative is significant at p < .001. In Model 6, the sample includes only zip codes with any voucher-mentioning ads. Four zip codes are missing American Community Survey data on median rent and are excluded from multivariate models. MSA = Metropolitan Statistical Area.
p ≤ .05. **p ≤ .01. ***p ≤ .001.
We now turn to the role of online housing listings in predicting voucher rates. Model 3 adds the number of online listings in the zip code and the proportion of online listings that are affordable. The voucher rate is lower in zip codes with more online listings. This may suggest that the online listing market skews toward higher rent zip codes (Boeing 2020), although we do include gosection8.com ads that are specifically directed toward the voucher sector in our online listing count. 12 Examining the number of listings by data source (see Appendix Table 1, Model 1 in the Supplemental Material), the number of gosection8.com listings does positively predict voucher rate. The affordable listing rate is positively and significantly associated with voucher rate, with a modest magnitude suggesting the voucher rate would be 1 percentage point higher (compared to a 6 percent overall rate) in a zip code where all listings were affordable compared to one where no listings were affordable.
Models 4 through 6 examine voucher mentions in online listings. Model 4 shows that any mention of vouchers is positively associated with voucher rate. A 10 percentage point increase in the share of ads that mention vouchers in a zip code is associated with a .4 percentage point increase in the voucher rate. Higher shares of both Craigslist ads that mention vouchers and gosection8.com ads positively predict voucher share (see Appendix Table 1, Model 2, in the Supplemental Material available online.). Model 5 classifies zip codes into three categories: (1) zip codes with zero ads that mention vouchers (reference group), (2) zip codes where at least 50 percent of mentions are positive, and (3) zip codes where at least 50 percent of mentions are negative. As suggested by our discussion of results from Table 3, the voucher rate is higher in zip codes with both predominantly positive and predominantly negative voucher mentions compared to zip codes with no ads mentioning vouchers. The coefficient for zip codes with predominantly positive mentions is larger and significantly different than the coefficient for zip codes with predominantly negative mentions (Wald test of equality of coefficients not shown). Appendix Table 1, Model 3, in the Supplemental Material, shows these results hold when examining only Craigslist ads. Finally, Model 6 analyzes only the zip codes with any ads that mention vouchers and once again demonstrates that positive mentions are associated with higher voucher rates. A 10 percent increase in positive mentions is associated with a .04 percentage point increase in the voucher rate. Overall, although racial/ethnic, immigrant, and poverty composition are strong predictors of voucher rate, as past research shows, housing supply, the advertisement of supply online, and the sentiment of online housing listings in zip codes all appear to influence where voucher households live.
Finally, we examine what types of zip codes have high rates of affordable listings and high voucher mention rates to understand the implications of ads that may steer voucher holders to certain neighborhoods. We use the COI, a multidimensional measure of neighborhood quality that evaluates census tracts based on the opportunities they provide for children who grow up there. We aggregate tract-level COI quintiles to the zip code level using population weights to create a continuous “quintile score” ranging from 1 to 5 on a continuous scale.
Figure 2, top left panel, shows that voucher households are concentrated in zip codes in the lowest opportunity quintile (Q1), with a voucher rate nearly twice the overall rate in the sample. Similarly, affordable housing listings (top middle panel) are disproportionately advertised in lowest opportunity zip codes. Of note, about 40 percent of online housing listings in the highest opportunity zip codes are also affordable, but further analysis indicates that these zip codes have the lowest rental rates—25 percent of all housing units were rental units compared to 54 percent in the lowest opportunity areas. Furthermore, the top right panel shows that although the number of listings increases until Q4, the very highest opportunity neighborhoods have fewer listings. Therefore, rental supply may limit opportunities for low-income families to enter higher opportunity neighborhoods even though affordable listings are present.

Voucher rate and online listing features by opportunity quintile.
Compounding these supply features, landlords in lower opportunity zip codes seek out voucher holders. Over 20 percent of ads in lowest opportunity zip codes mention vouchers (bottom left panel of Figure 2), and over 15 percent of all ads do so positively. In comparison, fewer ads (less than 5 percent) mention vouchers in higher opportunity zip codes, on average. Six hundred seven of 908 lowest opportunity quintile zip codes include ads that mention vouchers, and the conditional positive rate among these zip codes is 75 percent. In contrast, only 519 of the 1,419 highest opportunity quintiles have ads that mention vouchers, and the conditional positive rate is 46 percent.
Altogether, our results are consistent with the argument that online listings influence where voucher holders live in ways that may cut off access to opportunity for residents. First, the relationship between zip code affordable listing and voucher rate is only modest—there is a mismatch between where voucher holders could potentially live and where they do live, suggesting that affordability alone does not determine where voucher holders reside. Second, some online housing listings explicitly mention vouchers. Although the overall rate is low (4 percent), the average voucher mention rate is 15 percent in zip codes where any ads mention vouchers. Discrimination against voucher holders remains a barrier to entry in many neighborhoods, but we find that vouchers are actually more likely to be mentioned positively than negatively in online listings when including websites, such as geosection8, that cater to voucher holders. Consistent with theories that predict vulnerable home seekers may be targeted for residence in certain kinds of neighborhoods, the voucher rate is higher in zip codes where more listings mention vouchers, and positive mentions of vouchers are disproportionately prevalent in neighborhoods that have lower opportunity. The voucher rate is 5 times higher in the lowest opportunity zip codes than the highest opportunity zip codes, and online listings that mention vouchers are also disproportionately prevalent in these areas, contributing to this clustering. Within the group of neighborhoods where ads explicitly mention vouchers, ads that explicitly include voucher holders are in lower opportunity neighborhoods.
Discussion
Originally designed as a program to allow low-income tenants more choice in the selection of their neighborhoods, in the hopes of deconcentrating poverty, the HCVP has not been entirely successful in integrating voucher households into higher opportunity neighborhoods. Because discrimination against voucher holders by landlords is common (Aliprantis et al. 2019; Freeman 2012; Garboden et al. 2018; Tighe et al. 2017), policymakers and scholars have advocated for new laws that require landlords to accept any tenant that can pay, regardless of their source of income. Such laws may, however, fail to integrate voucher holders into higher opportunity neighborhoods if landlords continue to positively advertise units in lower opportunity places to voucher holders.
Recent qualitative examinations of the voucher program have shown that some landlords are quite keen to attract voucher households for some of their available units (Rosen 2014, 2020). We reveal this phenomenon to be widespread. By analyzing both the distribution of affordable housing units across neighborhoods and the language in ads either excluding or welcoming voucher holders, we show that discrimination is but only one aspect of how the advertised supply of affordable housing might shape where voucher holders live. All landlords do not simply reject voucher holders outright; they exclude them from units in higher opportunity neighborhoods and actively welcome them in lower opportunity ones. Many factors, including voucher holders’ own search strategies and the supply of affordable housing, likely contribute to the distribution of voucher households across neighborhoods, but our findings reveal that landlords advertise housing in ways that are associated with voucher holders’ residential location. Because the majority of voucher holders are nonwhite, it is possible that landlord practices that screen, match, and steer voucher holders also impacts rates of residential segregation (Rosenblatt and Cossyleon 2018).
If the goal of the HCVP is to allow low-income households more choice and encourage mobility to higher opportunity neighborhoods, it is clear that more search and selection counseling is necessary. Such counseling could help expand the purview of voucher households’ searches beyond already known neighborhoods—information that may be limited by voucher households’ social networks (Ellen et al. 2019). Because counseling can also help match voucher households with amenable landlords in more integrated neighborhoods, it may help reduce segregation and allow voucher households more stability after their moves (Darrah and DeLuca 2014).
Our study is limited in that it does not directly test how voucher holders respond to positive or negative ads. However, past work indicates that voucher holders, constrained by the short time frames in which they must lease up and fears of discrimination, scan rental housing advertisements for positive language about vouchers (Rosenblatt and Cossyleon 2018), meaning it is likely the language in ads affects voucher households’ housing and neighborhood selection. Data on advertisement content and voucher holders’ mobility over time could better specify how ad language affects individual voucher households’ residential choices. However, it is likely that exclusionary language discourages home seekers with vouchers from applying for housing in places where such language is prevalent in ads. Past work has shown that home seekers avoid searching for housing in neighborhoods where they assume they will experience discrimination (Krysan and Crowder 2017). Furthermore, landlords who do not mention vouchers in their ads may still refuse to rent to voucher holders who apply or may seek to attract them to lower quality units. More research on landlord screening and selection practices is therefore warranted (see Rosen, Garboden, and Cossyleon 2021).
Our findings do provide evidence for systematic predatory inclusion in the rental market. Although the term originally referenced real estate industry practices that provided black home seekers with credit to purchase poor quality homes in distressed and segregated neighborhoods on unfavorable terms (Taylor 2019), we show that the rental market is similarly a site where legal, ostensibly inclusionary actions by private market actors may contribute to the concentration of voucher holders in lower opportunity neighborhoods. Practices of predatory inclusion—where disadvantaged groups are affirmatively steered toward more exploitative products—reveal the limits of market-based solutions to problems of integration and inequality.
Although a robust line of research suggests that marketization has detrimental (and unintended) effects on consumers (Polanyi 1944; Young and Chen 2020; see also Merton 1936), our findings reveal how subsidizing choice in already asymmetrical markets may have the unintended consequences of increasing the power of profit-seeking suppliers unless simultaneous interventions mandate more equitable provision of goods. It is possible that a private market will never adequately provide housing for all (Engels 1935), but what decades of the HCVP have revealed is that simply giving the most disadvantaged home seekers more market power does not lead to residential integration. With the geography of opportunity in contemporary American cities so profoundly segregated (Bischoff and Owens 2019), it seems doubtful that the HCVP or any other program that does not address supply will succeed.
Supplemental Material
sj-docx-1-srd-10.1177_23780231221079001 – Supplemental material for Predatory Inclusion in the Market for Rental Housing: A Multicity Empirical Test
Supplemental material, sj-docx-1-srd-10.1177_23780231221079001 for Predatory Inclusion in the Market for Rental Housing: A Multicity Empirical Test by Max Besbris, John Kuk, Ann Owens and Ariela Schachter in Socius
Footnotes
Supplemental Material
Supplemental material for this article is available online.
1
Studies of race and steering in housing are instructive: A long history of racial exclusion is ingrained such that market actors are incentivized to reproduce racially exploitative outcomes (Besbris and Faber 2017; ![]() ).
).
2
About 20 percent to 30 percent of voucher-affordable housing is located in advantaged neighborhoods, but voucher households do not always end up in these units.
3
4
Local housing authorities have some flexibility around the rent limit, setting Fair Market Rent (FMR) at the 50th percentile of the rental distribution or defining the payment standard (rent limit) as 90 percent or 110 percent of FMR. Data on local payment standards are not available, so we use FMR.
5
We included variations of “section 8” to improve accuracy of the keyword searches. Any listings that include “section8,” “section 8,” and “section 8” are classified as listings that mention section 8 vouchers.
6
In Appendix Table 4, in the Supplemental Material, we show that having a wider 10-words window does not change the overall results.
7
We classify voucher-mentioning listings that do not include explicit negative sentiment as positive even if they do not include welcoming language. Some listings simply list “section 8” as part of the features of the unit, indicating vouchers are accepted.
8
This is likely due to landlords copying and pasting ad text onto multiple websites. Some listings contain negative language because the landlord is willing to accept only certain types of vouchers when there are multiple municipalities that issue vouchers.
10
Results are substantively identical if we estimate quintiles within metropolitan areas; we use national quintiles because our metropolitan area definitions differ slightly from those used by the Children’s Opportunity Index.
11
Our metropolitan areas are defined by local Craigslist sites. Analysis of variance components suggests that about 15 percent of variance occurs between metropolitan areas across models, with the remaining 85 percent occurring between zip codes, within metropolitan areas. Future research could examine variation in our findings across metropolitan areas.
12
In our sample, there is a weak but positive correlation between median rent and both total number of listings and number of Craigslist listings.
Author Biographies
References
Supplementary Material
Please find the following supplemental material available below.
For Open Access articles published under a Creative Commons License, all supplemental material carries the same license as the article it is associated with.
For non-Open Access articles published, all supplemental material carries a non-exclusive license, and permission requests for re-use of supplemental material or any part of supplemental material shall be sent directly to the copyright owner as specified in the copyright notice associated with the article.