
Abstract
Research shows that social class differences in high school sports participation are large and growing. However, focusing on sports participation may obfuscate large social class differences in sports performance among participants. The authors develop theoretical predictions on the basis of exclusion (middle-class youth perform sports better) and inclusion (working-class youth perform sports better). To test these predictions, the authors analyze the relationship between high schools’ social class composition and success in high school athletics using data on more than 200,000 contests in school fixed-effects models. The findings indicate that predominantly middle-class schools beat economically integrated and predominantly working-class schools by large margins, supporting exclusivity perspectives. Also, predominantly working-class schools win as much as economically integrated schools, providing evidence of inclusion, but inclusion is much weaker than exclusion. The authors conclude that sports performance among youth is highly stratified by social class.
Each year, about 7 million high school students at 19,000 schools participate in interscholastic athletic contests sanctioned by the National Association of State High School Federations (NFHS 2018). These contests involve tens of thousands of adult coaches, referees, administrators, custodians, and volunteers working in tens of thousands of fields, courts, and swimming pools. Between 1986 and 2013, 60 percent of youth participated in interscholastic sports (Meier, Hartmann, and Larson 2018). Interscholastic athletic competition is a substantial component of many high schools’ official cultures (Eckert 1989; Foley 1990).
Researchers examine the causes and consequences of high school sports participation, showing that as economic inequality in the United States grows, social class differences in high school sports participation are widening as well (Meier et al. 2018). This means that working-class 1 youth are increasingly excluded from the benefits of participation. However, the focus on participation may also obfuscate social class differences in sports performance. Sports performance, a cultivated and learned skill set rather than a genetic or inherited characteristic, is itself related to important outcomes. Sport performance—how well a person plays a sport—is used as grounds for assignment of awards, honors, and entry to exclusive groups (e.g., college athletic participation and athletic scholarships), so sports performance may also be related to social class (Friedman 2013; Thompsett and Knoester forthcoming).
Nevertheless, we know little about the distribution of sports performance throughout the population of youth. In this article, we analyze the distribution of sports performance specifically in relation to social class. We use two theoretical perspectives. The first, which we call exclusivity perspectives, maintains that middle-class families use their cultural, social, and economic resources to improve their children’s sports performance so that their children reap rewards that will help them maintain their social ranking (Chin and Phillips 2004; Friedman 2013; Stempel 2005; Weininger, Lareau, and Conley 2015). The second, which we call inclusivity perspectives, holds that working-class youth are better at sports because they erroneously believe it is a path to success or they use athletic competitions to challenge their subordination (Edwards 1986; Eitle 2005; Eitle and Eitle 2002; Giulianotti 2015; Messner 1990).
We test these perspectives by examining the relationship between schools’ social class composition and their success in interscholastic athletics using data from an online social media site, ScoreStream, which has information on about 12,000 schools and 200,000 contests in football, basketball, soccer, softball, baseball, volleyball, and a few smaller sports. We measure schools’ social class student composition and other school characteristics by attaching data from the Common Core of Data and the Private School Universe Survey. We control for school resources, size, and racial composition as well as unmeasured characteristics of schools in school fixed-effects models. We estimate models for boys’ and girls’ sports because some researchers argue that social class interacts with gender in sports participation (Dumais 2002; Eitle 2005).
We find that for boys’ and girls’ sports, predominantly middle-class schools (PMCSs) beat economically integrated and predominantly working-class schools (PWCSs) by large margins, supporting exclusivity perspectives. We find that PWCSs win as much as economically integrated schools, providing evidence of inclusion, but inclusion is much weaker than exclusion. We conclude that sports performance is stratified by social class even among participants. We argue that these findings have theoretical implications for cultural capital theory and the relationship between social class and school culture.
We begin by reviewing the place of sports performance in sociology. Then we discuss theories of exclusivity and inclusivity. As we are trying to estimate the effects of social class at the school level, we also discuss the other characteristics of schools that influence sports performance. The methods, results, and discussion sections follow.
Sports Performance as Skill
Many academic fields study sports performance, including psychology, physiology, and management. Most of this research is applied (rather than basic science) and explicitly or implicitly aims to improve sports performance, ignoring its relationship to social inequality. Sociologists indirectly study sports performance by illustrating the negative consequences of an excessive and intense culture focused on ability and winning. This culture reduces athletic participation rates, intensifies participation for a small, elite group, and is criticized for reinforcing forms of social inequality such as elitism and patriarchy (Anderson 2013; Clark 2012).
Studying how sports performance relates to social inequality is an untapped area of research. Unlike sports participation and other forms of cultural capital (defined later), sports performance can be examined using precise continuous measures. For example, the World Tennis Association ranks hundreds of players; the NCAA ranks the top 68 of the more than 300 Division I basketball teams; and scores of Web sites analyze the past performance of teams and individuals to make predictions for gamblers.
The few sociologists who have studied sports performance pit themselves against biological or genetic explanations in favor of sociological ones, especially in studies about gender and race (Chambliss 1989; Cooky and Messner 2018; Harrison, Lawrence, and Bukstein 2011). Sociologists also recognize how dominant groups attempt to exclude subordinated groups from sports participation, thus protecting their higher status and, in the case of the highest levels, legitimating their social superiority (Jakubowska 2018). There are also many studies of black athletes’ and men’s integration and success in elite white leagues and tournaments (e.g., Hoose 1989), but none of this work measures sports performance systematically.
Sports performance is difficult to study in the general population, because it is not measured in large surveys (but see Thompsett and Knoester forthcoming). Research on elite athletes often samples on the dependent variable. One way sociologists avoid this misstep is to sample areas such as hometowns, neighborhoods, schools, and states, and count the number of elite athletes (e.g., the number of Olympic athletes) from each area (Allison, Davis, and Barranco 2018; Goldsmith 1999; Macaulay, Cooper, and Dougherty 2019). This method overcomes sampling on the dependent variable if the sample includes areas that did not have elite athletes. These studies’ measure of sports performance is a count of the number of elite athletes from an area, which tells us little about the overall distribution of sports performance in a population. In addition, these studies must overcome the ecological fallacy, which occurs when researchers erroneously attribute macro-level relationships to underlying micro-level relationships. 2
Studying sports performance at the level of high schools has many advantages. While the ecological fallacy cannot be completely overcome, schools are small units with known populations. Sports performance can be measured as a winning percentage or an average margin of victory/defeat for schools, both of which are continuous variables containing much more information about the variation of sports performance in a population. In addition, data on multiple contests per school allows us to control for unmeasured characteristics of schools that might be conflated with schools’ social class composition.
Theories of Exclusivity
Cultural capital theory (Bourdieu 2000; Calarco 2018; Dumais 2002; Jæger 2011; Lareau 2003) predicts that social class differences in families produce social class differences among children in cultural capital and habitus. These middle-class advantages are rewarded in the hidden curriculum of schools, thus reproducing social inequality across generations (Bourdieu 2000). Cultural capital is “institutionalized, i.e., widely shared, high-status cultural signals (attitudes, preferences, formal knowledge, behaviors, goals, and credentials) used for social and cultural exclusion” (Lamont and Lareau 1988:156). Cultural capital is not taught in schools, but it is rewarded through mechanisms such as teacher biases in grades (Dumais 2002). It is usually measured, at least in quantitative studies, in terms of participation and appreciation of the fine arts and the humanities (Dumais 2002; Jæger 2011).
Habitus includes cultural habits, dispositions, and styles that stem from knowledge of the social structure and one’s place in it (Bourdieu 2000; Dumais 2002). Its class-specific content leads individual agents to reproduce social inequality. For example, middle-class children, on the basis of their records of success in school (via the hidden curriculum), identify as fit to be middle class and invest in their education. Working-class students, unable to compete in the hidden curriculum, reproduce their own subordination through “self-elimination . . . or a resigned attitude to failure and exclusion” (Bourdieu 2000:59).
Researchers in the United States use habitus to study parenting styles. According to Lareau (2003), middle-class parents practice “concerted cultivation,” which requires parents to intervene in their children’s education and activities to ensure that they develop skills for social advancement. In contrast, working-class parents practice “natural development,” whereby they allow their children’s talents to emerge as they age without intervention. Consistent with the notion of a hidden curriculum, Lareau (2003) found that schools implicitly demand that parents follow the model of “concerted cultivation.” Thus, teachers, staff members, and administrators expect parents to attend parent-teacher conferences, help their children with homework, and so on. In contrast, school personnel derogate working-class parents as disinterested in their children’s skill development. Thus, Lareau contended that school culture aligns with middle-class culture.
Some researchers consider sports participation to be cultural capital (e.g., Stempel 2005), but some do not (Dumais 2002). Sports performance has some ingredients of cultural capital. Sports performance in youth is used, along with other criteria, to exclude individuals for team membership, team honors, school awards, conference awards, city awards, and athletic scholarships. It is a part of the official culture promoted by the school. In terms of habitus, athletic competition (as opposed to recreational play) may be appreciated more by the middle than the working class. For example, in Stempel’s (2005:411) analyses of adult sports participation, he concluded that “competitiveness,” the “will to win,” and “physical domination” are important components of upper-class distinction. Similarly, Friedman (2013) found that middle-class parents consciously choose competitive sports leagues for their children instead of those that reward participation. These parents view competitive sports as training for the competition children will experience in the education system and the labor market. They want their children to win and earn trophies, honors, and awards, which Friedman views as forms of cultural capital. Her review of the history of youth sports also suggests that since the 1970s, sports leagues offered to the working class (through organizations such as the Boys & Girls Clubs of America) have increasingly emphasized participation rather than competition.
Middle-class youth also spend more time than working-class youth developing skills outside school. Weininger et al. (2015) found in a national sample that parental income, wealth, and the flexibility of parents’ work schedules are positively associated with the amount of time children spend in nonschool organized activities. However, the largest differences are in the mother’s educational attainment. When the mother has a college degree (compared with no high school diploma), the children spend an extra 3 hours each week (156 hours each year) in organized activities net of other factors. In addition, Chin and Phillips (2004) found that middle-class children’s summer activities are organized, expensive, and focused on skill development. Many of these activities are sports camps specifically designed to improve sports performance. Working-class children, in contrast, spend most of their summers not enrolled in activities, and the ones they do participate in are modest and lack educational components. And of course, many working-class children experience hunger, lack of quality housing, violence, and other obstacles to achievement of any kind.
To this point, we have been describing how family economic, cultural, and social resources affect children’s sports performance. Middle-class parents also use their resources to exclude the working class from resources through school and neighborhood segregation (Owens 2018). Through discriminatory forms of exclusion at multiple levels, middle-class families are able to form PMCSs, and because of their investments in the athletic skills of their children, the schools will have many skilled athletes. Students in schools compete against one another for the most desirable positions in the schools (Attewell 2001), so the best athletes in the schools tend to participate on the sports teams on which they excel the most. As team sports benefit from having many good players, PMCSs will win more often and by larger margins, suggesting the following hypothesis:
Hypothesis 1: As schools’ percentage middle class goes down, schools will lose more often and by larger margins.
School sectors also contribute to school segregation in ways that influence athletic team success because private schools are more exclusive than public ones. In 2002, less than 1 in 10 students (8.7 percent) attended private schools. However, less than 1 in 5 students (17.3 percent) in the top socioeconomic status quartile and not even 3 in 100 (2.7 percent) students from the bottom quartile attended private schools (Cahalan et al. 2006). Concerted cultivation may be particularly strong among families with children in private schools. Weininger et al. (2015), whose research was discussed earlier, also found that net of all other factors, children in private schools spend more than two hours a week in nonschool organized activities than children in public schools.
PMCSs, which are generally more desirable, probably recruit more athletes than PWCSs. Although the NFHS (2018) considers recruitment exploitative, it still occurs. Legal cases suggest that it is more common for private schools in high-profile sports for boys (Johnson et al. 2018). Thus, we arrive at our next hypothesis:
Hypothesis 2: Private schools will win more games and by larger margins than public schools.
Inclusivity Perspectives
Just as cultural capital theory predicts that middle-class youth will become proficient at athletics, it predicts that working-class youth will not. In contrast, some sociologists suggest that working-class youth will develop better sports performance.
One explanation focuses on working-class youth’s propensity to overestimate the chances of becoming a professional athlete. Harry Edwards (1986), who was particularly concerned about black youth’s overemphasizing sports, expressed this view early on. According to Eitle and Eitle (2002; Eitle 2005), it results less from race than from a lack of educational resources or cultural capital at home, which exposes youth to influential media and ideological portrayals of athletes. They show that high school participation rates in popular sports such as football and basketball are higher among children with fewer educational resources at home, particularly among black male youth. May (2007) proposed that black youth are optimistic about becoming professional athletes because they evaluate their chances of being successful relative to their peers rather than to elite athletes. Working-class students may also focus on athletics because it is one of the few prestigious school roles available to them or a (real or perceived) lack of opportunities in other occupations (Singer and May 2011). Messner (1990, 1992), in his interviews with men who used to be serious athletes, found that the middle-class and white athletes were more likely to disinvest in sports performance from a younger age than those from working-class backgrounds because the former group viewed their chances of success to be greater in other fields or occupations. Bissinger (2015) described how working-class football players in a small Texas town sacrifice their health and futures for the sake of the team, something middle-class youth would be more likely to avoid.
Another explanation for working-class success in sport focuses on resistance to subordination, which athletes have done in multiple ways on and off the playing field (Giulianotti 2015). One way to challenge dominant groups is to outperform them. Giulianotti (2015) referred to this type of protest when he wrote, “Among athletes, violent resistance can be sublimated partially through competition” (52).
Following Lifschitz, Sauder, and Stevens (2014; based on Geertz [1972] 2005), athletic contests are status competitions. Victories by low-status groups over high-status ones disrupt the status system, especially as it pertains to the legitimacy of the higher status groups attempts to exclude the lower status group. One of the clearest examples of this was the King-Riggs “Battle of the Sexes” tennis match, which is regarded as “a defining moment that served to legitimize women’s tennis” (Spencer 2000:387). When contests are between teams that differ on characteristics such as race, class, and gender, they take on greater meaning to athletes and fans in the subordinate group because it is a chance for them to legitimate their equality. The underlying idea in this argument is that relations between dominant and subordinate groups can affect motivations to play and practice sports. Goldsmith (2003) provided evidence of this dynamic by showing that antagonistic race relations among students in schools lead blacks and whites to participate in sports they are stereotypically associated with. Similarly, Klein (2018) noted, in his study of predominately white and predominantly Oglala Lakota high school basketball, “Teams representing subaltern communities may use sport to carve out spheres of resistance that force those socially more powerful communities to grudgingly acknowledge the momentary reversal of the social order” (p. 58).
Mohamed (2017) also describes “momentary reversals” in sport. He observed that adult black basketball players are unwilling to defer to whites in the context of pickup games even though the same players do so at work and in other settings. Thus, theories of inclusivity lead to our next hypothesis:
Hypothesis 3: As schools’ percentage working class increases, schools will win more often and by larger margins.
School Unity and School Conflict
Last, PWCSs and PMCSs may both have strong sports performance. This may be the case because students in a school create normative climates (Bankston and Caldas 1998; Coleman et al. 1966). Thus, PWCSs may develop cultures that overemphasize athletics or that use athletics to resist domination. At the same time, PMCSs can create a culture of concerted cultivation around sports. Theoretically, economically integrated schools contain conflicting cultures toward sports. Presumably, this within-school conflict will reduce school sports performance. If so, the following hypothesis will hold:
Hypothesis 4: As schools’ percentage working class increases, rates of success will fall and then rise in a U-shaped relationship.
Alternative Explanations for School Differences in Sports Performance
PWCSs are likely to receive less funding and to have greater funding needs than PMCSs (Morgan and Amerikaner 2018). PMCSs are likely to have higher quality coaching, better facilities and equipment, more money for travel, fewer students per teacher or coach, more revenue from boosters and advertisements, and other valuable amenities. Although we do not know how resources affect high school sports performance, they could improve it, as this relationship has been found in college athletics (Omondi-Ochieng 2019; Won and Chelladurai 2016).
However, high schools with abundant resources also field teams in more sports, increasing the opportunities to play (Stearns and Glennie 2010). Offering more sports might reduce rather than improve a high school’s sports performance because it spreads athletes across a larger number of sports. For example, adding a boys’ soccer team could deplete the number of students playing football. In addition, it is important to keep in mind that the provision of universal education equalizes opportunities to play and learn sports across social classes. That is, during the season the sport is offered at school, sports participants at PMCSs and PWCSs get equipment, coaches, fields, and so on. The resources vary in quality across schools, but this will be the only opportunity for many working-class students to play organized sports with a coach. In contrast, many middle-class students participate in nonschool organized activities outside the school season that include these opportunities (Weininger et al. 2015). Thus, one could argue that despite the inequality among schools, schools equalize social class opportunities to develop sports performance. 3
PMCSs also tend to be located in more affluent residential areas with more public and private services and amenities. More affluent residential areas and PMCSs have more nonschool opportunities to play and probably to master sports performance, especially in sports such as volleyball, soccer, and swimming that are popular with the middle class (Goldsmith 2003; Stearns and Glennie 2010). Another resource that may improve schools’ sports performance is size, simply because larger schools have a better chance of enrolling talented athletes (Goldsmith 1999). Our methods are designed to estimate the effects of schools’ social class composition net of the effects of school resources, schools’ racial and ethnic composition, urbanicity, and size.
Methods
Data
This study uses data on the 2017–2018 school year from three sources: (1) the National Center for Education Statistics Common Core of Data (CCD), (2) the Private School Universe Survey (PSS), and (3) the fan-driven high school sports platform ScoreStream. The CCD is the primary National Center for Education Statistics database on the universe of all public elementary and secondary schools and districts. The nonfiscal data include information on students and staff members. The CCD’s School District Finance Survey (F-33) provides annual revenue and expenditure data for all school districts in the United States. The PSS biennially collects information on the populations of private schools and their students and staff members.
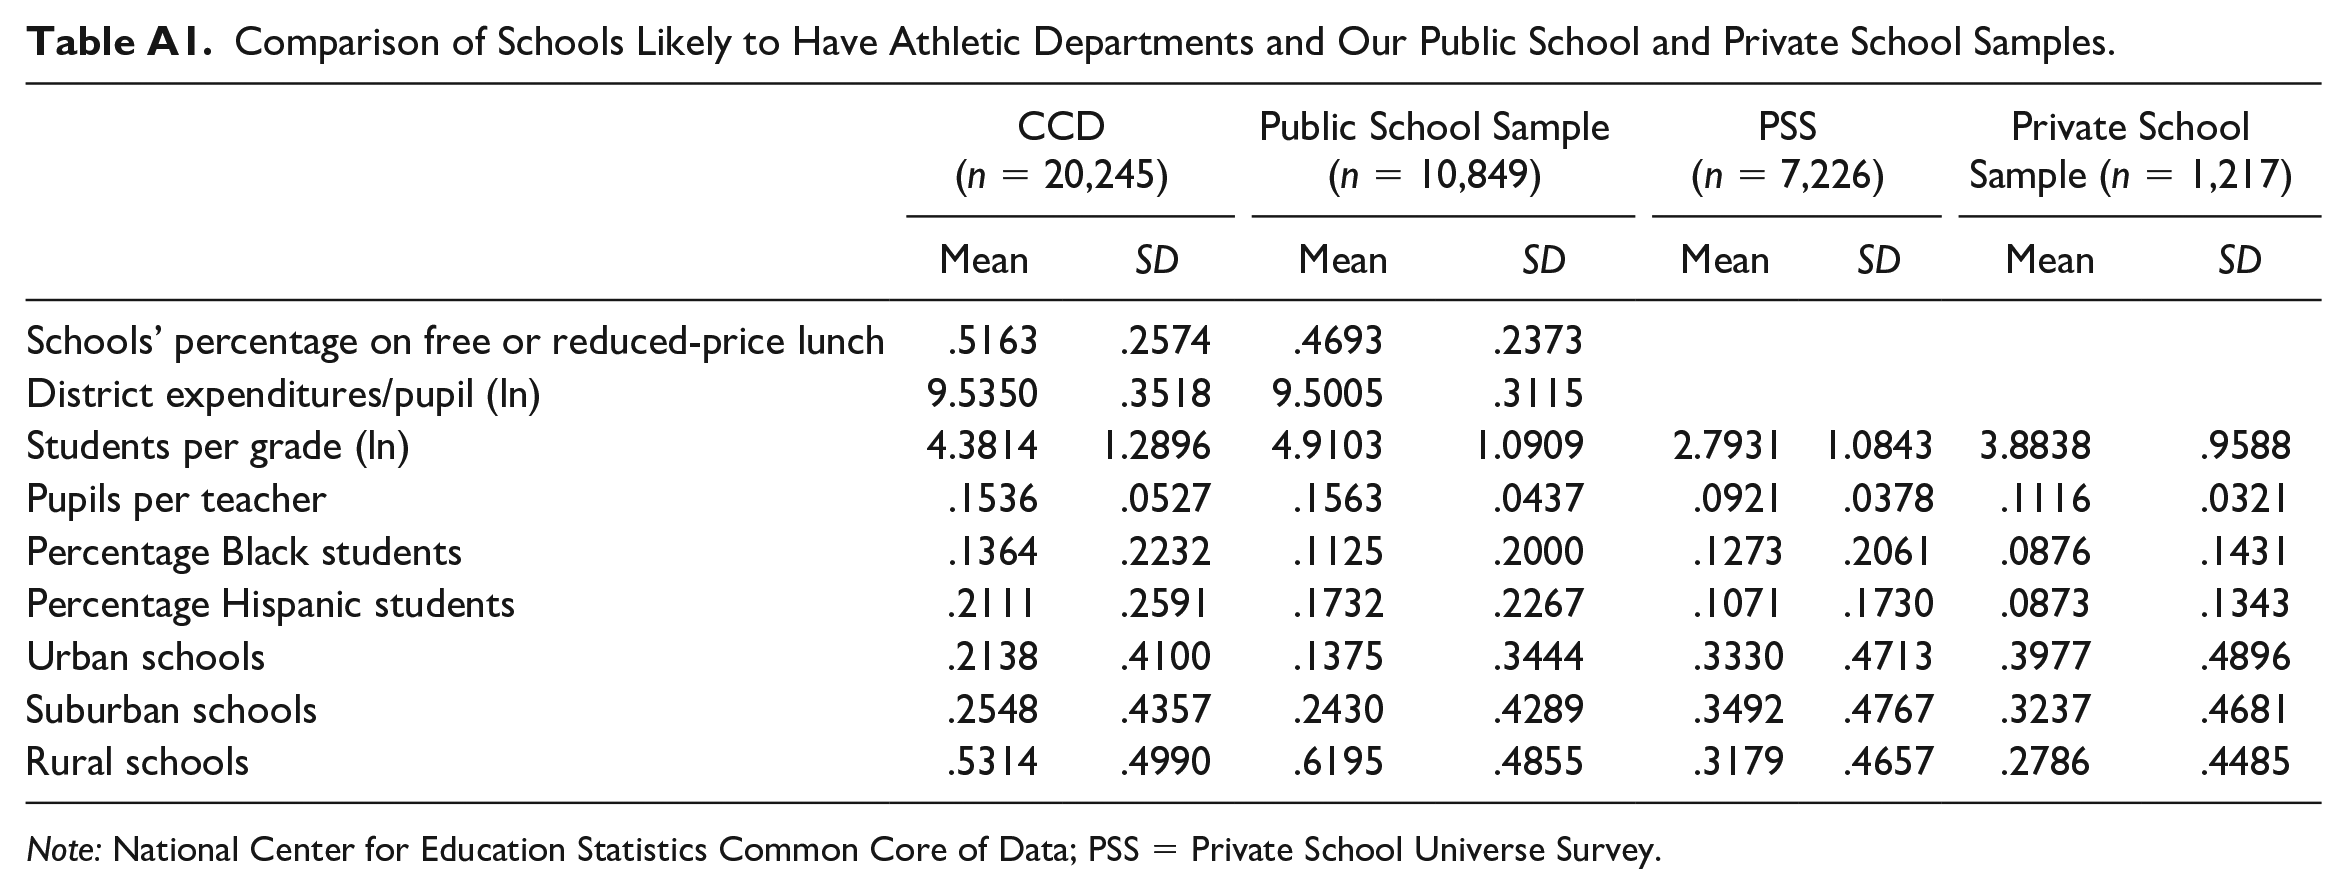
ScoreStream provides data on high school sports contests, including the names and locations of both schools, the score, level of play, sport, and gender. The data include contests from all 50 U.S. states; they are not a complete register of all high school sports contests in the United States. Instead, they contain scores reported by the public. We limit our analyses to high school varsity contests. To link ScoreStream data to the CCD and PSS, we use school and city names, which are available in all three data sets. We construct two data sets. The first is a school-level data set with full information on 10,849 public schools and 1,889 private schools. There are about 18,500 schools with athletic departments in the United States. This is approximately how many schools have boys’ basketball programs, which is the most frequently offered sport (NFHS 2021). According to this total, the ScoreStream data contain at least one contest for 68 percent of schools with athletic departments in the United States. On average, the ScoreStream data contain 8.0 and 10.9 contests per school for girls and boys, respectively. 4 As no national survey includes information on which schools have athletic departments, we cannot directly compare our sample with them. However, compared with schools in the CCD and PSS that are likely to have athletic departments (e.g., not including virtual schools), our sample has fewer urban schools and more rural schools (Table A1). This makes the sample means in our data slightly lower on schools’ percentage on free or reduced-price lunch, percentage black students, and percentage Latinx students by 2 to 6 percentage points. As we control for these differences, we do not believe they will bias the estimates of our focal interest.
The second data set is at the contest level and includes 221,968 contests overall and 188,263 when limited to public schools. The percentage of contests by sport and gender are shown in Table 1. As seen there, popular sports might be overrepresented in our data in comparison with what national data might look like if they existed. For example, basketball and softball, two popular sports for girls, account for 69 percent of the contests in the Scorestream data set. According to the NFHS (2021), only 23 percent of girls’ sports participants are in these two sports. Among the contests for boys, baseball (13 percent), basketball (40 percent), and football (32 percent) account for more than 75 percent of the contests. In the national data, these three sports contain 45 percent of participants. Our data do not include information on many individual-level sports, such as tennis, golf, swimming and diving, cross-country, and track and field, which are likely to be more exclusive. The overrepresentation of popular sports likely biases our results toward finding more support for inclusive perspectives than would be the case with more representative data. We also find that contests won by the away team are overrepresented, which may occur because fans, coaches, and athletes may want to post scores for their fan bases at home, especially when they win.
Contests by Sport.

Variables
We discuss the construction of variables in the school-level data first, leaving the discussion of the variables in the contest-level data for the analyses section. We measure sports performance, our dependent variable, in two ways. Both measures are continuous and based on high schools’ success in interscholastic contests. Our first measure is schools’ average winning percentage across all varsity sports contests. The average winning percentage equals the number of wins divided by the number of contests. Ties count as half of a win.
Second, we estimate schools’ average standardized margin of victory or defeat across all varsity contests. The margin of victory or defeat estimates how much better or worse a team is than its opponent, so it contains more information about athletic success than does the winning percentage. If a school wins a contest, the margin is positive and equal to the number of points it wins by. If a school loses, the margin is negative and equal to the number of points it loses by. To estimate a school’s average margin of victory or defeat across all contests, it is necessary to account for variation by sport. For example, margins of victory or defeat tend to be larger in American football, in which it is common for teams to win or lose by 10 points, than in soccer, in which teams often win or lose by 1 or 2 points. To standardize margins of victory or defeat, we divide them by their sport-specific standard deviations. We then average them by school to create schools’ average standardized margins of victory or defeat. For simplicity, we will refer to this variable as schools’ margins of victory (whether positive or negative) from here on.
There are two indicators of schools’ social class. The first is schools’ percentage of students on free or reduced-price lunch (SPFL), which is available in the CCD. SPFL measures schools’ social class composition because only youth from low-income families qualify. Because SPFL is a continuous variable ranging from 0 percent to 100 percent, we can estimate nonlinear relationships with it in regression models. One drawback of this measure is that it is based on parental income rather than parental education, which is a better predictor of children’s nonschool activities (Weininger et al. 2015). This limitation is likely to introduce random error that will bias the coefficient toward zero, so only a strong effect will be significant.
Information on SPFL is not available for private schools. Although we could omit private schools entirely for this reason, including them in the analyses is informative because they enroll high–socioeconomic status students who participate in many nonschool organized activities (Cahalan et al. 2006; Weininger et al. 2015). When private schools are included in the analyses, we measure schools’ social class composition with a dummy variable for school sector (private = 1 and public = 0).
We use two measures of school resources. First, we use the natural log of expenditures per student, which is available in the CCD for public school districts. Separate estimates for athletic expenditures cannot be estimated from the CCD. Second, we include schools’ student/teacher ratios because teacher salaries are a large share of school expenditures. When there are many students per teacher, schools are usually unable to hire enough teachers. The latter variable is available for public and private schools. The correlation between these two measures is −0.31, suggesting that they are modestly related to each other. The first correlates at −0.09 with SPFL, and the second does not correlate with it (not significant). Third, schools’ size, a nonfinancial resource, is measured as the natural log of students per grade. In private schools, students per grade equal school enrollment divided by the number of grades offered. In public schools, it is the average enrollment in 10th, 11th, and 12th grades. We use natural logs for highly skewed variables to reduce the influence of extreme values on the regression coefficients.
We include percentage black and percentage Latinx because these are the two largest racialized minority groups. Rurality is measured with dummy variables for suburban schools and urban schools. Schools that are in rural areas or towns are combined into one reference category because we find little difference in winning between them.
Analysis
Our goal is to examine the relationship between schools’ social class and schools’ winning. We estimate all results separately for boys and girls because the effect of social class on sports participation may vary by gender (Dumais 2002; Eitle 2005). We use ordinary least squares (OLS) models to analyze the school-level data because both dependent variables have relatively normal distributions. We include models with public and private schools and models with only public schools. Because omitted-variable bias is likely to influence the results of these models, we use them to describe the conditional relationship between schools’ social class composition and winning.
To analyze the contest data, we use school-fixed-effects models (Allison 2009). These models have two advantages. First, using contests as the unit of analyses allows us to adjust for characteristics of opponents. Teams are less successful against strong opponents and vice versa. If opponent characteristics are not accounted for, our measures of sports performance will be too high for schools that play weak teams and vice versa. This is a significant problem because interscholastic competition is often organized into conferences and divisions so that schools play opponents that are similar to themselves on characteristics such as schools’ social class composition and size (Lifschitz et al. 2014). To account for the strength of opponents, the independent variables used in these models measure differences between the home (h) and away (a) team (Δx = xh – xa). For example, instead of using the SPFL of the home team as an independent variable, we use ΔSPFL, which ranges from –100 to 100.
Second, school fixed-effects models account for unmeasured characteristics of schools that are invariant with respect to boys and girls contests. These models are possible because there are multiple contests per school. More formally, in fixed-effects models (Allison 2009), let

where y is the margin of victory for the home team school s in contest c. The variables labeled Δx describe differences between the home and away team on observable variables. β is a vector of coefficients. ε is a random disturbance term. What makes this a fixed-effects model is the term µs, which is an intercept estimated for each school (Allison 2009). It captures the average effect of observed and unobserved school characteristics that are invariant in relation to the schools’ contests. For example, it will capture the effect of observed factors such as school resources and urbanicity, which are constant across all a school’s contests. More important, it will capture the effects of unobserved factors such as a pay-for-play policy, a strong or weak athletic culture, donations to the athletic department, and facilities and equipment to the extent that their influence is invariant with respect to the school’s contests. Because models are estimated separately for boys’ and girls’ sports, it also captures the effects of emphasizing boys’ sports over girls’ sports as long as it is invariant across boys’ and girls’ contests. However, it will not capture the effects of unobserved variables that vary across contests. The Δx variables vary across contests as long as a school plays different opponents.
In the fixed-effects models, a negative coefficient for ΔSPFL is consistent with exclusivity perspectives. A positive coefficient for it is consistent with inclusivity perspectives. To allow exclusivity and inclusivity to both affect margin of victory, we add a dummy variable equal to 1 if one of the two teams is a PWCS, which we define as a school with at least 90 percent on free- or reduced-price lunch. We use this high cutoff to ensure that few middle-class students attend these schools and play on the sports teams. We interact this variable with ΔSPFL. The interaction tests whether the slope of the line for ΔSPFL is different when at least one of the teams is a working-class team. A negative main effect and a positive interaction are consistent with a curvilinear relationship between schools’ social class composition and success in interscholastic sports.
Results
Table 2 shows the descriptive statistics for the 12,738 schools and 221,968 contests in our samples. As the samples differ little by sex, we describe only the schools with girls’ teams. High schools in the sample win 47 percent of all their contests. In the article, we describe differences in winning percentage as small (<5 percent), medium (5 percent to 10 percent), large (10 percent to 15 percent), and very large (>15 percent). The average margin of victory is close to zero. If a school has a margin of victory equal to 1, it means that it wins all its contests by an average of 1 SD above the mean. How much is that? In basketball, football, and softball, 1 SD in margin of victory is 22.4 points, 29.0 points, and 7.8 runs, respectively, all of which most fans would consider blowouts. We will refer to margins of victory as small (<0.15), medium (0.15–0.30), large (0.30–0.45), and very large (>0.45).
Descriptive Statistics for the School-Level Data and Contest-Level Data.

Note: For school-level data, n = 10,738 for girls and n = 12,540 for boys; for contest-level data, n = 85,656 for girls and n = 136,312 for boys. Δ indicates the difference between the home team and the away team.
Available only for public schools.
SPFL has a mean of 45 percent. Almost 8 percent of the schools are private. On average, there are 15 students per teacher. The natural log of students per grade in school averages 4.9, which is about 134 students. The natural log of expenditures per student averages 15.2, which is about 13.3 thousand dollars. Schools average 10 percent black and 15 percent Latinx. The means of the contest-level data show that the average differences between the home and away teams are small on all variables. This occurs because schools usually play similarly sized schools in the nearby vicinity.
We now turn to our findings about social class and sports performance. Table 3 shows the school-level regression models that compare public and private schools controlling for racial composition, resources (i.e., the student/teacher ratio), size, and urbanicity. Models 1 and 2 predict winning percentage, and models 3 and 4 predict margin of victory. Two models are for boys and two are for girls. Hypothesis 2 predicts that the coefficients for private schools will be positive. This is the case in all four models. In the ones predicting winning percentage, the coefficients are about 0.05, which are small but statistically significant. They show that conditional on other factors, private schools’ average winning percentage is five percentage points higher than that of public schools. In models 3 and 4, the coefficients for private schools indicate that net of other factors, private schools’ margins of victory are larger than those of public schools by 0.16 and 0.21 SDs for girls and boys, respectively. These effect sizes are medium. Thus, these findings are consistent with hypothesis 2.
Coefficients from Regression of Schools’ Winning Percentage onto Selected Variables,a School-Level Data.

The models also control for rural/town, urban, and suburban schools.
p < .05. ***p < .001.
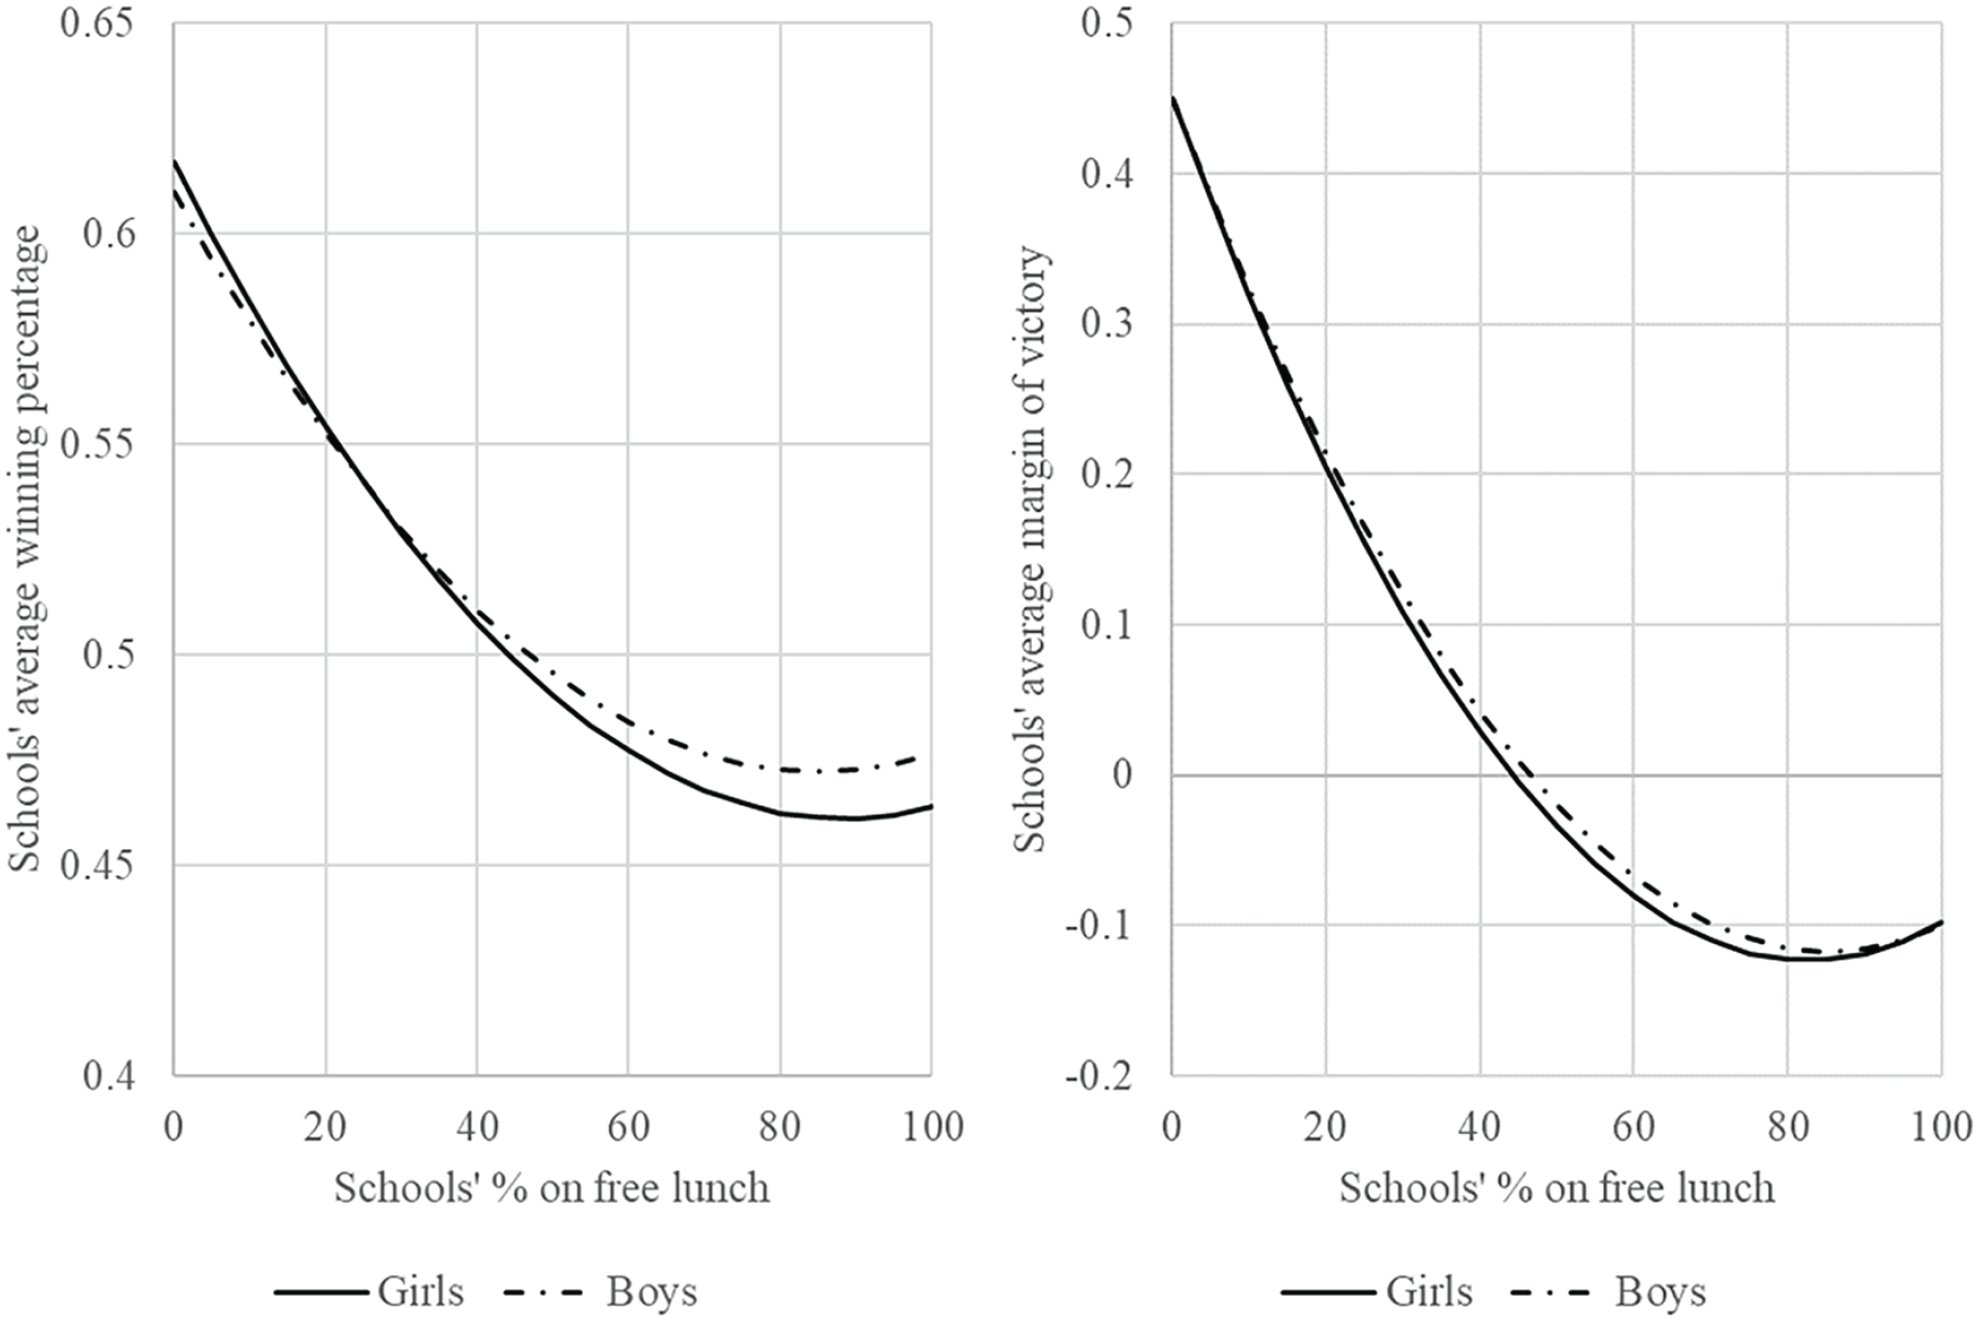
Next, we examine the models in Table 4 that use the data on public schools only. This reduced sample allows us to include SPFL (as a linear and squared term) as well as the district’s expenditures per student. We have three expectations about the coefficients for SPFL: they will produce a negative (hypothesis), a positive (hypothesis 3), or a U-shaped relationship (hypothesis 4) with winning percentage and margin of victory. As seen in all four models (two for girls and two for boys), the linear term for SPFL is significantly negative, and the squared term is significantly positive. We plot the curves produced by these coefficients in Figure 1.
Coefficients from Regression of Schools’ Margin of Victory onto Selected Variables,b School-Level Data.

Note: SPFL = schools’ percentage on free or reduced-price lunch.
Coefficient multiplied by 100 to show more meaningful digits.
The models also control for rural/town, urban, and suburban schools.
p < .05. **p < .01. ***p < .001.

Expected winning percentage and margin of victory as a function of percentage of students on free or reduced-price lunch.
As seen in Figure 1, all four curves show that when SPFL is around zero, schools have a winning percentage of about 61 percent, which is large, and they win by a margin of 0.47 SD, which is very large. As SPFL rises, the winning percentages decline rapidly, which is consistent with exclusivity perspectives (hypothesis 1). However, exclusivity perspectives predict that the lines in the figure will continue declining rapidly through the entire distribution of SPFL, with economically integrated schools performing better than PWCS. Instead, once SPFL reaches about 60 percent, the curves flatten out and even rise a little, indicating that PWCSs perform as well as economically integrated schools. Moreover, theoretically, this flattening is consistent with inclusivity perspectives. Taken together, the findings suggest that exclusivity and inclusivity are at work, as hypothesis 4 predicts, but exclusivity is much more powerful.
Table 5 shows the results from the contest-level data using school fixed-effects models. These models improve estimates of the focal relationship because they are based on differences in social class composition (and other variables) between opponents and because they control for unobserved characteristics of schools associated with winning that are contest invariant. In models 1 and 3, we include two dummy variables about private schools. They estimate whether the margins of victory are larger when private schools play public schools than when private schools play other private schools. The first one estimates this when the private school is at home and the second when it is away. The coefficients show that for girls’ sports, private schools win against public schools by 0.19 and −0.22 SDs, which are medium. For boys’ sports, private schools win by 0.36 and −0.40 SDs, which are large. The effects are perhaps larger for boys because private schools may recruit boys more than girls to play sports (Johnson et al. 2018). Also, notice that these more rigorous models estimate larger advantages of private schools, especially for boys, compared with estimates with OLS models in Table 3. The school fixed-effects models show that the effects of private schools are suppressed in the OLS models.
Coefficients from Regression of Margin of Victory onto Selected Variablesb Describing Differences between Opponents, Contest-Level Data.

Note: Δ indicates the difference in the variable between the home and away team (h – a). SPFL = schools’ percentage on free or reduced-price lunch.
Coefficient multiplied by 100 to show more meaningful digits.
The models also control for the rurality of contests.
p < .05. **p < .01. ***p < .001.
Models 2 (girls) and 4 (boys) show the coefficients for differences in SPFL between opponents. We also include an interaction between SPFL and the dummy variable for PWCSs. In these models, a negative effect for ΔSPFL and a positive interaction are consistent with hypothesis 4, which states that exclusion and inclusion occur simultaneously.
The results show that for girls and boys, the main effect of ΔSPFL is negative, and the interaction is positive, so boys’ and girls’ sports are consistent with hypothesis 4 because there is evidence for exclusion and inclusion, although exclusion is much stronger. We plot the slopes in Figure 2. As seen in the figure, the slope for contests without a working-class school is steep and negative (−0.0086 for girls and −0.0082 for boys), indicating that margins of victory get larger the greater the difference in SPFL between the schools. The slope of ΔSPFL for schools with at least one PWCS is also negative, but not as steep, at ([−0.0086 + 0.0059 =] −0.0027 for girls and −0.0046 for boys. This means that PWCSs usually lose to schools with fewer students on free or reduced-price lunch, but the margin of defeat is smaller than would be expected for their social class composition. For example, if a girls’ team in a school with SPFL equal to zero hosts a school with SPFL equal to 60, the ΔSPFL equals –60 percentage points, and the expected margin of victory is (−60 × −0.008568 =) 0.51 SDs, which is very large. If the –60 percentage point differential happens when one of the schools is a PWCS, such as a contest between schools with 35 percent and 95 percent on free or reduced-price lunch, then the margin of victory is (–60*(–.008568 + .0059) =) 0.16, which is a medium-size margin of victory. Thus, the school fixed-effects models are consistent with hypothesis 4.
Expected margin of victory as a function of schools’ percentage of students on free or reduced-price lunch.
As we discussed in the literature review, there are alternative explanations for high school sports performance. One is school size. In all the models, the coefficients for size indicate that schools with more students have better sports performance. Another explanation is resources, which we measured as per pupil expenditures and pupils per teacher. In the OLS models, three of the four coefficients for per pupil expenditures are negative, and none of the coefficients for pupils per teacher are significant. In the school fixed-effects models, none of the coefficients for per pupil expenditures are significant, and all the coefficients for pupils per teacher are positive. Positive coefficients for the latter measure indicate that schools with more students per teacher have higher sports performance, which is the opposite of what we would expect if resources raised sports performance. It is possible that the effect of school differences in resources is being suppressed by differences between schools in number of sports offered, but the same could be said for the effects of ΔSPFL. The models indicate that differences between opponents in social class composition matter much more than differences in their resources.
Schools’ percentage black associates with sports performance differently for girls and boys. In girls’ sports, the coefficients for schools’ percentage black are negative in four of the models, including the two in the school fixed-effects models. For boys, the coefficients are either not significant or positive, including robust positive coefficients in the school fixed-effects models. The positive coefficient for schools’ percentage black for boys is consistent with research showing the great accomplishments of black male participants in sports (Hoose 1989). The coefficients for schools’ percentage Latinx are negative in all models, 10 of them significantly. The negative relationship is consistent with research showing that Latinxs have low participation rates in extracurricular sports (Meier et al. 2018).
Discussion
In this study we examine the relationship between social class and sports performance by analyzing data on schools’ social class composition and schools’ athletic success. We look for evidence of exclusionary perspectives predicting that middle-class students and PMCSs will be more successful and inclusionary perspectives predicting that working-class students and PWCSs will be more successful. We find evidence for both perspectives, but the impact of exclusion on sports performance is stronger than that of inclusion. PMCSs win often and by large margins when they play against other schools. PWCSs lose consistently, but less often and by smaller margins than would be expected on the basis of their social class composition. That is, PWCSs perform as well in sports as economically integrated schools.
The strengths of this study are the consistency and robustness of our findings concerning inclusivity and exclusivity in all models, including the school fixed-effects models, our large sample, and the ability to rule out alternative explanations. The large data set limits the influence of highly unique schools or families. We control for school resources, gender, schools’ racial and ethnic compositions, size, and rurality. The school fixed-effects models also control for unmeasured school characteristics that are constant concerning school contests by gender, such as pay-for-play policies, a strong athletic culture, or gender inequality. Thus, we believe the most likely reason that PMCSs win more is that their students’ families have more resources to devote to their children. The effects of schools’ social class composition mostly capture differences between the students that attend schools instead of differences in resources between schools. The characteristic of schools that is important is their social-class segregation. Differences in sports performance between schools would be smaller if schools were more economically integrated.
The relationship between sports performance and social class has important implications. First, social class differences in sports participation, which are large (Meier et al. 2018), obfuscate the large social class differences in sports performance among the students that participate. These findings indicate that we need to study not only the effects of sports participation, which has been studied extensively, but also the effects of sports performance. Are the benefits of sports participation larger or smaller for those with better sports performance? Given how much middle-class families invest in their children’s athletic development, this is an important question to investigate. We also believe that researchers should investigate treating sports performance as a measure of mastery of cultural capital. Nearly all quantitative studies of cultural capital measure it in terms of participation, appreciation, or other similar measures (see review by Jæger 2011). These studies should also measure mastery of cultural capital among participants. It is likely that mastery of cultural capital will predict educational outcomes better than measures of participation or appreciation.
A second implication for cultural capital theory concerns the alignment of school culture and middle-class culture. Bourdieu (2000) and Lareau (2003) found or argued that schools have a hidden curriculum whereby school personnel expect children and parents to behave in middle-class ways. Working-class parents and students are thought to be unaware of the hidden curriculum, and Bourdieu would argue that working-class students will acquiesce to failure. Our findings suggest that working-class students, at least those in PWCS, do not show unqualified consent to failure because their sports performance is on par with that in economically integrated schools. Our findings may differ from the theoretical expectations of cultural capital theory because we are studying the official culture (i.e., interscholastic athletic competition) rather than the hidden one. It is also possible that sports are unique in fostering working-class investment. However, we believe that our precise measures of mastery of cultural capital (winning percentage and margin of victory), our large sample size, and our accounting for alternative explanations provide more accurate estimates of this relationship. Perhaps there is less working-class acquiescence than Bourdieu believed.
Third, using sports performance to measure mastery of cultural capital has advantages. First, sports performance can be measured precisely with continuous measures of winning percentage and margin of victory. In addition, it is possible to identify differences in mastery in head-to-head competitions. The clearest evidence that the contest data improve our measures of mastery involves the findings about the school sector for boys’ sports. Using the school-level data, the models estimate that private schools’ margin of victory is 0.21 SDs higher than similar public schools. In the contest-level data, the models estimate that private schools’ margin of victory against public schools is 0.36 and 0.40 SDs for home and away contests. This finding is substantively important because it shows that competitive contests allow us to estimate mastery of cultural capital precisely. But it also shows how difficult it can be to estimate mastery of cultural capital in activities that do not include competitive contests.
Research on collegiate athletics finds that resources improve performance (Omondi-Ochieng 2019; Won and Chelladurai 2016), but we find the opposite in high school athletics. We find that expenditures per student do not predict team success and that pupils per teacher associates with a greater margin of victory, perhaps because schools offer fewer sports when they lack funds (Stearns and Glennie 2010). It is also possible that PMCSs are successful because they have working-class students on their sport teams. We believe this possibility is unlikely. Prior research shows that middle-class students have higher sports participation rates (Meier et al. 2018), and we find that middle-class students perform sports better at the school level. This means that it is far more likely that the participation of middle-class students in PMCSs is responsible for these schools’ success in sports. It is more likely that middle-class students improve the sports teams in PWCSs than the opposite. 5 Working-class students in PMCSs are unlikely to play sports at all. The one exception may be the success of boys’ teams at private schools, which is where recruitment of working-class players is most likely (Johnson et al. 2018). We believe the main bias in our estimate is to contain many more contests from popular sports than from more middle-class sports, which would increase the support for inclusivity perspectives and dampen support for exclusivity ones.
Our study demonstrates that social class and sports performance are related, but we do not have measures of the mediating processes. The literature suggests that middle-class students develop sports performance through participation in nonschool organized activities and an attitude of concerted cultivation (Lareau 2003; Weininger et al. 2015). It also suggests that the working class develops sports performance through an irrational assessment of their chances of success, a lack of educational resources at home, and resistance (Eitle and Eitle 2002; Edwards 1986; Giulianotti 2015; Messner 1990). With our data, we cannot measure these mechanisms. Finally, we have combined all sports, although readers might believe that the findings will vary by sport. Future research should investigate this issue, but we believe it is important to make claims about sports in general too. Sport is a unique institution in that it emphasizes merit, fairness, and a feel of suspension in time and space.
Our findings about social class and sports performance apply equally to boys’ and girls’ sports except in two instances. Private schools have a greater advantage over public schools for boys than girls. We believe this sex difference stems from private schools’ recruiting good male athletes more often than good female athletes. Sex and race also show an important interaction. For girls, schools’ percentage black is negatively related to sports performance. For boys, schools’ percentage black positively associates with sports performance, especially when the models include schools’ social class composition. In other words, predominantly black schools are successful in boys’ sports for their social class composition. More research on the intersection of race and sex is needed.
Our findings supply a way of looking at an old question: are sports a pathway of upward mobility? Our study highlights sports performance as an essential ingredient of success in this pathway and describes how sports performance is distributed along the lines of social class, albeit at the level of schools. Our analyses suggest that the path to winning in sports is narrow for students from working-class backgrounds. Not everyone’s chances are equal. But the data say that working-class youth are not being completely excluded. It’s just that the dice are loaded against them.
Footnotes
Appendix A
Comparison of Schools Likely to Have Athletic Departments and Our Public School and Private School Samples.
| CCD (n = 20,245) | Public School Sample (n = 10,849) | PSS (n = 7,226) | Private School Sample (n = 1,217) | |||||
|---|---|---|---|---|---|---|---|---|
| Mean | SD | Mean | SD | Mean | SD | Mean | SD | |
| Schools’ percentage on free or reduced-price lunch | .5163 | .2574 | .4693 | .2373 | ||||
| District expenditures/pupil (ln) | 9.5350 | .3518 | 9.5005 | .3115 | ||||
| Students per grade (ln) | 4.3814 | 1.2896 | 4.9103 | 1.0909 | 2.7931 | 1.0843 | 3.8838 | .9588 |
| Pupils per teacher | .1536 | .0527 | .1563 | .0437 | .0921 | .0378 | .1116 | .0321 |
| Percentage black students | .1364 | .2232 | .1125 | .2000 | .1273 | .2061 | .0876 | .1431 |
| Percentage Hispanic students | .2111 | .2591 | .1732 | .2267 | .1071 | .1730 | .0873 | .1343 |
| Urban schools | .2138 | .4100 | .1375 | .3444 | .3330 | .4713 | .3977 | .4896 |
| Suburban schools | .2548 | .4357 | .2430 | .4289 | .3492 | .4767 | .3237 | .4681 |
| Rural schools | .5314 | .4990 | .6195 | .4855 | .3179 | .4657 | .2786 | .4485 |
Note: National Center for Education Statistics Common Core of Data; PSS = Private School Universe Survey.
1
We use a simplified model of social class that distinguishes only working- and middle-class families, following Alexander, Entwisle, and Olson (2014). We see these two classes as being of roughly equal size and comprising about 95 percent of the population. Their main difference from each other is in parental education.
2
The problem of erroneously inferring micro-relationships from ecological data can usually be avoided by using a well-specified model, just as in micro-level models (Hanushek, Jackson, and Kain 1974).
3
This argument is based on the logic of Downey, Von Hippel, and Broh (2004), who argue that schools equalize opportunities to learn math and reading.
4
We report findings from all available data. We also examined our findings using more limited samples that included only schools with multiple contests (e.g., 5, 10, 20, or 30 contests). These restrictions did not substantively alter the results.
5
In the school fixed-effects models, we reduce this type of bias by defining PWCSs as such only if they have at least 90 percent on free or reduced-price lunch, which is 2.4 SDs above the mean.