
Abstract
Many African American and Hispanic children are classified as mildly disabled. Although this makes special education services available to these and other children who need them, contention endures as to whether disability classification also is racially (and ethnically) biased. The authors view disability classification as status competition, in which minorities are overrepresented in low-status categories such as intellectual disability and emotional disturbance, and whites are overrepresented in high-status categories such as attention-deficit/hyperactivity disorder and autism. The authors address the racialized construction and evolution of the mild disability classification system along with mechanisms that perpetuate racial segmentation in contemporary classification. They analyze a large federal longitudinal data set (1998–2007) to examine racialization and find that classification continues to operate at least in part as a racial sorting scheme. Implications for research and policy are discussed.
All disabilities are not created equal. Variance in the degree and type of biological, cognitive, and psychological impairments involved in different disabilities is an evident factor in ranking disabilities. But the rank of a disability can also be subject to social valuation (Lamont 2012), as disabilities can serve as status markers that help create and reinforce group distinctions and inequities (Saatcioglu and Skrtic 2019a). Post-traumatic stress disorder (PTSD) is less stigmatizing and thus more desirable than depression because it is constructed to denote factors outside the person’s control as central causes (e.g., accidents, battle conditions), while depression may be perceived as related to personal or internal flaws (Linder 2004). This hierarchy is coupled with gendered diagnosis patterns, whereby PTSD is largely masculinized, at times relegating women who show PTSD symptoms to inferior “anxiety” and “depression” labels and depriving them of important services (Becker and Lamb 1994). Status differentials among disabilities may also change over time. Obsessive-compulsive disorder has gained status over similar disorders such as “hyperactivity” in part because of recent interest in the obsessive-compulsive disorder label by business entrepreneurs as a means to signal tenacity and creativity (Zax 2014), which can open doors to strategic resources and provide advantages over competitors in the marketplace.
This study addresses the status hierarchy of disability categories used in schools and the racialization of that hierarchy. We focus on mild disability categories, including intellectual disability (ID), emotional disturbance (ED), learning disability (LD), attention-deficit/hyperactivity disorder (ADHD), and autism. These differ from strictly biological categories (e.g., visual impairment), as their construction and diagnoses involve considerable subjective judgement (Skiba et al. 2008). We ask whether the mild disability classification system is unduly racialized such that whites are overrepresented in high-status categories and marginalized nonwhites in low-status ones. Some categories have higher status relative to others because they are less stigmatizing and provide students with greater access to regular classroom teachers and peers, the general curriculum, and valued instructional supports (e.g., ADHD and autism) (Fish 2019; Ong-Dean 2009). Our question about racialization of classification bears on an enduring debate about race and disability in schools. Although some argue that classification is racially biased, assigning too many African American and Hispanic students to special education (e.g., Artiles et al. 2010; Skiba et al. 2008; Sullivan 2011), others contend that racial disproportionalities are ultimately related to greater social class and nonschool disadvantages that adversely affect the development of minority children (e.g., MacMillan and Reschly 1998; Shifrer, Muller, and Callahan 2011) and to cultural and linguistic barriers that undermine minority parents’ interaction with the special education system (e.g., Morgan et al. 2015). Empirical findings on the role of race (and ethnicity) in classification have been mixed because of limitations in data and estimation procedures (for reviews, see Morgan et al. 2015; Shifrer 2018; Waitoller, Artiles, and Cheney 2010). But a larger problem is that the debate itself tends to view disability classification monolithically, paying little attention to the status order among the categories involved. This problem transpires in two ways. Some studies address racial disproportionality in the special education domain as a whole despite the internally differentiated, multicategorical nature of that domain (e.g., Blanchett 2006; Sullivan and Artiles 2011). Other studies either focus on racial patterns in a specific disability category—providing insights that may not be generalizable to other categories (e.g., Cullinan and Kauffman 2005; Travers and Krezmien 2018)—or, when they do address multiple categories, they lack a proper theorization of the status order among categories and thus analyze racial patterns for each category separately (e.g., Morgan et al. 2015, 2017) as opposed to a comparative approach that estimates racial risks for any given category while adjusting for risks for all other categories.
The study of the role of race in disability classification is incomplete without a thorough account of the status hierarchy among the categories involved because although marginalized minorities may be overrepresented in some categories, they may be underrepresented in other, more desirable ones in which whites may be overrepresented. We conceptualize mild disability classification as status competition, a process in which groups vie for status by seeking control over more attractive categories (Weber [1921] 1978). In what follows, we first set the theoretical stage for our analysis by addressing the racialized construction and evolution of the mild disability classification system along with mechanisms and practices that perpetuate racial patterns in contemporary classification. We then describe our data (from the 2000s) and our methods, involving a novel procedure to estimate the role of race in classification net of achievement, behavior, and social class. Our findings reveal a pattern of racial segmentation in mild disability classification consistent with the status competition perspective.
Hierarchy of Mild Disability Categories
A stylized depiction of the racialized construction and evolution of the mild disability classification system is shown in Figure 1. In the following, we discuss the origins of each major category and how the entire categorical scheme expanded and changed over time as racial segmentation in it persisted. Our data address classification patterns in the 2000s, but these contemporary patterns and the related status order of categories involved cannot be properly understood without a historical account of how such arrangements have come about.

A stylized depiction of the status hierarchy of and racial disproportionality in major mild disability categories over time.
Racialized Roots of “Intellectual Disability” and “Emotional Disturbance”
ID (formerly mild mental retardation) and ED have invariably been the lowest status categories in mild disability classification in schools. Both have racialized roots that can be traced back to progressive era fears of the “feebleminded,” who were cast by eugenicists as a menace that had to be controlled to prevent social degeneracy (Carey 2009). Because feeblemindedness was defined flexibly, dominant white groups were able to use it to reinforce the inferior standing of not just the poor (Frankenberg 1993) but, in particular, racial minorities and immigrants, stereotypes of which merged into “the negative image of the feebleminded person of color” (Carey 2009:64). Methods of control such as compulsory sterilization and segregation were advocated by elites, codified by legislators, and carried out by social workers and educators (Carey 2009). Schools were seen as “ideal site[s] for early diagnosis, labeling, . . . and channeling of individuals into institutions” (p. 73). Public school “special classes” were considered one of the most important means for control of feeblemindedness as a community problem (Doll 1929). This system first developed in large cities before World War I and expanded from then to the 1950s in tandem with increased bureaucratization of schools (Hoffman 1974). Students labeled intellectually disabled were removed from regular classrooms and placed in special classes on the basis of biased IQ tests (Lazerson 1983). Although eugenics was discredited in the 1930s, its mythology, blending views on genetics of disability with those of racial inferiority, helped make mental testing a means to limit minority education (Harry and Klingner 2014). Children considered emotionally disturbed and socially maladjusted (e.g., incorrigible, delinquent) were removed to special “disciplinary classes” (Hoffman 1974), again with eugenics mythology justifying removal by linking theories of subcultural deviance and minority mental disorder (Mercer 1973). These factors were key in concentration of minority children in what became the highly stigmatized categories of “mentally retarded” and “emotionally disturbed,” which were codified as such in the Education for All Handicapped Children Act of 1975 (reauthorized in 1990 as the Individuals with Disabilities Education Act [IDEA]). This law continues to govern classification and placement.
The low status of ID and ED has become entrenched in public attitudes outside of schools as well. In his seminal study of “preference hierarchy” regarding a wide range of disabilities, Tringo (1970) used a social distance metric to rank disabilities on the basis of ratings that ranged from “I would marry [a person with this disability]” to “I would exclude this person from my country.” ID and other “brain injured” conditions were rated not just below sensory impairments (e.g., blindness, deafness) but also below serious physical disabilities and visible impairments with aesthetic impacts (e.g., paraplegia, dwarfism). ED was ranked even lower, at the very bottom, along with other “psychogenic conditions” such as substance abuse. Tringo’s findings were reaffirmed multiple times over the next three decades. This included an 8-year longitudinal study showing that his hierarchy was highly stable and consistent across 50 sampling categories (Harasymiw, Horne, and Lewis 1976), a meta-analysis of 44 studies from 1968 to 1994 showing that the hierarchy exhibited a high level of stability (Dear et al. 1997), and a 30-year replication study (Thomas 2000) in which the hierarchy generated was in near perfect agreement with Tringo’s original work.
Rise of “Learning Disability” as a Disproportionately White, High-Status Category
As depicted in Figure 1, LD gained popularity in the 1960s as a high-status alternative to ID and ED. It too was racialized, in favor of whites. It denotes cognitive processing difficulties in circumscribed areas such as reading or math rather than more extensive and stigmatizing intellectual or emotional issues. Although LD’s severity may vary, in some cases requiring removal from the regular classroom for at least part of the school day, most white students labeled LD were diagnosed with “mild LD” and were able to remain in the regular classroom with additional services and accommodations provided, such as paraprofessional support (teacher’s aides) and extra time on tests (Ong-Dean 2009). LD’s emergence coincided with white middle-class parents’ search for a label for their children who were failing under higher academic standards set after the launch of the Soviet satellite Sputnik (Sleeter 1986). These parents wanted a category to differentiate their children from poor and minority children in the ID and ED categories. Schools used ID and ED to explain why lower class and minority children could not keep up with the general curriculum in regular classrooms. LD, by contrast, carried a lower risk for removal from these classes (Crawford 2004). Also, white middle-class parents benefited from the idea of organic damage as LD’s cause, as it explained academic problems without raising questions about middle-class homes’ cultural integrity (Sleeter 1986). It was the most desirable category for a failing child with an IQ and behaviors that otherwise predicted success (Carrier 1986). While ID and ED indicated developmental and social problems attributed to minority culture, LD helped maintain the superiority of white culture and facilitated better academic outcomes (Sleeter 1987). The additional services LD made available within the regular classroom became an incentive for some parents to seek the LD label even when their children’s difficulties were minimal or nil (Ong-Dean 2009).
By the mid-1970s, LD’s favorability over ID and ED was also recognized in society at large. Abroms and Kodera (1979) found LD to be socially ranked well above not just mental and emotional problems but also “common physical ailments” (e.g., asthma, arthritis) and sensory impairments (e.g., blindness, deafness). This finding was reaffirmed in subsequent studies that determined that LD was seen as a disability amenable to treatment, unlike ID and ED, which denoted less treatable problems (e.g., Albrecht, Walker, and Levy 1982; Westbrook, Legge, and Pennay 1993). Although LD remains a higher status category than ID and ED (Aiken 2002; Ong-Dean, Daly, and Park 2011), it has gradually lost ground in recent decades to more contemporary mild disability categories such as ADHD and autism, and as we address later, it also has become a disproportionately nonwhite category in the process.
Racial Queuing in Classification
In status competition, dominant groups often vacate high-status categories only to move up to new, more advantageous categories as subordinate groups strive to catch up and emulate (Collins 1979; Simmel 1957; Veblen [1899] 1994). This constitutes a queuing dynamic whereby categories are akin to rungs on a ladder, and higher rungs remain subject to “social closure” (Parkin 2001) until rungs that are even higher emerge or are constructed. Women make inroads to previously masculinized, high-status jobs when men move out to masculinize new, more lucrative jobs (Reskin and Roos 1990). Minorities move into traditionally more desirable neighborhoods typically when predominantly white affluent residents relocate to more attractive locations (Lacy 2016). Low-income consumers gain greater access to once trendy goods and services when higher income consumers turn their attention to other goods and services with growing popularity (Berger and Heath 2008). In each such case, dominant group affiliation with the new status marker infuses that marker with even more status.
The queuing dynamic in mild disability classification involved the racial flip of LD from white to nonwhite as whites migrated to ADHD and autism (see Figure 1). LD remained disproportionately white from the 1960s to late 1990s. As of 1994, only 17 percent of children classified as LD were Black, while 70 percent were white (USDOE 1998). But by 2000, these figures had changed to 44 percent and 50 percent, respectively, for whites and Blacks (USDOE 2002). Although Blacks remained overrepresented in ID and ED, they also came to be overrepresented in LD by the late 2000s (USDOE 2011). Hispanics were overrepresented in LD only in some states during this period (Waitoller et al. 2010), but starting in 2000s they became overrepresented nationally (USDOE 2005, 2007, 2017). Greater minority access to LD coincided with white exodus to ADHD and autism. Whites increasingly viewed ADHD and autism as the new high-status labels (Ong-Dean 2006). Many schools facilitated minority overrepresentation in LD by using this category to limit minority access to the regular classroom, which also brought additional federal funds to schools. Although white LD students historically have remained in regular classrooms by way of “mild LD” diagnoses (and with additional supports such as paraprofessionals and extra time on tests), severe cases of LD may require removal from the regular classroom for at least part of the school day. According to Skrtic and McCall (2010), as LD became increasingly nonwhite, “severe LD” diagnoses were often used to free predominantly white regular classroom teachers from having to work with minority children they saw as “hard to teach.” This is a central reason why LD has not resulted in the same degree of regular classroom placement for minorities that it once did for whites (Blanchett 2010; Ong-Dean 2009; Ong-Dean et al. 2011). Because placement outside the regular classroom is more costly, requiring specialized staffing and facilities, schools receive extra funds to serve “excluded” students. In this regard, increased minoritization of LD also has led to greater revenue for schools or to what Skrtic and McCall (2010) referred to as institutional “gravy.”
ADHD has emerged as a desirable category relative to LD for multiple reasons. First, rather than denoting inherently cognitive impairments—broad or limited—it principally signifies difficulties in doing school, for instance, sustaining attention, completing assigned tasks, and sitting still (American Psychiatric Association 2013). Although ADHD may manifest itself as a behavioral disorder, it does not raise fundamental questions about essential academic capabilities. This significantly limits the nature of the stigma involved relative to LD, ED, and ID (see Crenshaw 2014; Mooney and Call 2014). Relatedly, as most ADHD students need support typically for maintaining focus and following classroom instruction, they often can remain in the regular classroom when additional services and accommodations are provided (Reid and Knight 2006). Moreover, most cases of ADHD can be treated with medication (e.g., Ritalin, Adderall), which may nullify symptoms to a degree that helps students function effectively in the regular classroom even without valued services and accommodations (Jacobs 2005). 1 Finally, although regular classroom teachers tend to view ADHD negatively, they are unlikely to see students with ADHD as “threatening” (Anderson et al. 2012), unlike how students with ED at times can be viewed. ADHD is included in the IDEA category of “other health impaired” (OHI), which grew by 3.5 times in the 1990s, largely because of growth in ADHD (Stevens and Ward-Estes 2006; USDOE 2000, 2001), a diagnosis that by the late 1990s and early 2000s was held by more than two thirds of children categorized as OHI (Forness and Kavale 2002). By 2007, whites were 29 percent more likely than Blacks and 53 percent more likely than Hispanics to be identified as OHI, including ADHD (USDOE 2011).
As for autism, it was once a highly stigmatizing label given negative features such as social detachment, and it was conflated with childhood schizophrenia (Feinstein 2010). Unlike ID and ED, however, autism was not a disproportionately nonwhite category, as it often was used for middle- and upper-class white children (Bettelheim 1967; Kanner 1949), though far less commonly than LD. New evidence in the 1960s (Rimland and Tukey 1964) repositioned autism away from childhood schizophrenia, setting the stage for gradual change in views on the label in the 1970s and particularly the 1980s. This coincided with categorical revaluation (Eyal 2013) whereby autism’s definition was stretched to include positive traits such as creativity and high intellect (the “Rain Man” effect) (Wolff 2004), helping elevate autism over LD (Ong-Dean 2006). Today, far from being stigmatized, autism is seen by some as a sign of being “super smart” (Grandin and Barron 2005), as a condition endowed with “savant qualities” (Ong-Dean 2009). Students labeled autistic may be seen not just as merely capable of handling the general curriculum in regular classrooms but at times as important “assets” to peers in such classrooms given the degree of intellect they can bring to the setting, especially when supported by additional services and accommodations (see Fish 2009). In 1992, IDEA began requiring states to use autism as a category covering conditions ranging from classic autism to less severe forms such as Asperger’s syndrome and other types of high-functioning autism (Ong-Dean 2009). Between 1992 and 1999, the number of children labeled with autism grew by 2.5 times (USDOE 2000). By 2007, whites compared with Blacks and Hispanics, respectively, were 39 percent and 45 percent more likely to be labeled with autism (USDOE 2011). White children, compared with minority peers with similar issues, are given the autism label not just more readily but also earlier (Mandell et al. 2002).
Literature on Mechanisms Perpetuating Racialization
The broad body of scholarship we have reviewed sets the stage for our empirical examination of racial patterns in contemporary classification: the 2000s period shown in Figure 1. We hypothesize that whites are overrepresented in high-status categories—ADHD and autism—and marginalized minorities (African Americans and Hispanics) are overrepresented in low-status categories—ID, ED, and LD. Before we discuss our data and methods, we address existing knowledge on principal factors that perpetuate racial segmentation in classification. These highlight what transpires backstage in the classification domain, behind the bureaucratic veil of educational systems and processes that are notoriously difficult to observe and that remain unmeasured in large, national data sets that provide broad information on race and classification, the type of data we rely on in our analysis.
A central element is the potential bias in assessments and how they are used. For instance, IQ tests, critical historically in ID diagnosis, traditionally have been criticized for overreferencing white culture, thus depressing Black scores (Gordon and Rudert 1979). Recent reviews indicate reductions in such biases (see Waitoller et al. 2010), but critics assert that the “cultural load” problem persists (e.g., de la Cruz 1996), along with stereotype threats (Steele 2003) affecting minority performance not just in IQ but in achievement tests, which also play a role in LD diagnosis. Behavioral rating scales used in ED diagnosis have been criticized for mischaracterizing cultural differences between whites and nonwhites as symptoms of disorder for nonwhites (Coutinho and Oswald 1998). Taylor, Gunter, and Slate (2001) found that depending on how it is used, the same scale can portray Blacks as exhibiting problematic behaviors compared with whites (for a counterview, see Cullinan and Kauffman 2005).
Given their latent nature, there are no objective assessments and methods to diagnose mild disabilities, unlike biological impairments, which can be observed with limited subjective judgment. The role of subjectivity underpins a second factor that can perpetuate racialization: professional bias by regular classroom teachers and special educators (Harry and Klingner 2014). Classification often is initiated by regular classroom teachers who refer children for evaluation. But predominantly white, relatively affluent teachers can misperceive minority attitudes and behavior as problematic or even oppositional, associating them with low-status disability categories (Prieto and Zucker 1981). This is more likely when educators receive inadequate preservice preparation (Blanchett 2006) or are disinclined to serve children with needs that require greater teacher effort (Ysseldyke and Algozzine 1983). Teacher biases carry substantial weight in diagnosis. Classification errors due to subjective judgment have been well documented (Klingner and Harry 2006; Ysseldyke 1987). This is because it can be difficult to clearly connect specific behaviors to distinct categories, because of symptom overlaps. It is possible to associate disruptive behavior and emotional issues with ID, ED, and LD (Landrum 2011; Polloway, Patton, and Nelson 2011; Pullen et al. 2011) as well as with autism (Scattone et al. 2002) and ADHD (Anhalt, McNeil, and Bahl 1998). Likewise, low achievement is a common characteristic across multiple disabilities (Donovan and Cross 2002). If racial biases are present, whites and minorities with similar symptoms may be assigned to different categories (Skiba et al. 2008).
The third principal factor that perpetuates racialization is the regulative context. Classification is regulated for equity by IDEA, which does not account for disparities in parental influence to affect classification. This is because the egalitarian impulses that produced IDEA were undercut by its judicial interpretation and the design of its procedural safeguard provisions (Ong-Dean 2009). These provisions, “parent participation” and “procedural due process,” empower parents to hold schools accountable for complying with IDEA’s substantive provisions: “nondiscriminatory evaluation,” “appropriate education,” and “least restrictive environment” (
Data and Methods
We rely on the federal Early Childhood Longitudinal Study–Kindergarten Class of 1998–1999 (ECLS-K). The kindergarten cohort includes 21,250 children observed in first, third, fifth, and eighth grades (through 2007). Sample weights ensure representativeness and adjust for attrition. We focus on white, Black, and Hispanic children (total base year n = 18,713). 4 All measures used in our analysis are shown in Table 1. 5 Selected base year descriptive statistics are listed in Table 2. Information on six categories is available. In addition to ID, ED, LD, OHI (composed largely of ADHD), and autism, which are of primary interest in our analysis, the data also provide information on speech-language impairment (SLI). Many issues covered by the SLI category, such as stuttering, stammering, and other articulation problems, can be verifiably observed and diagnosed and are thus less open to racial bias in identification and diagnosis. But SLI also covers more subtle language issues, such as difficulty in expressing ideas and improper use of words and their meanings, which do involve varying degrees of subjective clinical judgement for identification and diagnosis and are thus more open to bias (Snowling et al. 2006). Some studies find that marginalized minority students are overrepresented in SLI (Deninger 2008), particularly in locations serving predominantly white students (Robinson and Norton 2019). Others find that marginalized minority students are underrepresented in SLI, at times to their detriment as they are deprived of important support services (Office of Special Education and Rehabilitative Services 2016). We include SLI in our analysis without a priori expectations, as there is limited theoretical, historical, or empirical basis to classify SLI as a high- or low-status category. Including SLI is important also because it can improve multinomial adjustments to risk estimates for other mild disabilities. As we explain later, in our analysis we take a comparative approach in estimating racial risks for a category while adjusting for risks for all other mild disability categories. In each wave of ECLS-K, special education teachers for children receiving services provided the disability category information.
ECLS-K Measures Used in the Study.

Note: ADD = attention-deficit disorder; ADHD = attention-deficit/hyperactivity disorder; ECLS-K = Early Childhood Longitudinal Study–Kindergarten Class of 1998–1999; FIPS = Federal Information Processing Standard; IRT = item-response theory; OHI = other health impaired; SES = socioeconomic status.
Original measure was respecified with truncation at 10.
Descriptive Statistics for Base Year Sample (n = 16,201).
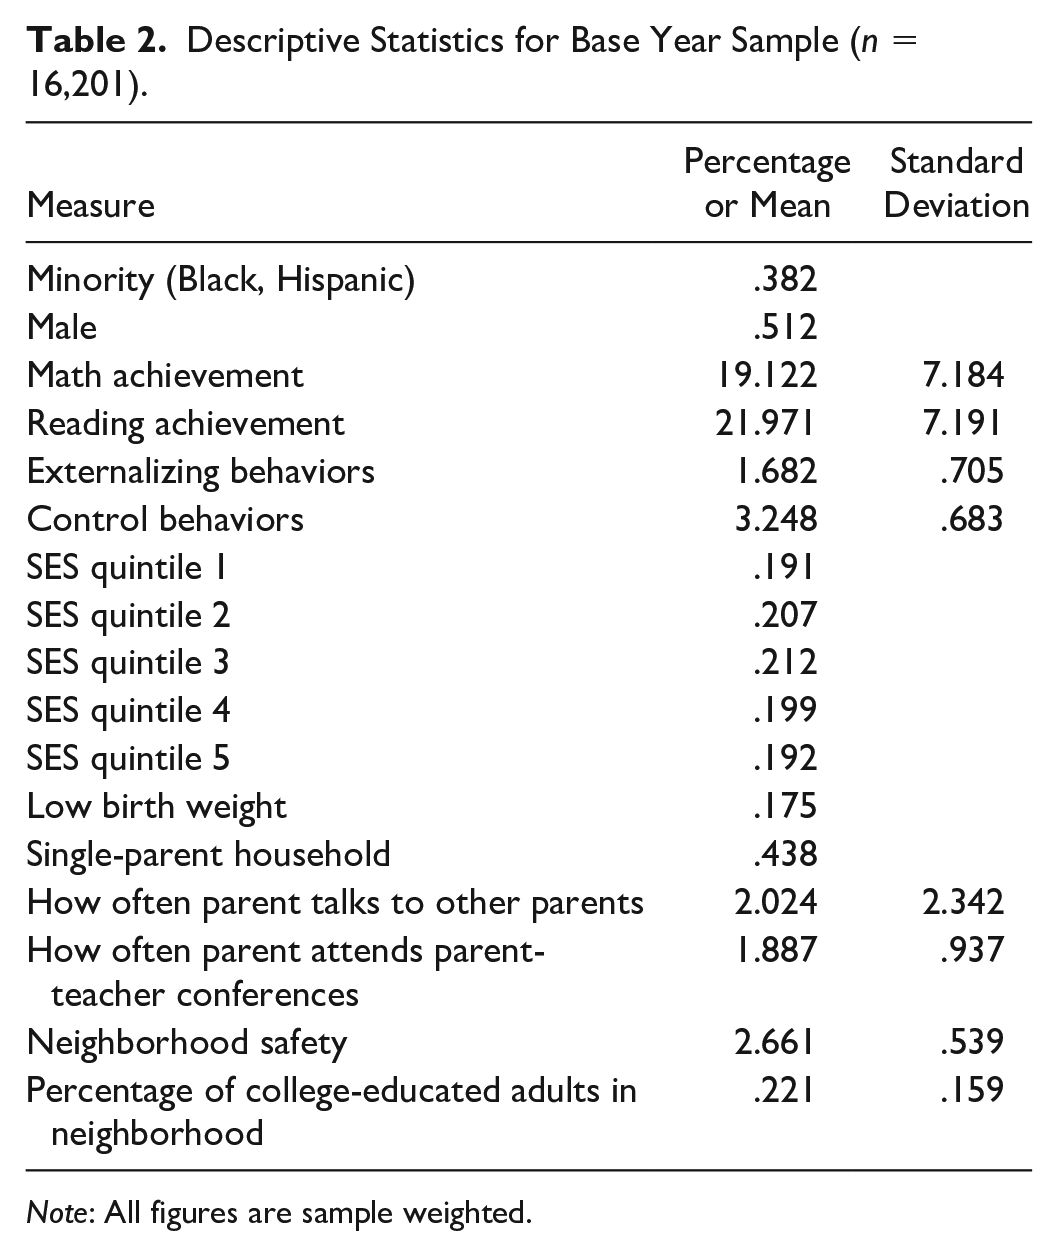
Note: All figures are sample weighted.
Achievement and Behavior
For all disability categories we address, achievement and behavior are central criteria in identification and classification. Controlling for these factors is critical in determining whether white and nonwhite students with similar behavior and performance are classified differently. For achievement, we use scores for mathematics and reading assessments involving a wide range of grade-level skills. The assessments are individually administered, untimed, and psychometrically validated (θ ≥ .90 across data waves). The scores are relative to all other students in the sample. There is little differential item functioning and no floor or ceiling effects. For behavior, we follow Morgan et al. (2015) and use measures of externalizing and self-regulatory behaviors, rated by the regular classroom teacher. These are based on an adapted version of Gresham and Elliot’s (1990) four-point Social Skills Rating Scale, varying from “never” to “very often.” Externalizing behaviors include arguing with the teacher, fighting, showing anger, acting impulsively, and disturbing the class (Cronbach’s α ≥ .85 across data waves). The self-regulation scale addresses paying attention in class, keeping belongings organized, working independently, eagerness to learn new things, adapting to changes in routine, and persisting in task completion (Cronbach’s α ≥ .89 across data waves). These were not measured in eighth grade. Thus, we used fifth grade scores. As Morgan et al. noted, earlier research has established that elementary schoolchildren’s behavioral functioning is stable over time (e.g., Lin et al. 2013; Shaw, Lacourse, and Nagin 2005).
Social Class
Children’s risk for disability classification can vary as a function of social class position. Low-income children may be deprived of family and community conditions that adversely affect their growth and development, making them more prone to disabilities (MacMillan and Reschly 1998; Shifrer et al. 2011). Low-income children also may lack parental resources and efficacy, which can adversely affect disability identification and classification (Ong-Dean 2009). Thus, controlling for class is critical in determining race-specific differences in classification, differences net of home, neighborhood, and parental resources and endowments. There is strong evidence that minorities can face discrimination and bias in various domains irrespective of class, including in law enforcement (Weitzer and Tuch 2002), employment (DiTomaso 2013), housing (Pager and Shepherd 2008), health (U.S. Department of Health and Human Services 2014), and education (Ogbu 2003). With regard to health, a recent study published in the New England Journal of Medicine showed that diagnostic norms, procedures, and algorithms were racially biased, irrespective of social class, for nearly a dozen broad medical conditions, covering a range of ailments (Vyas, Einstein, and Jones 2020). Another recent study showed that higher income African Americans are prone to experiencing the same types of prejudices and discriminatory treatments that lower income African Americans report (see Booker 2017; Harvard Opinion Research Program 2021). In that study, 65 percent of Blacks with incomes greater than $75,000 reported having been discriminated against, compared with 40 percent of Blacks earning $25,000 or less. Thus, affluent Blacks, depending on context, may experience even more discriminatory treatment, as they may be seen as encroaching on privileged white spaces. Given the literature on the historically and persistently racialized nature of mild disability classification in schools, our objective is to estimate the average role of race in classification net of achievement, behavior, as well as class. 6
We use multiple social class measures. First is socioeconomic status (SES), involving household income and parents’ education and occupation, provided as quintiles in the data. Second, we use low birth weight (<5 lb), which is a problem related to low income, undermining growth and development (Hill, Brooks-Gunn, and Waldfogel 2003). It is correlated to risk for low-status labels (Reschly 1996). This risk is affected also by our third measure, family structure (one vs. two parent). One-parent households, more common among lower income groups, can lack efficacy in child rearing (McLanahan and Sandefur 1994). Fourth, we measure social capital by frequencies of (1) parent talking to the child’s classmates’ parents and (2) parent attending parent-teacher conferences. These denote the capacity to shape the child’s educational experience (Lareau 2003). For community effects, we use a parent-reported safety measure (“not at all safe to play outside,” “somewhat safe,” “very safe”) and the percentage of college-educated adults in the census tract. The safety measure is a proxy for disorder (MacMillan and Reschly 1998), and adult education is a proxy for affluent role models (Coleman 1987), which affect development.
Controlling for Sex and State Fixed Effects
Men and women have different risks for disability identification. Since the 1960s, male students in special education have outnumbered female students by up to three times (e.g., Coutinho and Oswald 2005; Mumpower 1970). This difference is particularly salient in mild disability categories we address, as opposed to strictly biological ones involving less subjective judgment for identification, diagnosis, and classification (Halfon and Newacheck 1999). The debate on the reasons for male overrepresentation addresses biological and behavioral factors, as well as selection biases (Kvande, Belsky, and Wichstrøm 2018; Wehmeyer and Schwartz 2001). Although this debate is beyond the scope of our analysis, sex differences are important to account for when estimating the role of race in disability.
Finally, we include state fixed effects as controls because identification and classification practices and norms vary by state. For instance, state regulations may introduce modest variation in criteria and processes for labeling, including the structure of IEP meetings, as well as variation in associated instructional and professional cultures that affect classification (Scull and Winkler 2011).
Analytical Approach
We rely on the propensity score (PS) method to estimate racial patterns in classification. This is a multistage procedure. In the first stage, we regress race on achievement, behavior, and social class. Predicted values (propensities or probabilities for minority status) from this stage are then used in the second stage, in which white and nonwhite students are compared for disability classification. This two-stage approach approximates an experiment in which the first stage involves a proper set of predictors related to both race and classification, which is why we use in stage 1 a rich array of measures for achievement, behavior, and social class available in ECLS-K. The conventional approach to using PSs is the “PS matching” (PSM) procedure, whereby individuals in the treatment group (minority) are empirically matched to those in the control group (white) on the basis of predicted values from stage 1 (Guo and Fraser 2014). This is effective when cell sizes for key measures allow robust estimation after unmatched cases are dropped (even when cell sizes are sufficient, dropping cases may still undermine statistical power). PSM is infeasible in our case because of limited cell sizes for important disability categories, particularly autism, ID, and ED. Although sampling weights can alleviate cell size problems when running single-stage models, PSM results in the exclusion of (unmatched) cases to a point at which classification risks for certain disabilities become inestimable, destabilizing the overall analysis when the aim is to estimate racial risks for any given category while adjusting for risks for all other categories (for more detail on PSM’s shortcomings in this regard, see Saatcioglu and Skrtic 2019b).
We therefore use an alternative to PSM, namely PS reweighting (PSR). Here, PSs from stage 1 are used to reweight the entire data in a way equivalent to PSM, but no cases are dropped (see Busso, DiNardo, and McCrary 2014 on similarities of PSR and PSM). PSR is widely used in estimating effects of gender and other demographic biases in earnings differentials (e.g., DiNardo 2002; DiNardo, Fortin, and Lemieux 1996). For instance, if the gender effect is conflated with those of education and social status, specifying all three measures as competing predictors in a single-stage model may be problematic given the elusiveness of the correct functional form for the model (see Brunell and DiNardo 2004; DiNardo 2002; Oaxaca and Ransom 1994). PSR transcends this problem, as educational attainment and social status would be used as “selection” variables in stage 1 to generate PSs for gender status, scores that are then used to reweight the data in stage 2, in which earnings are regressed on gender, without specifying educational attainment and social status as controls in that stage. We take advantage of this procedure in deconflating race effects from those of achievement, behavior, and class in estimating disability classification. As noted earlier, there is strong evidence that minorities can face discrimination in various domains irrespective of affluence, merit, and credentials. Thus, if there is racial bias in disability classification, minorities may face discrimination even when they are comparable with whites in achievement, behavior, and social class.
In stage 1 of the PSR method, we estimate the odds of being a minority (Black/Hispanic) student (Ri) using the following logistic model 7 :
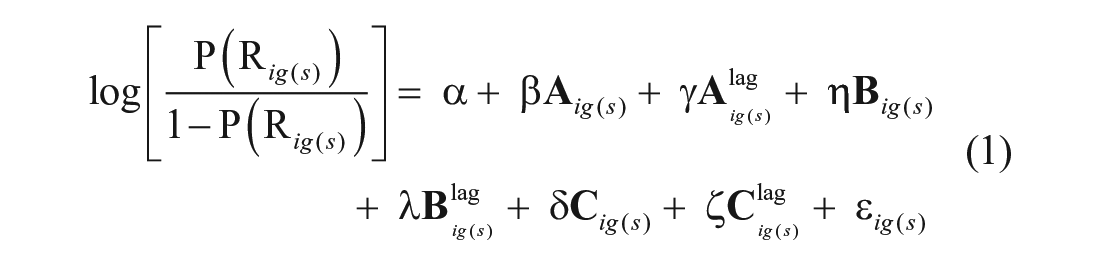
where, for student i in grade g and with sample weight s,
Using predicted values (pi) from equation 1, we assign 1/pi to minority children and 1/(1 – pi) to white children (see Busso et al. 2014; Nichols 2008). These weights homogenize minority and white means for achievement, behavior, and social class. They also can be adjusted to account for original sample weights. Thus, the final weights (wig) are specified as follows:


where, for student i in grade g with sample weight s, p is the predicted value from equation 1.
In stage 2 of the PSR method, the weights are used in estimating racial differences in classification by way of a multinomial model:
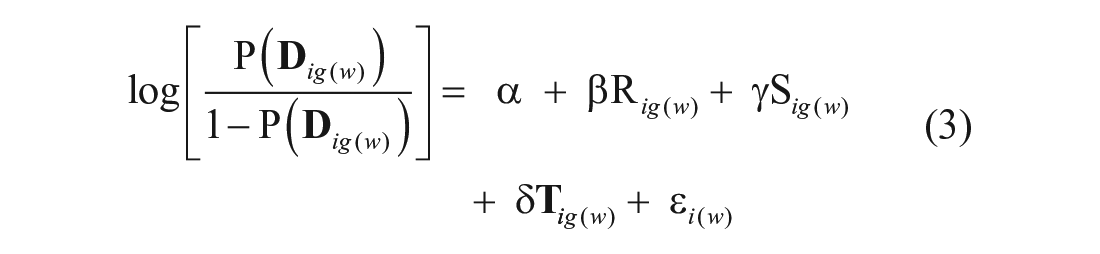
where, for student i in grade (wave) g with analytic weight w,
Finally, we run our entire analysis for any given grade twice, first without constraints on prior classification and then with constraints on prior classification. In unconstrained runs (except for the kindergarten run), we include children classified for any disability in earlier waves, to examine how different categories can cumulatively become racialized over time. In constrained runs, we take a discrete approach, whereby estimation for a given grade level includes only those students who were identified for a disability in that grade and not earlier. Together, the constrained and unconstrained runs help examine whether some students in one label at a given grade move from that label to another one as they advance to the next observed grade. For instance, in third grade, if cumulative runs (which include all third graders regardless of prior labeling) show a given disability category as disproportionately white, while discrete runs (excluding third graders labeled in earlier grades) show the same category as not disproportionately white, this would mean that white students labeled for a different disability in kindergarten or first grade switched their labels in third grade. The constrained and unconstrained approaches, in tandem, test for such cross-category journeys across grades.
Findings
Tables 3 and 4 report odds ratios for whites over nonwhites (details are provided in Tables A1 and A2 in the Appendix). Table 3 shows odds ratios without constraints on prior classification. Table 4 shows ratios with constraints on prior classification. The first columns in the tables are identical, as there are no prior grades. The findings provide strong support for the status competition perspective. We see evidence of minority overrepresentation in low-status categories and white overrepresentation in high-status categories. Moreover, white privilege is selectively manifested across grade levels in ways that expose the strategic nature of high-status category hoarding by whites.
Odds Ratios of Whites over Nonwhites for Disability Categories: Cumulative Estimates.

Note: Children classified for disability in prior data waves are included in grade-specific estimations. For details, see Table A1. All estimates are adjusted for achievement, behavior, social class (see the section “Analytical Approach”). AU = autism; [BH] = Black/Hispanic overrepresentation (green shading); ED = emotional disturbance; ID = intellectual disability; LD = learning disability; OHI = other health impaired; SLI = speech-language impairment; [W] = white overrepresentation (yellow shading); [=] = no overrepresentation.
p ≤ .001.
Odds Ratios of Whites over Nonwhites for Disability Categories: Discrete Estimates.

Note: Children classified for disability in prior data waves are not included in grade-specific estimations. For details, see Table A2. All estimates are adjusted for achievement, behavior, social class (see the section “Analytical Approach”). AU = autism; [BH] = Black/Hispanic overrepresentation (green shading); ED = emotional disturbance; ID = intellectual disability; LD = learning disability; OHI = other health impaired; SLI = speech-language impairment; [W] = white overrepresentation (yellow shading); [=] = no overrepresentation.
p ≤ .001.
Low-Status Categories
Minorities are overrepresented in LD in all grades in Tables 3 and 4. Table 3 shows that in kindergarten, the odds of whites for the LD category are about 22 percent less than the odds of minorities (.787, p ≤ .010). This difference is largely similar in subsequent grades in both Table 3 and Table 4, except for first grade. In Table 3, white first graders’ odds for LD are about 44 percent less than the odds for minorities (0.564, p ≤ .010), but in Table 4, white odds are only 6 percent smaller (0.941, p ≤ .010). This suggests that the greater odds ratio in Table 3 is related to those nonwhites classified for disabilities in kindergarten. The smaller but significant odds ratio in Table 4 may reflect limited overrepresentation of minorities specifically in first grade, alone or in conjunction with rise in white LD labeling. Regarding the latter possibility, it may reflect the advocacy of less privileged white parents who, though lacking the efficacy of the more privileged ones to appreciate and secure the less stigmatizing labels in kindergarten (such as ADHD), were able to get their struggling children classified with LD in first grade (Lalvani and Hale 2015).
The pattern for ED is like that for LD, indicating minority overrepresentation across grades, with similar odds ratios in Tables 3 and 4, except for eighth grade. Table 3 shows that in eighth grade, white odds for ED are 65 percent smaller than nonwhite odds (0.349, p ≤ .010), but this involves students classified for disabilities earlier. In Table 4, focusing on eighth graders not classified earlier, we observe racial parity (1.124, p ≥ 0.100). This involves children who may have been classified for a disability in sixth, seventh, or eighth grades. A possible explanation is that dropouts reduce the number of minority ED classifications in eighth grade. Twice as many Black students with ED classifications drop out (58.2 percent) as graduate (27.5 percent; Valdes, Williamson, and Wagner 1990), and about 8 percent drop out before entering ninth grade (Osher, Morrison, and Bailey 2003). Hispanic ethnicity and behavioral problems also are related to dropping out (Swanson and Schneider 1999).
We find evidence of minority overrepresentation in ID as well, except in kindergarten (1.002, p ≥ .100) and, in Table 4, in fifth grade (1.053, p ≥ .100). The kindergarten finding could be the result of reluctance to identify any child with ID early on to avoid premature and potentially self-fulfilling labeling (Danaher 2011). 9 Alternatively, or perhaps in conjunction, schools may be inclined politically to refrain from using ID for minorities, given the high degree of stigma involved and the category’s historical overuse particularly for Blacks (Skiba et al. 2008). As seen in Table 3, from first grade onward, ID involves minority overrepresentation. But Table 4 shows that for children not labeled in third grade or earlier, there is no minority overrepresentation in ID in (fourth or) fifth grade (1.053, p ≥ 0.100). This could be due to a decline in nonwhite representation and/or an increase in white representation. The former possibility seems unlikely, given the pattern of nonwhite overrepresentation in all grades without constraints on prior classification (Table 3) and in all grades but (fourth) and fifth grade with constraints (Table 4). As for the latter possibility, less privileged white parents may have resisted ID through much of elementary school, only to resign themselves to it and its restrictive instructional placement (Skiba et al. 2008) as a protective strategy in middle school. That is, they may have enacted a form of advocacy similar to but less effective than that observed for privileged whites and OHI in kindergarten and fifth grade. Here, upon recognizing in fourth or fifth grade that their children may have difficulties in middle school, less privileged whites, like more privileged ones, may address the issue but lack the efficacy to distinguish and advocate for a higher status category than ID (Ong-Dean 2009). Given this interpretation, minority overrepresentation in ID in eighth grade in Table 4 may reflect a continuation of elementary-grade increases across sixth, seventh, and eighth grades. Table 4 shows that white odds for ID were 8 percent smaller than nonwhite odds in first grade, 25 percent smaller in third grade, and 57 percent smaller in eighth grade. Regarding fifth grade, whether it was a decrease in minority representation in ID and/or an increase in white representation, it apparently was enough to achieve parity in the discrete analysis.
High-Status Categories
Whites are overrepresented in OHI, denoting largely the ADHD category, in kindergarten and fifth grade but not in other grades. This indicates that white parents may be using ADHD’s advantages in transition points: in kindergarten before elementary grades and in fifth grade before middle school. Focusing on kindergarten first, white odds are nearly 31 percent greater than minority odds (1.305, p ≤ 0.001) (in both Table 3 and Table 4). ADHD is a high-status category, as it is less stigmatizing and provides valued supports (e.g., paraprofessionals, time-extended tests) in the regular classroom. These can remedy problems prior to first grade to support performance in elementary school and beyond (Schnoes et al. 2006). White parents who recognize their children’s early needs may engage in advocacy for an ADHD label to meet those needs before elementary grades (Ong-Dean et al. 2011). As for fifth grade, white odds for OHI in Table 3 are 7.5 percent greater than nonwhite odds (1.075, p ≤ 0.001), and more notably, in Table 4, white odds for OHI are 62 percent greater (1.623, p ≤ 0.001). White overrepresentation is particularly high for fifth graders who are not classified for disabilities earlier but receive labels in either fourth or fifth grade (we observe only fifth grade). This reflects the same type of advocacy by whites that we suggest is operating in kindergarten. The difference is that white parents acting in upper elementary grades may have been confident that their children would succeed in prior grades but, given their actual performance, became concerned that they would not succeed in middle school without services and accommodations afforded by ADHD. The smaller fifth grade odds ratio for OHI in Table 3 (compared with Table 4) may reflect a continuation of elementary-grade increases in minority OHI representation into fourth and fifth grades, such that in fifth grade, the cumulative minority representation absorbed most of the discrete overrepresentation.
Regarding autism, we find a uniquely striking pattern. As seen in Tables 3 and 4, although white odds for autism are smaller than nonwhite odds in kindergarten, the difference is notably small, with the ratio less than 5 percent lower (0.955, p ≤ 0.010). And as seen in Table 4, there is strong evidence of racial parity in autism from all subsequent grade-specific models. Thus, when a model is constrained to students not classified for a disability earlier, white odds for autism are the same as minority odds. But Table 3 reveals a different story. Relative to nonwhite odds, white odds for autism are one third greater in first grade (1.335, p ≤ 0.010), 44 percent greater in third grade (1.436, p ≤ 0.010), 61 percent greater in fifth grade (1.606, p ≤ 0.010), and 52 percent greater in eighth grade (1.522, p ≤ 0.010). When constraints on prior classification are removed, autism increasingly becomes disproportionately white. Given the racial parity in autism in Table 4, the pattern in Table 3 can be attributed to whites’ switching to autism from other categories as they advance through grades. This is consistent with findings on how diagnostic substitution can be used to transfer individuals from nonautism categories (e.g., ID, ED, LD) into autism, given various symptom overlaps (Eyal 2013). This is seen as a central source of the rising prevalence of autism (Coo et al. 2008; Shattuck 2006).
Speech-Language Impairment
Given limited theoretical, historical, or empirical grounds to cast SLI as a high- or a low-status category, we include it in our analysis without a priori assumptions about its relative rank and, relatedly, its racial composition. But we find persistent minority overrepresentation in SLI. Most odds ratios in Tables 3 and 4 are less than 1.0 and strongly significant. Thus, despite mixed findings in past literature on racial patterns in SLI, we observe SLI to be a disproportionately nonwhite category, consistent with Deninger’s (2008) work (see also Skiba et al. 2008). Ultimately, however, our data are limited in determining the role racial bias may play in minority overrepresentation in SLI because, as described earlier, SLI involves problems that are less open to subjective judgement in diagnosis (e.g., stuttering) as well as problems that are more open to it (e.g., subtle difficulties in language use and in meaning-making). Therefore, racial patterns in SLI can be addressed more effectively in future research using data that can help break the category down by specific impairments involved in it. A critical exception to our findings on SLI is racial parity in fifth grade in Table 4 (1.070, p ≤ 0.010), which could be another case of a rise in white representation rather than a decline in nonwhite representation. This may stem from less privileged white parents’ advocacy for SLI to provide their children with support in middle school (Lalvani and Hale 2015; Sauer and Albanesi 2013), an effort such as what we observed for privileged white parents with OHI in fifth grade.
Discussion
Existing research on race and disability tends to view mild disability classification monolithically, paying limited attention to the status hierarchy among the categories involved. Some studies address racial patterns in the special education domain as a whole despite the multicategorical nature of that domain. Others either focus on racial patterns in a specific category—providing insights that may not be generalizable to other categories—or, when they do address multiple categories, they overlook the status order among categories and thus analyze racial patterns for each category separately, as opposed to a comparative approach that estimates racial risks for any given category while adjusting for risks for all other categories. Undertheorization of the hierarchy among different categories is an important weakness in both sides of the debate on racial disproportionality in mild disability classification, a weakness that may not be remedied solely by way of improved methods and data.
We view mild disability classification as status competition and address its history, evolution, and persistent racialization from that perspective. A robust literature on the status hierarchy of categories reveals how marginalized minorities have been overrepresented in low-status categories and whites in high-status ones. This segmentation has endured over time as new categories emerged (ADHD), old ones were revalued (autism), and others were devalued and changed racial affiliation (LD) (see Figure 1). Such dynamics are commonplace in what Bourdieu (1984) referred to as a “classification struggle” in which dominant groups maintain privilege in part by controlling how subordinate groups are categorized and by influencing the operation of and changes in classification systems in ways that perpetuate group disparities. Tilly (1998) made a similar point, noting that group disparities are related to construction of and periodic adjustments to hierarchical “categorization schemes,” which, once installed within bureaucratic structures (e.g., schools, workplaces), take on a life of their own and render inequities durable. We highlight key mechanisms that perpetuate racial segmentation in mild disability classification, including biases in assessments and diagnostic tools (e.g., IQ tests, behavioral rating scales), biases on the part of professionals who carry out the classification work (e.g., teachers, school psychologists, administrators), symptom overlaps among different disability labels, and the blindness of equity regulation (IDEA) to racial differences in parents’ cultural capital, social capital, income, and political efficacy. This whole apparatus of perpetuation typically remains unobserved behind the bureaucratic veil of school structures and formal policy arenas, though its manifestations can be observed in racial segmentation among low- and high-status categories.
Given our literature review and our data, we hypothesize that in the contemporary classification system, whites are overrepresented in the high-status categories of ADHD and autism, and marginalized minorities are overrepresented in the low-status categories of ID, ED, and LD. Our analysis combines PSR with multinomial regression models. The PSR procedure approximates an experimental approach whereby white and nonwhite students are compared for classification net of not just achievement and behavior (the two central criteria in identification and classification) but also social class (which affects conditions of child growth and development, and parental capacities). Our findings support our hypothesis. Black and Hispanic students are overrepresented in ID, ED, and LD across nearly all grades. Whites, on the other hand, are overrepresented in ADHD and autism, but in specific ways across the grade span. They appear to leverage ADHD at key transition points: before elementary school and before middle school, in each case to help with potential issues in later grades. As for autism, whites become overrepresented in it only cumulatively, meaning that autism becomes disproportionately white over time as whites switch from nonautism categories to autism across the grade span, a strategy that reduces stigma and provides new resources and services. Our findings on whitening of autism are consistent with those of Travers et al. (2014) and Travers, Tincani, and Krezmien (2013), who attributed the pattern to changes in diagnostic procedures and standards in the 2000s. But if patterns in autism are affected by changing diagnostic methods in those years, the results likely would have been the same for autism regardless of whether students had other labels prior to autism or not. This is not what we find, however.
Breaking the analysis down by grade level exposes the tactical nature of high-status category hoarding by whites. The benefits of a grade-specific approach to analysis, as well as the benefits of discrete and cumulative estimates of categorization (i.e., with and without constraints on labeling in prior grades), are contingent on the theoretical distinction between high- and low-status categories in the first place. This is because, beyond bringing the status competition perspective to bear on the broad problem of race and disability, the high- versus low-status distinction among different categories also sets the stage for understanding the strategic way in which racial segmentation unfolds.
Limitations and Directions for Future Research
Mild disability categories are open to varying degrees of social valuation. Their internal properties and their group affiliations can be constructed and changed over time to help maintain social hierarchies (Saatcioglu and Skrtic 2019a). Our study focuses on racial hierarchies in which minorities are overrepresented in categories, with greater stigma and limited access to the regular classroom and general curriculum, but status competition over categories may involve other demographic traits as well, such as gender, social class, and immigration status, which are important issues for future research to address. Moreover, the classification process is likely intersectional (Frederick and Shifrer 2019) as it is affected by multiple demographic and other traits that may interact in complex ways. In our analysis, we focus specifically on the role of race and find little evidence that racial effects are moderated by social class. However, future research using stronger data can address such interactions more thoroughly, as the American population becomes increasingly more diverse and minorities are represented to a greater degree in higher income brackets (see Booker 2017; Harvard Opinion Research Program 2021).
In addition, the classification system is organic, and existing categories are altered over time, which may have implications for group disparities. For instance, diagnostic criteria for autism changed in 2013 in ways that may affect the prevalence of autism (see Volkmar and McPartland 2014). This and other such changes affecting existing categories are outside the period our data address. Future studies can examine whether and how these changes affect category rankings and group affiliations. Future research also can address racialized, gendered, or class-related construction of new categories. For instance, media accounts of sensory integration dysfunction, an increasingly popular label used to explain behaviors like compulsive hair pulling, often reference white children, fostering a “white” image for that category (Talpos 2018). Such processes are an important area of inquiry. Finally, we were unable to conduct separate analyses for Blacks and Hispanics given data limitations. Although racially separate analyses may not change the basic takeaways from our study, there may be some important differences by group, as raw disproportionality patterns are not identical for Blacks and Hispanics.
Implications for Policy and Practice
IDEA, the law that regulates classification, brings coherence and a degree of monitoring and accountability to the classification process. 10 But it fails to target factors sustaining racialized patterns. In Senate hearings prior to passage of IDEA’s original legislation, experts recognized that parents may be differentially equipped to exercise legal rights. Kirp, Buss, and Kuriloff (1974) argued for open IEP meetings and due-process hearings with nonprofit advocacy groups involved. These and other scholars also argued that beyond their value in maximizing the potential of individual children, parent participation and due-process rights were essential to realizing reforms for improving practice. They saw the hearings as a means to put pressure on schools to make changes. Toward that end, experts and advocates wanted results of due process cases to become broadly applied precedents. They envisioned an open, collectively advocated, and precedent-based system, leading to continuous improvement nationally through diffusion of common norms. Instead, actual IEP meetings and due-process hearings are private affairs centered on the student’s individualized educational plan (Ong-Dean 2009), subverting reform and reinforcing inequity. Our recommendation is to reappropriate the originally envisioned system as a blueprint to address IDEA’s flaws.
As for practice, although culturally responsive pedagogy and teacher preparation are critical, they are not enough. Equity regulation is more effective when backed by normative forces from broad-based movements. But such forces behind IDEA stalled and began reversing in the 1980s (Patton 1998). Legislation to remedy bias can be more successful when coupled with movements that galvanize pressure on schools. Finally, this study illustrates the need for a type of professionalism that links professional work to the common good. A key problem is that professionals help protect the interests of the privileged rather than commit to the public interest in nondiscrimination. This pattern is more likely when egalitarian interventions construe bias as a technical problem of lack of expertise, thus fostering an “expert professionalism” that rejects responsibility for vital social interests (Brint 1994). A more consequential approach would be to foster the older model of “civic” (Sullivan 2005) professionalism that links professional work to the public interest. This can reorient commitment to fairness and reduce the risk for evasion of egalitarian pressure.
Footnotes
Appendix
PSR-Adjusted Multinomial Estimates of Effects on Categories: Discrete across Grades.

| Kindergarten | First Grade | Third Grade | Fifth Grade | Eighth Grade | |||||||
|---|---|---|---|---|---|---|---|---|---|---|---|
| Coefficient | OR | Coefficient | OR | Coefficient | OR | Coefficient | OR | Coefficient | OR | ||
| White (vs. nonwhite) | LD | –.240*** (.007) | .787 | –.061*** (.005) | .941 | –.299*** (.007) | .742 | –0.450*** (0.003) | 0.638 | –0.292*** (0.005) | 0.747 |
| ED | –.429*** (.009) | .651 | –1.511*** (.024) | .221 | –.435*** (.013) | .647 | –0.136*** (0.009) | 0.873 | 0.117 (0.179) | 1.124 | |
| ID | .002 (.016) | 1.002 | –.085*** (.015) | .919 | –.287*** (.019) | .751 | 0.052 (0.043) | 1.053 | –0.845*** (0.012) | 0.430 | |
| OHI | .266*** (.004) | 1.305 | –.244*** (.005) | .783 | –.415*** (.007) | .660 | 0.484*** (0.006) | 1.623 | –0.338*** (0.005) | 0.713 | |
| AU | –.046*** (.002) | .955 | –.057 (.755) | .945 | .036 (.032) | 1.037 | –0.571 (0.542) | 0.565 | –0.444 (0.830) | 0.641 | |
| SLI | –.355*** (.004) | .701 | –.355*** (.005) | .701 | –.484*** (.005) | .616 | 0.068*** (0.006) | 1.070 | –0.324*** (0.003) | 0.723 | |
| Male (vs. female) | LD | .177*** (.004) | 1.194 | .131*** (.004) | 1.140 | .415*** (.003) | 1.514 | 0.623*** (0.003) | 1.865 | 0.370*** (0.004) | 1.448 |
| ED | .695*** (.011) | 2.004 | .715 (.556) | 2.044 | 1.577*** (.021) | 4.840 | 0.294*** (0.012) | 1.342 | 0.629 (0.733) | 1.876 | |
| ID | .544*** (.012) | 1.723 | –.506*** (.022) | .603 | .550*** (.015) | 1.733 | 0.590 (0.566) | 1.804 | 0.434*** (0.015) | 1.543 | |
| OHI | –.037*** (–.004) | .964 | .035*** (.004) | 1.036 | .039*** (.005) | 1.040 | 0.002 (0.006) | 1.002 | 0.651*** (0.006) | 1.917 | |
| AU | .042** (.017) | 1.043 | .623 (.785) | 1.865 | .739*** (.111) | 2.094 | 0.541*** (0.061) | 1.718 | 0.565 (0.888) | 1.759 | |
| SLI | .509*** (.002) | 1.664 | .455*** (.004) | 1.576 | .503*** (.032) | 1.654 | 0.394*** (0.006) | 1.483 | 0.481*** (0.005) | 1.618 | |
| State FIPS | — | — | — | — | — | — | — | — | — | — | |
| LR | 220,331.5*** | 266,224.3*** | 266,995.4*** | 349,911.5*** | 182,763.8*** | ||||||
| n | 16,201 | 13,094 | 10,977 | 8,174 | 6,356 | ||||||
Note: Children classified for a disability in prior data waves are not included in grade-specific estimations. Values in parentheses are standard errors. Estimates of state fixed effects are not shown. All estimates are adjusted for achievement, behavior, and social class (see the section “Analytical Approach”). AU = autism; ED = emotional disturbance; ID = intellectual disability; LD = learning disability; FIPS = Federal Information Processing Standard; LR = likelihood ratio; OHI = other health impaired; OR = odds ratio; PSR = propensity score reweighting; SLI = speech-language impairment.
p ≤ .001.