
Abstract
Population-health research has neglected differentiation within postsecondary educational attainments. This gap is critical to understanding health inequality because college experience with no degree, vocational/technical certificates, and associate degrees may affect health differently. We examine health across detailed postsecondary attainment levels. We analyze data on 14,750 respondents in Waves I and IV of the nationally representative Add Health panel spanning adolescence to ages 26 to 34. Multivariate regression and counterfactual approaches to minimize the impact of confounders estimate multiple health outcomes across postsecondary attainment levels. Compared to high school diplomas, we find significant returns to bachelor’s degrees for most health outcomes and smaller but largely significant returns to associate degrees. In contrast, adults with some college but no degree or with vocational/technical certificates do not have better physical health than high school graduates. Our findings highlight the stark differentiation within higher education as reflected by the disparate health outcomes in early adulthood.
A college education has been an integral part of the American dream since the 1944 introduction of the GI Bill (Barrow, Brock, and Rouse 2013), which provided U.S. veterans with stipends that could be used to cover tuition and expenses for higher education programs. The program jump-started an 80-year growth in higher educational attainment: Whereas fewer than 5 percent of American adults had a college diploma in 1940, more than 35 percent did in 2019 (National Center for Education Statistics 2019:Table 104.10). This mass expansion of higher education (Altbach et al. 2017), buttressed by emphatic “college-for-all” policies in recent decades (Rosenbaum et al. 2015), created the widely shared expectation that every young adult should obtain higher education. This expectation, moreover, has become pervasive at the very time when a college degree became necessary for achieving a middle-class lifestyle (Autor 2014). It is not surprising, then, that most young adults conform to the pervasive college-for-all ethos and enroll in postsecondary education. Nearly 70 percent enroll immediately after completing high school, and more join them after taking some time off (National Center for Education Statistics 2019:Table 302.10).
When considering higher education and its effects on important life outcomes, however, researchers, policymakers, and even the public often wear “BA blinders” (Rosenbaum, Ahearn, and Rosenbaum 2017:10) and equate higher education with four-year colleges and college degrees with bachelor’s degrees. In reality, adults with higher education experience differ widely in their postsecondary pathways and correspondingly in their resulting attainment levels. Below the vaunted bachelor’s degree, there is a vertically differentiated range of attainment levels from some college but no degree (SC), to vocational/technical certificates and diplomas (VTCs), to two-year associate degrees (AAs) at the top of the subbaccalaureate hierarchy. Today, these subbaccalaureate attainment levels predominate in the population because nearly half of adults who enroll in postsecondary schooling never earn a four-year degree (National Center for Education Statistics 2019)—despite the fact that almost all aspire to this credential (Posselt and Grodsky 2017). The subbaccalaureate group is thus large, comprising almost 58 million adults age 25 and older (U.S. Census Bureau 2017). From another perspective, the proportion of adults ages 25 to 34 with a subbaccalaureate attainment thus now exceeds 27 percent, compared to 23 percent with high school diploma only or about 10 percent with less than a high school diploma (U.S. Census Bureau 2017, 2020).
Yet, perhaps partly due to the BA blinders, social science scholarship has often paid little attention to the outcomes for adults across the differentiated higher education attainment levels. Population health research in particular has neglected the varied subbaccalaureate attainment levels and, more broadly, the differentiation and inequalities within higher education. This is an important issue because such research could shed light on the stratification and inequalities within higher education as reflected in one of life’s most valuable domains—health—and to do so during a time when educational disparities in health and mortality are widening (Montez et al. 2019; Zajacova and Lawrence 2018). To address this gap in the literature, the current study examines health for young adults by education, focusing on detailed subbaccalaureate attainment levels.
Differentiated Higher Education Landscape
Population-health scholars have long conceptualized higher education institutions as meritocratic. In this dominant paradigm, higher education endows capable individuals with increased human capital and advanced credentials that, in turn, lead to stable employment, cognitive gains, and advantaged life trajectories overall (Brown 2016; Mirowsky and Ross 2003). This perspective is evident, for instance, when we frame the better health and lower mortality of the more educated in terms of “returns to” schooling or degrees rather than in terms of health and mortality “disparities,” a framing typical with other dimensions of social stratification or when focusing on the poor health of the low educated. This dominant meritocratic framing may have, however, impeded a more critical examination of the differentiated higher education landscape and its potentially varied effects on health.
Young adults who enroll in postsecondary education encounter a highly complex landscape that includes steeply stratified institutions, pathways, experiences, and corresponding credentials (Grodsky and Jackson 2009). In fact, higher education scholars continue to engage in heated debates about whether subbaccalaureate educational pathways and credentials serve as a stepping-stone to higher attainment (Rosenbaum et al. 2017), a sieve to eliminate marginal and poor students (Ballantine and Hammack 2012), a way to increase skills and human capital for U.S. workers (Stevens, Kurlaender, and Grosz 2015), or a beneficial safety net for disadvantaged students (Kalogrides and Grodsky 2011). Regardless, the conflation of higher education experiences, from subbaccalaureate credentials to the vaunted bachelor’s degree, obscures potentially important disparities in life chances.
Postsecondary Education and Health Outcomes
The literature on the links between education overall and health is vast. Nearly uniformly, more schooling is found to equal better health (Cutler and Lleras-Muney 2008; Zajacova and Lawrence 2018). At least some of education’s effects on health are causal (Eide and Showalter 2011; Fletcher 2015; Halpern-Manners et al. 2020; Lleras Muney 2005). The mechanisms through which education impacts health are so numerous that education has been conceptualized as a fundamental cause (Link and Phelan 1995) or a metamechanism (Freese and Lutfey 2011) influencing health. The specific mechanisms may differ across contexts but now include better, stable jobs with higher incomes and a corollary range of advantages from safer neighborhoods to less stress, to beneficial social ties, to better health behaviors, to easier access to health care (Cutler and Lleras-Muney 2008; Zajacova and Lawrence 2018).
A sizable body of research has focused on the impact of earning a four-year college degree, or BA. This scholarship has shown that relative to not having this credential, a BA is associated with much better economic and social outcomes (Hout 2012) as well as adult health behaviors, health, and longevity (Bauldry 2014; Lawrence 2017; McFarland and Wagner 2015; Montez et al. 2018; Walsemann, Hummer, and Hayward 2018; Zheng 2017).
In contrast, surprisingly few studies focused on examining health across levels of higher education, especially subbaccalaureate levels. This modest body of evidence suggests little or no positive health returns to the lower subbaccalaureate attainment levels but significant returns to associate degrees (Rosenbaum 2012; Zajacova and Johnson-Lawrence 2016; Zajacova, Rogers, and Johnson-Lawrence 2012). A study using National Health Interview Survey data on U.S. adults ages 30 to 64 found that compared to high school graduates with no higher education experience (HS), adults with SC reported significantly more, not fewer, cardiovascular, respiratory, vision, acute, “other” conditions and functional limitations, and a comparable prevalence of diabetes and hypertension. The VTC was also not associated with positive returns with respect to most health outcomes; only adults with the highest subbaccalaureate level—AA—had significantly better health for about half of the studied health outcomes (Zajacova et al. 2012). In fact, self-rated health was the only measure with the expected significant gradient such that adults with any subbaccalaureate attainment reported better health than their peers with only a high school diploma. A recent study of chronic pain among adults 30 to 49 also found significantly higher pain among adults with some college compared to high school graduates, no difference among those with a VTC, but the expected positive significant return in lower pain for those with an academic AA (Zajacova et al. 2020), a pattern similar to a prior pain study of a large online sample of U.S. adults (Johannes et al. 2010). Regarding objectively measured biological risk indices examined in the National Health and Nutrition Examination Survey data set, adults with some college and those with a VTC experienced no systematic positive returns to their higher education attainment, whereas adults with an academic AA had systematically better biomarker risk profiles than high school graduates (Zajacova and Johnson-Lawrence 2016).
These findings generally echo the larger econometric literature that has focused on wage returns to subbaccalaureate attainment levels. This literature is relevant because employment and income are assumed to be key mechanisms through which education impacts health. The econometric research has described clear positive returns to AAs, more mixed evidence on returns to VTCs, and found no or limited support for earnings returns to SC. This is the case in data from the late twentieth century (e.g., Grubb 1997, 2002; T. J. Kane and Rouse 1995) as well as recent data (Bahr 2019; Belfield and Bailey 2017; Giani, Attewell, and Walling 2020; Kim and Tamborini 2019; Scheld 2019). Thus, differential employment and income across subbaccalaureate attainment provide additional indirect evidence to support the expectation of differentiated health consequences.
Gaps in the Literature
The studies cited in the prior sections included adults across life stages and from multiple birth cohorts. Health disparities vary systematically across the life course, however, and the higher education landscape and the returns to education differ for today’s cohorts compared with their older counterparts (Andersson 2016; Kirkpatrick Johnson et al. 2016). Therefore, focus on younger adults from more recent cohorts is necessary to understand the health effects of contemporary higher education. The best dataset for this examination is the Add Health panel of cohorts born in the late 1970s, and numerous prior studies have examined the health of its respondents. However, many simply focused on the dichotomy between having a BA versus not having a BA (e.g., Bauldry 2014; Lawrence 2017). Alternatively, they only examined a single subbaccalaureate group, variously conceptualized as any postsecondary education (Bauldry 2015; McFarland and Wagner 2015) or subbaccalaureate credentials, commingling the large group of SC adults and those with only HS and no postsecondary schooling (Rosenbaum 2012). The unique study that took advantage of the detailed postsecondary attainment levels in Add Health only examined one health outcome—cardiovascular health (Lawrence et al. 2018).
Across these studies, the relationships between subbaccalaureate attainment and health varied, which may be unsurprising given the different health outcomes and the different operationalizations of postsecondary attainment. The studies do suggest that SC and VTC display little to no health improvement compared to high school graduates, whereas AA degree holders fare a little better. The returns to the lower subbaccalaureate levels, whether SC or VTC, were often not significant, such as for biomarkers like hypertension or hypercholesterolemia (Rosenbaum 2012), depressive symptoms (McFarland and Wagner 2015), or most health behaviors (Rosenbaum 2012). At the AA level, health outcomes were significantly better compared to HS only, such as for cardiovascular health (Lawrence et al. 2018) or sexually transmitted infections (Rosenbaum 2018). Thus, the limited evidence for such an important topic compels a systematic analysis of multiple health dimensions across detailed higher education attainment levels in younger adults coming from recent cohorts. Such work is sorely needed to build a solid foundation for further exploration of impacts of the differentiated higher education attainment levels on the health of the U.S. population.
Moreover, with notable exceptions (e.g., Lawrence et al. 2018; Rosenbaum 2012), prior work tended to be fairly descriptive and did not aim to isolate the effect of the various attainment levels from potential confounding by the individuals’ prior academic history, their family-of-origin socioeconomic status, or their prior health. We add a counterfactual analysis that moves the literature toward a better understanding of the subbaccalaureate effects on health. In sum, the lack of research on differences in health returns to postsecondary education is problematic because it leaves open the question of how health is patterned across educational attainment levels for the majority of U.S. adults, especially adults from recent cohorts.
The Aims and Contributions of This Study
The emerging findings we just described clearly point to a differentiated higher education credential landscape with correspondingly varied health consequences. This complexity, combined with the importance of educational attainment to population health and the tens of millions of American adults to whom the issue is relevant, necessitates a systematic analysis with more depth and detail.
Our aims contribute to the literature in four ways. First, we examine the postsecondary attainment levels in more detail than nearly all prior work, estimating the health of adults with SC, VTCs, AAs, and BAs relative to those with only a high school diploma. We assess whether there is evidence of a BA “threshold” in this relatively young group, and we examine health patterns across the distinct subbaccalaureate levels. Second, we analyze data from a cohort of adults in their late 20s or early 30s, when about 90 percent are no longer enrolled in school (National Center for Education Statistics 2019:Table 103.20) but before decades of posteducational influences in their work and social worlds shape their health. This focus allows us to isolate health disparities at the cusp of life after school and capture the emergence of adult health disparities as they unfold over the life course. Importantly, this cohort entered adulthood in the twenty-first century and thus represents the modern educational environment. Third, beyond describing the observed patterns, we apply counterfactual methods to better isolate the effects of attainment from potential confounding by family background, prior achievement and skills, and early health. And fourth, we take a “social consequences” approach (Aneshensel 2005) where we examine multiple health dimensions, not just a single outcome. This approach is optimal if we want to understand the broad and often nonspecific impacts of social structures on health and well-being and allows for interpretation of patterns across the different outcomes. Although doing so introduces complexity over just a single outcome, the findings will collectively reveal a full picture of the health effects across levels of postsecondary education.
Methods
Data
We use data from the National Longitudinal Study of Adolescent to Adult Health panel (Harris 2009), a leading source of information on health among young adults (Harris et al. 2019). The baseline wave, conducted in 1994–1995, interviewed 20,745 adolescents ages 11 to 19. Follow-up waves were conducted in 1996 (Wave II), 2000–2001 (Wave III), 2007–2008 (Wave IV), and 2016–2017 (Wave V). We use information on health outcomes and educational attainment from Wave IV because our substantive focus is health disparities that emerged before the respondents entered their mid-30s (respondents were ages 26–32 at Wave IV), when their health is increasingly influenced by posteducational workplace, family, and other social factors. We draw potential confounding variables from Wave I to represent experiences prior to educational completion, or pretreatment.
The sample includes 14,750 individuals who were included in Wave IV, have a valid sampling weight, and have valid information on Wave IV educational attainment. Models use multiple imputation (described in the “Analytic Approach” section) to address missingness for independent variables. Because we exclude individuals missing data on an outcome variable from any analyses for that outcome, sample sizes range from 11,714 to 14,750.
Variables
Outcomes include eight measured and self-reported physical, mental, and global health variables, all from Wave IV. The measured outcomes are three biological risk measures: a cardiovascular risk index, C-reactive protein (CRP), and body mass index (BMI). The cardiovascular risk measure is a continuous variable, standardized so that one unit is equivalent to one standard deviation. This measure combines standardized indicators of systolic blood pressure, diastolic blood pressure, pulse rate, A1C, triglycerides, high-density lipoprotein cholesterol, low-density lipoprotein cholesterol, and BMI. CRP is a logged continuous measure; levels of this protein produced by the liver reflect inflammation in the body (values >10 are omitted to avoid capturing acute illnesses). A continuous measure of BMI is calculated from height and weight as measured by field staff.
Two outcomes capturing highly prevalent and consequential chronic conditions—diabetes and hypertension—combine self-reports and measured biomarkers. Individuals were categorized as having diabetes if their glucose or A1C rate was at or higher than the threshold, if they reported having been diagnosed with diabetes, or if their medication inventory included the use of an antidiabetes medication in the previous four weeks. Similarly, individuals were categorized as having hypertension if their blood pressure (systolic or diastolic) exceeded thresholds, if they reported a diagnosis of hypertension, or if they had used antihypertensive medication in the previous four weeks. Physical activity limitation is a dichotomous variable, with individuals self-reporting being limited “a little” or “a lot” in activities such as moving a table, pushing a vacuum cleaner, bowling, or playing golf.
Mental health is captured with depressive symptoms, assessed via the Center for Epidemiological Studies Depression Scale (CES-D). Responses to the 10 CES-D questions were summed, and the sum was standardized. Self-rated health was based on responses to the standard question, “In general, would you say your health is excellent, very good, good, fair, or poor?” We use the full five-point response scale, with higher values indicating better health.
Educational attainment captures the highest level of schooling attained as reported by the respondent in Wave IV. We create a categorical measure with the following categories: (1) high school diploma (HS), the reference category; (2) some college but no degree, diploma, or certificate (SC); (3) certificate from a one- to three-year vocational/technical program after high school not including an associate degree (VTC); (4) associate degree (AA); and (5) bachelor’s degree (BA). Because the focus is on higher education, adults with less than a high school completion are omitted. Respondents with a postbaccalaureate degree are also excluded because adequately controlling for selection into graduate school is beyond the scope of our analysis.
Covariates come from the Wave I interview and high school transcripts. All regression models control for demographic characteristics (age, gender, race/ethnicity). The “fully adjusted” models include a range of measures associated with postsecondary enrollment and completion: background (parental education, income-to-needs ratio during adolescence, two-parent family, and parental financial resources; Haider and McGarry 2018; Pfeffer 2018), achievement/cognitive skills (standardized cognitive skills score from a picture vocabulary test and ninth-grade GPA and ninth-grade level of mathematics from high school transcripts; Choi et al. 2008; Crosnoe, Kendig, and Benner 2017; Crosnoe and Riegle-Crumb 2007), self-reported early health and health behaviors (smoking, BMI, depressive symptoms, and self-rated health), and Big Five personality measures (Young and Beaujean 2011). For propensity score models, we incorporate all covariates from the regression models as well as numerous additional variables, listed in the footnote of Table 3.
Analytic Approach
We estimate the distribution of all health outcomes for the full sample and by educational attainment levels. We then estimate two regression models for each outcome. The first model controls for demographic characteristics; the second model includes the full complement of covariates. All analyses adjust for the complex sampling design of Add Health. All regression models are estimated using multiple imputation to address item missingness for independent variables, retaining cases across all models. In our sample, the average missingness across measures is 6 percent. The two measures from the transcripts (ninth-grade GPA and ninth-grade math class) are missing the greatest proportion at 31 percent. We use a chained equations approach, creating 10 data sets. All independent and dependent variables were used to inform imputation.
We then use a propensity score approach to assess the effect of postsecondary attainment level on health outcomes. This approach applies a counterfactual framework that takes into account the potential selection into different schooling levels as a function of early life characteristics and experiences (Lawrence 2017; Zheng 2017). Essentially, propensity scores identify each individual’s likelihood of attaining a particular educational attainment level by estimating a logistic regression model with the educational degree (compared to high school education) as the dependent variable. Based on these models, we calculate each individual’s predicted probability, or propensity, for a given educational attainment, which can be used in propensity score matching or as inverse probability weights in regression models. Although this approach rests on key assumptions, namely, that all selection is observed and included in the propensity model (P. R. Rosenbaum 2010), the rich data reported in adolescence provides a solid foundation to meet this assumption. An examination of the Wave I covariates used in the propensity model confirmed that matching eliminated nearly all significant observed differences across treatment.
These propensity score models analyze data from the full sample (N = 14,750), and we use mean imputation for item missingness. Because we use only the point estimates of the propensity and not the standard errors from these models, the underestimation of variance due to mean imputation and multicollinearity is immaterial. We conduct five propensity score analyses to check the robustness of the estimates to different model specifications. Three of these approaches match individuals with similar propensity scores: One uses a caliper approach that matches individuals whose propensity scores are within .01, and two use a “nearest neighbors” approach matching individuals without the treatment (in this class, the educational attainment level of interest) to the five respondents with the treatment who have the most similar propensity scores. One nearest neighbor approach uses the command psmatch2 to identify average treatment effects, and the other approach uses teffects, which is similar to psmatch2 but also adjusts standard errors for measurement error in the propensity score. The last two approaches use predicted propensity scores as probability weights in regression models (Austin and Stuart 2015). One uses the propensity scores as calculated, and the other recodes the top 1 percent of weights to the 99th percentile weight.
Results
Table 1 shows the distribution of educational attainment levels and health outcomes in aggregate and for each education level. Those with less than a high school diploma or more than a BA are omitted from the table but contribute to the overall population distributions. The largest educational category is SC, which includes 27 percent of the population cohort born from 1980 to 1984, followed by BA (23 percent). In comparison, high school graduates who never attended college comprise only 15 percent of young adults, and those with AAs and VTCs are each about 8 percent. In general, those with a high school degree have the highest average levels of health problems or risk factors, whereas those with a BA have the lowest levels of health problems or risk factors in our sample.
Weighted Means of Health Measures across Educational Attainment Categories, Wave IV Add Health.

Note: Adjusts for complex sampling design. Ranges for continuous variables given in parentheses; all other variables are dichotomous. HS = high school; SC = some collee, no degree; VTC = vocational/technical certificate; AA = associate degree; BA = bachelor’s degree; BMI = body mass index; CRP = C-reactive protein.
The proportions add up to only 81.1 percent; an additional 12.1 percent of the population did not complete high school, including those who earned a GED, and 6.8 percent have a postbaccalaureate degree.
Table 2 presents the key results of the regression models for each of the health outcomes across the four postsecondary attainment levels vis-à-vis the omitted category (high school diploma). The results in Panel A are from demographics-adjusted models. For physical health and biomarkers, adults with SC and those with a VTC are statistically indistinguishable from their HS counterparts, with two exceptions: Relative to those with only a high school education, those with SC have lower CRP levels, and those with a VTC have lower odds of diabetes. Mental and global health measures—depressive scores and self-rated health (SRH)—are significantly better among the SC and VTC groups than among the HS-only group. At the AA level, three of the six physical health outcomes as well as the mental and global health measures are significantly better for those at AA compared to HS level: Adults with an AA have fewer physical activity limitations and depressive symptoms, lower cardiovascular risk and CRP, and better SRH than those with only HS. Moreover, the coefficients for those with an AA are larger in absolute magnitude than the coefficients for those with a VTC and are roughly half the size of the BA coefficients. Finally, all physical and mental/global health outcomes are significantly better for the BA group than for HS graduates. The coefficients for college completers are substantially larger than those for any of the subbaccalaureate attainment levels—for example, college graduates’ average BMI is 2.5 points lower, net of demographics, than the average BMI of high school graduates.
Regression Coefficients for Each Outcome Relative to HS Degree, Wave 4 Add Health.
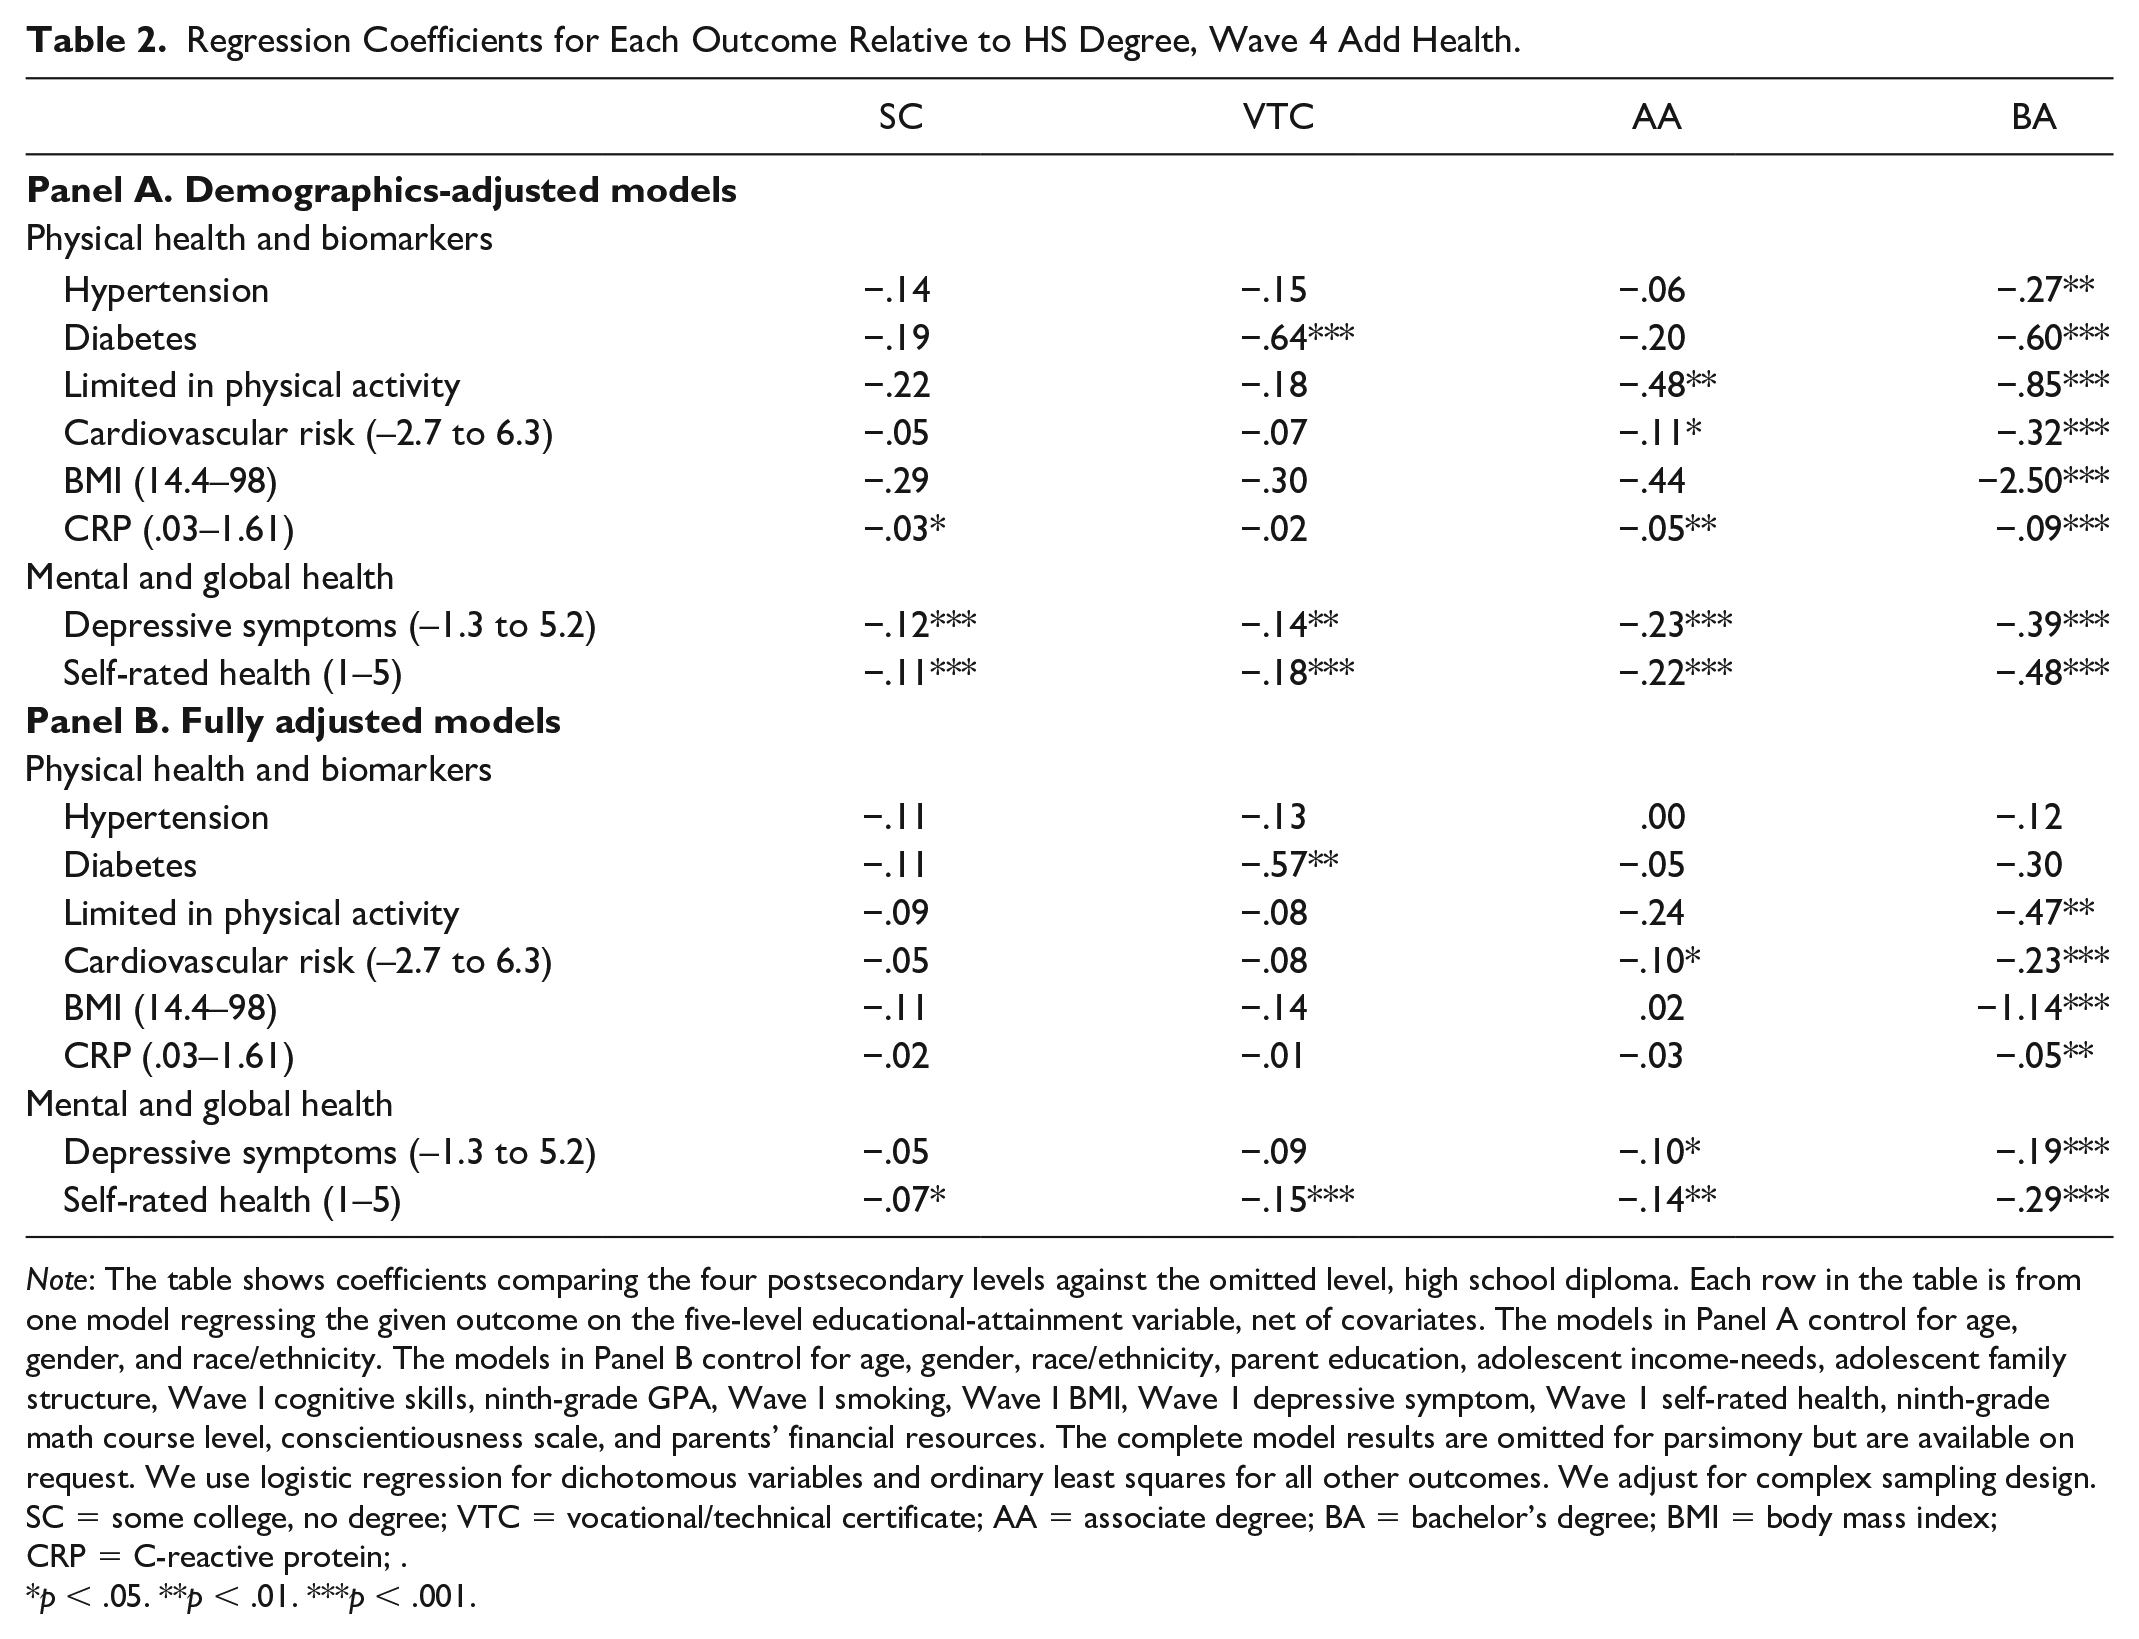
Note: The table shows coefficients comparing the four postsecondary levels against the omitted level, high school diploma. Each row in the table is from one model regressing the given outcome on the five-level educational-attainment variable, net of covariates. The models in Panel A control for age, gender, and race/ethnicity. The models in Panel B control for age, gender, race/ethnicity, parent education, adolescent income-needs, adolescent family structure, Wave I cognitive skills, ninth-grade GPA, Wave I smoking, Wave I BMI, Wave 1 depressive symptom, Wave 1 self-rated health, ninth-grade math course level, conscientiousness scale, and parents’ financial resources. The complete model results are omitted for parsimony but are available on request. We use logistic regression for dichotomous variables and ordinary least squares for all other outcomes. We adjust for complex sampling design.
SC = some college, no degree; VTC = vocational/technical certificate; AA = associate degree; BA = bachelor’s degree; BMI = body mass index; CRP = C-reactive protein; .
p < .05. **p < .01. ***p < .001.
Figure 1 illustrates the average adjusted values and probabilities of the eight health outcomes by education level based on the results of the demographics-adjusted models. Although details vary across health outcomes, there are a few notable patterns. First, global and mental health, but less so physical health, show a “gradient” where higher schooling level is generally associated with better outcomes. Second, for most physical health outcomes, the subbaccalaureate groups are not much better off compared with only a HS diploma: There is a tendency toward better outcomes, but the differences are small, although in most cases, AA is better off than either SC or VTC. Finally, college completion (BA) is consistently associated with better health: College graduates report better health than all other groups, and the difference is particularly pronounced for cardiovascular risk, BMI, SRH, and depressive scores.
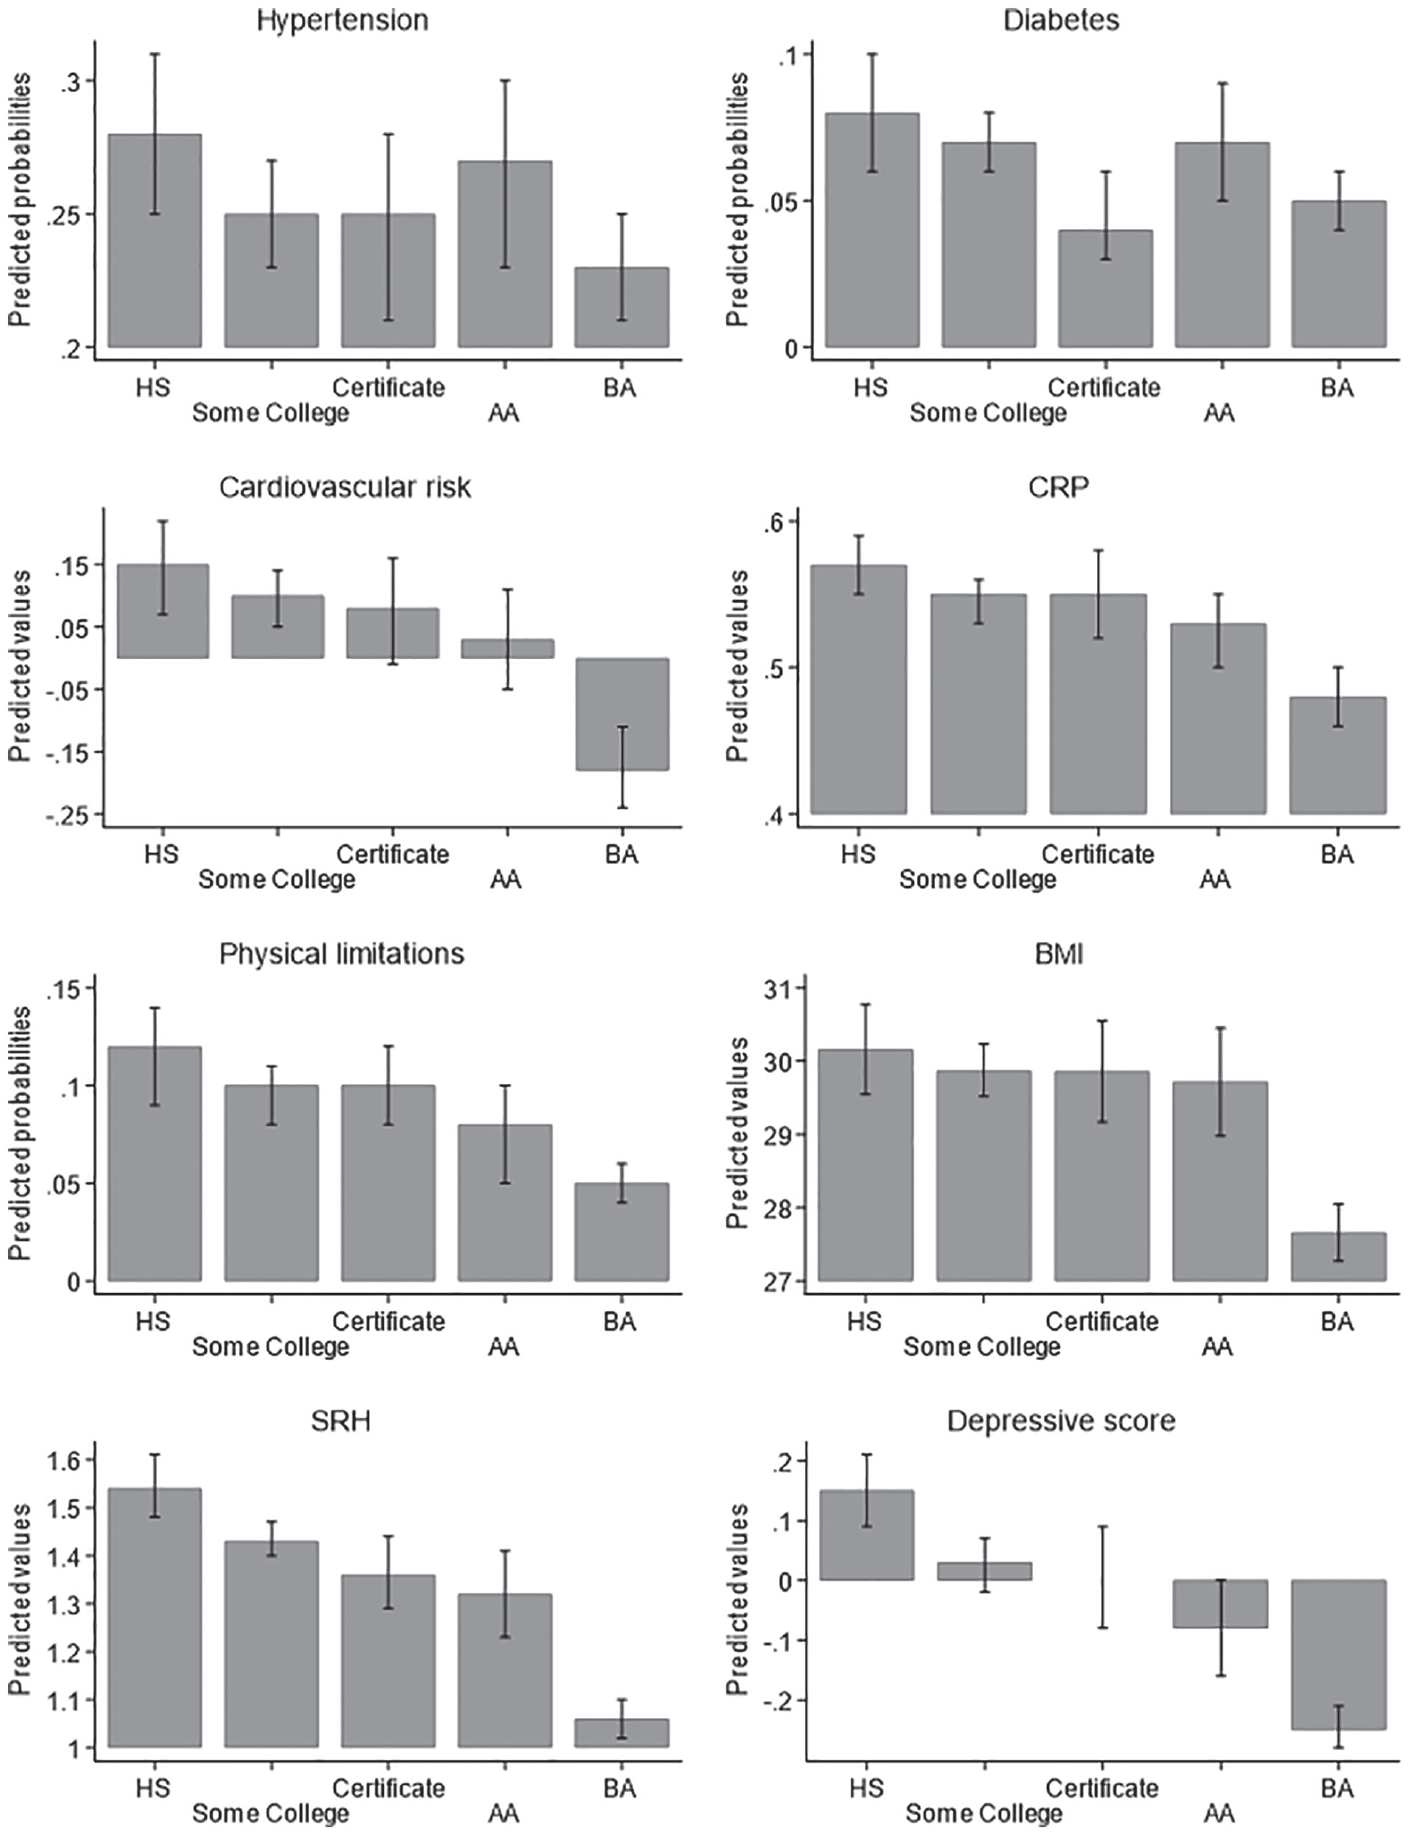
Predicted health probabilities or values across levels of education.
Panel B in Table 2 presents results from regression models adjusted for respondents’ early life experiences, backgrounds, educational achievement, and early health. Across outcomes and educational levels, controlling for these characteristics generally explains some, but not all, of the health disparities across levels of postsecondary schooling. For the sub-BA groups, all coefficients are attenuated when covariates are added such that only SRH is significantly better for those with SC than for HS graduates, only SRH and diabetes are better for those with a VTC than for the reference group, and only SRH, depressive symptoms, and cardiovascular risk are better for those at the AA level than for the reference HS group. The estimates of the BA-HS differences are also attenuated but remain fairly strong in magnitude and are significant for all outcomes except hypertension and diabetes.
Finally, Table 3 shows results of analyses that apply five complementary counterfactual approaches that isolate the differences across the postsecondary attainment levels from potential bias due to confounding factors and selection. Because the methods are meant for pairwise comparisons rather than comparing multiple groups at once, the results present health differences between HS graduates and those with SC, VTC, AA, and BA, respectively. The propensity score approaches in this analytic step thus effectively compare respondents with similar backgrounds, achievements, early health, and a host of other characteristics to isolate the effect of each specific type of postsecondary education versus no postsecondary schooling.
Coefficients from Counterfactual Models for Each Outcome, Wave 4 Add Health.

Note: The table shows coefficients from pairwise comparisons across different education levels. IPW logit models for dichotomous activity limitations yielded findings substantively identical to the IPW or 99 percent IPW models. Variables for matching are all from Wave 1: age, race/ethnicity, gender, English speaker, parent education, adolescent income-needs, adolescent family structure, social control scale, parent closeness scale, ever married, social support scale, neighborhood quality, religious attendance, importance of religion, missed school, ever had sex, frequency drunk/high, physical activity count, cognitive skills, ninth-grade GPA, smoking, BMI, depressive symptom, SRH, dentist visit, doctor checkup, enough sleep, screen time, number of friends drink, number of friends smoke, smoker in the household, parent smoker, parent binge drinker, live to 35 expectations, killed by 21 expectations, delinquency scale, repeated grade, ever suspended, ever expelled, ever truant, reported grades, gets along with teachers scale, problem with attention, problems with homework, gets along with students, integrated in school, expects to go to college, wants to go to college, math level Year 1, attained math end of HS, conscientiousness, neuroticism, extroversion, mom disappointment if no graduate college, parent-reported disappointment for no graduate college, nativity, vegetable consumption, sweet snack consumption, and seatbelt use.
VTC = vocational/technical certificate; AA = associate degree; BA = bachelor’s degree; BMI = body mass index; CRP = C-reactive protein; CVR = cardiovascular risk; SRH=self-rated health.
p < .05. **p < .01. ***p < .001.
The results in Table 3 provide evidence that SC and VTC have similar health to HS degree holders, whereas AA holders have some improved health in this counterfactual framework. Completing only some college or earning a VTC does not predict better health compared with only graduating HS; not only are the differences not statistically significant (with only two exceptions in 80 models for slightly lower depressive symptoms at the certificate level), but the point estimates are clustered around zero. For those with AA degrees, there is a significant benefit for cardiovascular risk, SRH, and depressive symptoms compared to HS for at least some of the approaches.
The BA effect is more pronounced in terms of both significance (although caution is warranted because the BA group is larger than the VTC and AA groups) and the size of the coefficient estimates. The effect of having a BA is not significant for all outcomes across all approaches but is particularly clear for a lower probability of physical limitations, SRH, depression, and perhaps BMI. To compare our results with those of prior studies, we added an additional model comparing BA holders to all groups with lower schooling combined. Consistent with prior studies (Bauldry 2014; Lawrence 2017; Zheng 2017), these models reveal a clear BA threshold effect: BA completion is associated with significantly better physical and mental/global health than not completing a BA for six of the eight outcomes except hypertension and diabetes.
Discussion
The aim of this study was to assess health disparities across higher education attainment levels in early adulthood. Using the nationally representative Add Health data, we compared physical, mental, and global health measures among younger adults with some college but no degree, vocational/technical certificates, associate degrees, and bachelor’s degrees against their counterparts with no postsecondary education. We highlight four important takeaway points from our results.
First, young adults with four-year degrees have better health across the board compared to high school graduates, and at least some of this appears to be causal. For all eight studied health measures, BA was associated with better outcomes: College graduates had lower risk of diabetes and hypertension, physical limitations, cardiovascular risk, high BMI, elevated CRP, and depressive symptoms, and they also had better SRH. This health advantage remained significant for most outcomes net of a range of covariates. When we used counterfactual approaches that compared high school and college graduates who were similar in backgrounds and early life health and skills, the college advantage remained evident for mental and global health, although not for physical domains. This finding corroborates the threshold effect: BA completion was repeatedly found to be associated with better outcomes than sub-BA levels across diverse life domains (Hout 2012; McClendon 2018), including health (J. B. Kane et al. 2018; Lawrence et al. 2018). That this health advantage emerges relatively early during the life course may indicate that those who finished college have already attained a more advantageous position in society vis-à-vis their less educated peers, or perhaps the advantage is a function of different educational experiences and pathways through higher education. Regardless, our findings highlight that the education-related health disparities at the college completion threshold emerge early in the adult life course.
Second, we found better health among adults with an associate degree relative to HS, in line with the gradient expectation (Cutler and Lleras-Muney 2008; Mirowsky and Ross 2003). Although the AA health benefits were smaller than among college completers, AA was associated with better outcomes for some physical-health measures (physical limitations, cardiovascular risk, and CRP) as well as for all mental and general health. Even when we matched AA recipients and their HS-only peers in a host of background characteristics, some significant AA advantage remained, again especially for mental and general health. This pattern corroborates the econometric literature where employment rates and income are systematically found to be higher among AA recipients compared to HS graduates only (Belfield and Bailey 2017; Kim and Tamborini 2019). It also fits the small but important body of research on the value of community college degrees (J. E. Rosenbaum 2018; J. E. Rosenbaum et al. 2017). It thus appears that the receipt of the AA degree offers partial health returns. Whether these returns are due to better economic circumstances the AA degree affords its recipients, the learning that the AA course of study necessitated, the peers in the AA program, or other factors should be examined in further research.
Third, and in contrast to AA health benefits, our data suggest effectively no better physical health among adults who attended postsecondary institutions but earned no degree and those who earned a VTC compared to their peers with no postsecondary experience. This contradicts the expectation that more schooling would always be linked to better health (Mirowsky and Ross 2003). For general health and depressive symptoms, both these postsecondary groups (SC and VTC) reported significantly better outcomes. This mixed pattern echoes results from limited prior research with an older sample of U.S. adults: Those with SC reported better SRH than HS graduates even as they reported comparable or worse levels of physical health (Zajacova et al. 2012) and had comparable levels of biological risk (Zajacova and Johnson-Lawrence 2016). Why the patterns for SRH differ from patterns for physical health is unknown but interesting. Perhaps it is due to reporting differences (Bago d’Uva et al. 2008; Dowd and Zajacova 2010) if respondents with different schooling levels have different expectations about their health or if they incorporate various aspects of health differently into their assessments (Jylhä 2009).
Fourth, the apparent advantage in mental and general health for adults with SC and AA was attributable to their slightly more advantaged backgrounds and experiences compared with the HS. Once we matched respondents on those characteristics in the counterfactual models, these subbaccalaureate groups held no health advantage over HS. Thus, overall, we found little evidence of a systematic positive impact of postsecondary schooling on physical health in early adulthood unless a person earned at least an AA. It is possible that the health benefits of subbaccalaureate education, although modest or nonexistent in this young group of respondents, would emerge as they age into mid-adulthood. Wave V of Add Health, as well as future waves of data collection, will be helpful in testing this important question because the cohort is now about 10 years older than in the Wave IV analyzed here. It is also possible, however, that health patterns may become even less advantageous for those with the least postsecondary schooling, such as SC or VTC.
Despite the strengths of the representative Add Health panel and the counterfactual approaches to our analysis, there are limitations. We were unable to assess important aspects of postsecondary schooling experiences and pathways of the respondents, such as the type of certificate they earned, their field of study, the type of institution they attended, their grades, or their reasons for not completing their desired schooling level among those whose attainment fell short of their aspirations. Although some of these variables are available in the data set, sample sizes would become untenably small. Indeed, one reason that studying the postsecondary landscape has been so challenging in general is that there is a tremendous variability in postsecondary experiences, and thus even samples as large as the original group of 20,000 Add Health respondents may not suffice to tap into the heterogeneous experiences. Given the fast-paced changes in the educational landscape, it is also a disadvantage that the data are about a decade old. However, our focus on the background characteristics, rather than postattainment mechanisms that would “explain” health differences, dictated our choice to use the older Wave IV data. An additional important limitation is that systematic head-to-head comparisons are not possible because of differences across surveys in how educational attainment information is collected. For instance, the set of postsecondary attainment categories available to Add Health respondents differs from the set presented to respondents in other large surveys, such as the National Health Interview Survey or the National Health and Nutrition Examination Survey, which ask about two distinct types of associate degrees (vocational and academic) but not certificates. It is unclear, therefore, how to compare the results for vocational/technical associate degree in the National Health Interview Survey with the VTC in Add Health. The unsystematic data collection, we believe, reflects the lack of attention paid to the subbaccalaureate group; we hope that future surveys recognize the importance of better capturing the complexity of postsecondary degrees by offering respondents an expanded and more detailed set of educational attainment categories.
Conclusion
Our findings expand the emerging literature on the consequences of social stratification in higher education through examining arguably one of the most important life domains—health. Compared to high school graduates, college completion (BA) was associated with better health, even in this relatively young cohort, but health was no better for those who attended postsecondary institutions but did not earn at least an AA. This pattern is worrisome given the large numbers of Americans who attend college and do not earn a degree or who gain a VTC (35 percent of the young cohort in our sample). Overall, these findings reveal a heavily stratified postsecondary system that best serves the select few that complete a four-year degree: Only this group appears to systematically benefit in both physical and mental health.
As the number of adults with postsecondary education has risen steadily over decades, differentiation within higher education has increased in tandem (Berggren 2016). Yet population health research has lagged behind in considering the consequences of this differentiation. As Warren and colleagues (2020) recently noted, this research will benefit from a closer engagement with sociology of education scholarship, which has developed a rich conceptual and empirical body of understanding the complexities of postsecondary education as an institution and as individual experience. Furthermore, population health research should continue efforts to update and refine measures of educational attainment and quality to capture important changes in education, including the rise of predatory for-profit institutions, online educational programs, and other dimensions of postsecondary institutions (Cottom 2017). Scholars should also delve into the experiences during and after college that may help explain why some college or certificates appear to yield no health returns and stratification at the K–12 levels, which necessarily impacts all postsecondary pathways, experiences, and outcomes. Given the central role of higher education in shaping the life trajectories of future generations, our findings have important implications for health research and policy as well as our understanding of stratification within higher education and corollary inequalities in the health of the U.S. population.
Footnotes
Funding
Research reported in this study was supported by the National Institute on Aging of the National Institutes of Health under Award No. R03AG050130. The content is solely the responsibility of the authors and does not necessarily represent the official views of the National Institutes of Health.