
Abstract
U.S. state spending on higher education represents a sizable, but highly variable, portion of budget expenditures. Preliminary research supports a positive relationship between the percentage of state legislators who hold public degrees and state funding for higher education. In this study, the authors test whether this finding is consistent over time by using panel modeling to analyze the educational compositions of state legislatures in 2005 and 2014. Generalized least squares regression models with robust standard errors clustered by state- and year-specific intercepts indicate a significantly positive relationship between the proportion of publicly educated state legislators and state spending on higher education. This relationship is consistent across models with numerous robustness checks and political, economic, and structural controls. Given the smaller number of publicly educated legislators in 2014, the findings suggest that spending on higher education would have increased to a larger extent had the educational composition of the legislatures remained constant.
Keywords
U.S. states commit a sizable portion of their budgets to funding public higher education. In fiscal year 2017–2018, state governments spent a combined total of more than $88 billion on higher education (Grapevine 2019). Although state funding for higher education in the United States is significant, it is also habitually under threat (Altbach, Gumport, and Johnstone 2001; Bastedo, Altbach, and Gumport 2016). Instability of government support and rising demands for college degrees have made the battle over tuition and state budgets highly contentious (Ehrenberg 2006; Hossler et al. 1997; McLendon, Mokher, and Doyle 2009; Mitchell, Leachman, and Masterson 2017; SHEEOA 2017, 2019). Despite strong evidence that public investments in higher education have numerous benefits (Hout 2012), many public state schools are scrambling to develop new models of funding given concerns over decreases in state funding (Ehrenberg 2006; Mitchell et al. 2017; SHEEOA 2017, 2019).
Public universities have responded to funding uncertainties with independent fund-raising, endowments, entrepreneurial models, performance-driven funding models, staff cuts, and program elimination to sustain their mission and grow (Dillon 2005; Hillman, Tandberg, and Sponsler 2015; Mitchell et al. 2017; SHEEOA 2017). It is unclear whether these strategies can make up for weakened state support. State budgets must consider changing demand and a number of economic and demographic forces when allocating funds (Ehrenberg 2006; Hossler et al. 1997). Although structural, economic, and demographic factors clearly matter, state funding for public higher education is ultimately a political decision (McLendon, Tandberg, and Hillman 2014). Thus, in understanding why and how states fund public higher education it is crucial to look at political influences.
In particular, a growing body of evidence suggests the importance of descriptive representation for substantive outcomes (e.g., Bolzendahl and Brooks 2007; Juenke and Preuhs 2012; Lloren 2015; Tate 2003). In other words, who holds political power matters a great deal for what policies are enacted. Legislators’ identities matter because voters and legislators can use descriptive affinities as sources of electoral support and policy-making influence, and substantively, representatives can call upon their own experiences and interests to guide their priorities (Phillips 2012; Schwindt-Bayer and Mishler 2005). Although much of the work in this area focuses on gender or racial identity, the theoretical underpinnings suggest that the mechanisms extend beyond those factors. Specifically, given the importance of educational background in determining a variety of social attitudes and life outcomes (Jacobs 1996; Reyes 2015, 2018; Stubager 2008), we ask, can the educational background of legislators also be an influential factor in understanding policy outcomes?
To explore this question, we examine the link between legislators’ postsecondary degrees and spending on higher education across state legislatures. We use a unique data set of the educational composition of state legislatures across all 50 states in 2005 and 2014. First, we assess the data descriptively. We find that, on average, state spending on higher education, in total and relative to budget size, was significantly higher in 2014, while the proportion of states’ legislators with postsecondary degrees from public institutions was significantly lower. Next, we test relationships using generalized least squares panel regression models with robust standard errors clustered by state- and year-specific intercepts and find a significantly positive relationship between the proportion of publicly educated state legislators and state spending on higher education. States that are represented by a higher proportion of legislators with public degrees are significantly more likely to allocate more funds to higher education. This relationship is consistent across models with controls for political, economic, and structural factors and numerous robustness checks. We attribute the countervailing findings between summary statistics and multivariate regression analyses to substantial increases in inequalities among states. We estimate that state spending on higher education would have increased to a larger extent had the educational composition of state legislatures remained constant.
Educational Politics: Representation and Policy Feedback
State legislators have the primary control over policymaking and the budget in their states. Their decisions are influential and shaped by a wide variety of factors (Dar and Lee 2014; Dye and MacManus 2003; McLendon, Mokher, and Doyle 2009; McLendon et al. 2014). Theories of representation suggest, in particular, that legislators’ own characteristics can influence outcomes in substantively meaningful ways (Pitkin 1967; Urbinati and Warren 2008). For example, female legislators are more likely to support bills deemed particularly relevant to women’s interests, such as childcare and reproductive rights (Bratton 2005; Celis 2006; Schwindt-Bayer and Mishler 2005; Wängnerud 2009), and Black legislators are considerably unified in their more liberal policy priorities (Barrett 1995; Bratton 2002; Broockman 2013; Juenke and Preuhs 2012; Tate 2003).
There are at least two mechanisms through which legislators may be encouraged to engage in a personalized politics. Voter preferences may elect representatives with particular profiles to legislatures, and/or representatives may rely on their own characteristics to shape their preferences in ways that influence their voting decisions (Campbell and Heath 2017; Chattopadhyay and Duflo 2004; Huddy and Carey 2009). In the former case, voters use descriptive cues as a means of organizing their political support and pressuring legislators for policy actions. Descriptive characteristics lead to substantive representation, by which legislators come to represent the interests of key groups in the population (Gay 2002; see also Barrett 1995; Rosenthal 1995; Tate 2003). Thus, voters may strongly influence the characteristics of those elected as well as the policy priorities these legislators pursue in office (e.g., Hansen and Treul 2015; Ansolabehere and Snyder 2006). A legislator’s educational background may serve as a cue for constituents to lobby the legislator for spending that benefits higher education.
Turning to the latter mechanism, legislators’ biases and interests may influence their policy priorities and decisions directly and indirectly. Life experiences produce feelings of in-group belonging and responsibility to that group association, as is seen in studies of women’s representation (Chattopadhyay and Duflo 2004; Reingold 1992) and parental status as a policy influence (Washington 2008). Education, in terms of both levels achieved and place attained, has consistently been shown as linked to a variety of socioeconomic, cultural, and ideological cleavages (Binder and Wood 2013; Reyes 2018; Wilkinson 1989). The distinctions between public and private institutions of higher education and their influences on political identity are well documented (Reyes 2015; Slaughter and Rhoades 2004).
Given the importance of education as a background identity characteristic, it is possible that similar mechanisms are at play, producing a positive relationship between publicly educated state legislators and investments in public higher education. Indeed, there is initial support for this application of theories of representation to legislators’ educational backgrounds and their support for public higher education. Thiele, Shorette, and Bolzendahl (2012) found that legislatures with higher proportions of representatives with public degrees, especially those awarded in the states they represent, tend to allocate more funds to their college and university systems.
Competing Political, Economic, and Structural Factors
A number of political factors are likely to influence legislative behavior and spending outcomes. Studies show that greater incumbency fosters organizational stability, resources, and legitimacy (Dye and MacManus 2003). And, legislatures that are more professional—as indicated by rates of incumbency, average pay, average days spent in session, and the ratio of staff members to legislators—spend more per person on education than less professional legislatures (McLendon, Hearn et al. 2009; Moncrief, Thompson, and Cassie 1996).
Partisanship may also matter, as Democratic majorities are largely viewed as favorable for state spending on higher education (Koshal and Koshal 2000; McLendon, Mokher et al. 2009). However, the relationship between political partisanship and spending on higher education is a complex process that is dependent on contextual factors such as economic conditions, the political parties of state governors (McLendon et al. 2014), and the political polarization of individual state legislatures (Dar and Lee 2014). 1 Although important, these explanations do not address the intersection of state-specific educational and political environments or theories of representation and individual agency among legislators.
Alternatively, resource-based theoretical explanations focus on the importance of economic and demographic pressures (Myles and Quadagno 2002). Regardless of how wealth is measured, states with more financial assets spend more (Hicks and Misra 1993; McLendon, Hearn et al. 2009; Zeigler and Johnson 1972). The expansion of spending also corresponds to the rising level of demand within a population (Amenta, Bonastia, and Caren 2001; Hicks and Misra 1993; Myles and Quadagno 2002). For example, state spending on higher education trends with how many residents are in the age groups likely to be considering a higher education degree (St. John 1991; Toutkoushian and Hollis 1998). State budgets generally increase over time, as do other relevant socioeconomic characteristics, such as student enrollments (Leslie and Ramey 1986; NCES 2018; Toutkoushian and Hollis 1998). The above factors help explain general patterns in spending over time but are less helpful with regard to variation among states over time (Amenta et al. 2001).
Finally, spending on higher education is tied to other aspects of educational climates across states (McLendon, Mokher et al. 2009; Squire and Hamm 2005). Although the presence of a large private education sector has been shown to benefit primary and secondary public schools (Arum 1996), it is not clear whether that finding would extend to public higher education. Alternatively, a large private education sector may undercut tuition and enrollment from elite state residents. However, findings are mixed (Hines, Hickrod, and Pruyne 1989; McLendon, Mokher et al. 2009; Peterson 1976). Similarly, funding streams within state higher education compete with one another, for example, for need-based and merit-based financial aid programs (McLendon et al. 2014). Public higher education also competes with elementary and secondary public education; if a state is heavily invested in elementary and secondary public education, spending on higher education may suffer (Hossler et al. 1997).
Panel Data and Analyses
We investigate the relationship between the educational composition of state legislatures and state spending on higher education using a unique panel data set that includes all 50 states at two time points. To do so, we extend Thiele et al.’s (2012) original cross-sectional data set of legislators’ postsecondary degrees in 2005 to include observations in 2014. The use of panel data enables us to more critically assess theories of representation as they may apply to educational backgrounds across state legislatures (Frees 2004; Wooldridge 2002). Our balanced panel data set includes observations of legislature composition in a total of 100 cases. We report descriptive statistics and bivariate correlations for all variables included in our analyses in the Appendix.
Higher Education Spending
We analyze two measures of state spending on higher education. First, because of variability in states’ wealth, we standardize spending on higher education by total spending. The percentage of states’ total spending that is allocated to higher education represents the extent to which states prioritize higher education over other budget items. 2 Second, we analyze state spending on higher education in thousands of dollars as a direct measure of the amount of resources states allocate to their college and university systems. Informed by postestimation diagnostics, we use the natural log transformation of total higher education spending to reduce skew. Data are from National Association of State Budget Officers state expenditure reports (NASBO 2007, 2015).
Postsecondary Degrees in State Legislatures
We highlight two measures of legislatures’ educational compositions. For each state, we indicate the proportion of legislators’ postsecondary degrees from (1) public institutions and from (2) public institutions specific to the states they represent. To calculate these measures, we compile a list of every state legislator. For each legislator, we record any and all postsecondary degrees they hold along with the institutions from which the degrees were granted. These include 2-, 4-, and ≥4-year degrees awarded from public and private colleges and universities. For each degree, we specify whether it was awarded from a public or private institution and whether the institution is located in the state the legislator represents.
From these data, we calculate our two indicators of legislators’ educational background. First, we tally the number of each state’s legislators who have at least one degree from a public institution and divide that by the number of legislators who hold any type of postsecondary degree. This is the proportion of legislators with public postsecondary degrees. We repeat this calculation with the added criterion that a legislator’s public degree be awarded from an institution in the state he or she represents. This is the proportion of legislators with in-state public postsecondary degrees.
It is important to note that these educational background categories are not mutually exclusive. Legislators with in-state and out-of-state public postsecondary degrees are included in the denominators of both calculations. However, only those with public degrees are included in either numerator. Likewise, legislators with in-state public postsecondary degrees are included in the numerator of the public postsecondary degree calculation. In many cases, legislators hold multiple postsecondary degrees, which can come from a combination of private, public out-of-state, and public in-state institutions. Each legislator is coded for inclusion in each relevant degree category. For example, a legislator with one degree from a private institution and another from an out-of-state public institution is coded as holding any postsecondary degree and a public postsecondary degree from any state, but not an in-state public postsecondary degree.
We use data compiled by Thiele et al. (2012) for 2005 and compile analogous measures for 2014. Ideally, we would collect and analyze data annually. However, as each year requires compiling information on thousands of individual legislators, the data collection is onerous, and our resources permitted the addition of one year only. We chose to add data in 2014 to allow changes in state representation as well as to avoid short-term anomalies resulting from the Great Recession of 2008. Data for both time points are compiled from the Project Vote Smart organization. Supplemental resources were unnecessary in gathering data on legislators’ educational backgrounds in 2014. Data are available in a supplementary file.
Control Variables
We include theoretically relevant controls in all multivariate analyses. First, we account for the possibility that legislatures composed of more highly educated representatives, regardless of the type of degree-awarding institution, explains variation in support for state college and university systems. We use our data set of legislators’ educational backgrounds to calculate, for each state legislature, the percentage of legislators who have at least one degree from any postsecondary degree-granting institution, whether public or private. We include this measure in all analyses.
Additionally, we control for the gender composition of legislatures measured as the percentage of legislative seats occupied by women. Data are from the Center for American Women and Politics report on women in state legislatures over time. We also include a time-invariant dummy variable for the presence of term limits. 3 We control for partisanship, measured as the percentage of legislators affiliated with the Democratic Party. Data are from Ballotpedia. In all models, we control for total state spending and population size. Both measures are natural log transformed to reduce skew. We account for a population’s demand for higher education with the percentage of the adult population that is unemployed. Population data are from the Census Bureau.
As indicators of states’ educational climates, we include measures of public funding for primary and secondary education as a percentage of total state spending as well as private school density. Private school density is measured as the number of private postsecondary institutions, including 2- and 4-year degree-granting institutions, in each state as a percentage of all postsecondary institutions. Data for primary and secondary education spending are from the National Association of State Budget Officers state expenditure reports. Private school data for 2005 are from the National Center for Public Policy and Higher Education’s (2005) report “Measuring Up.” Data for 2014 are from U.S. News & World Report’s “Best Colleges” rankings (2016).
Analytic Approach
We examine patterns in state allocation of funds to higher education with a focus on the educational composition of legislatures. We begin with descriptive analyses of legislators’ educational backgrounds and state spending on higher education over two time points. For each indicator of higher education spending and educational compositions of legislatures, we calculate summary statistics disaggregated by time point. As an initial indicator of the relationship between political representation and support for higher education, we perform one-tailed t tests for the difference between means on the basis of the observed direction of change between 2005 and 2014.
We then conduct multivariate panel regression analyses of state spending on higher education. We use generalized least squares random-effects models with year-specific intercepts and robust standard errors clustered by state. This analytical technique is used to model cross-sectional data over time, as it accounts for the tendency to correlate highly with observations at previous points in time (Halaby 2004). Robust standard errors address the tendency of observations to cluster by case. In all models, we specify 2014 as a year-specific intercept to account for unmeasured forces that all states are subject to at a given point in time. Compared with a fixed-effect model, our analytic approach allows us to make efficient use of our panel data with two time points. It has the additional advantage of allowing us to include time-invariant indicators that are theoretically important (Hsiao 2014).
The following equation represents the panel regression model:

The cross-sectional dimension is denoted as i, and the longitudinal component is denoted as t. The relationship between dependent (y) and independent and control variables (xn) is estimated with coefficients (β n ) and a constant (α) and includes state-specific (ui), time-specific (wt), and case-specific (ε it ) disturbances.
Although the generalized least squares model maximizes efficiency, parsimony is especially important with only 100 cases. With that in mind, we conduct a series of robustness checks and postestimation diagnostic tests on models that include controls for theoretically important alternative predictors.
We report in a supplementary file detailed results of four sets of analyses that illustrate this process. In these examples, postestimation diagnostics indicate that the proportion of the population with postsecondary degrees and the age distribution of the population are problematic control variables. We exclude these indicators of demand for higher education in favor of unemployment. Our results are robust to these and other alternative model specifications, including regional controls and alternative indicators of political partisanship. 4 However, variation inflation factors and residuals plots indicate that excluding these indicators minimizes multicollinearity and heteroskedasticity.
With the remaining control variables included in each model, we analyze legislators’ degrees awarded from any public postsecondary institution and their in-state public postsecondary degrees separately. We report mean variation inflation factors in each of the models we present.
Results
We begin with a univariate analysis of changes in state spending on higher education and publicly educated state legislators. In Table 1, we report descriptive statistics for each indicator of state spending and legislators’ degrees disaggregated by year, the percentage change in each indicator’s mean between 2005 and 2014, and a t test for the statistical significance of the observed change. Mean state spending increased from $26,457 to $35,814. States allocated an average of 10.69 percent of their budgets to higher education in 2005 compared with 13.85 percent in 2014. A t test for the difference between means indicate that this nearly 30 percent increase is statistically significant (p < .05). That is, on average, states allocated more funds and larger portions of their budgets in 2014 than in 2005.
Public Higher Education Spending and Educational Composition of State Legislatures.

Note: For 2005, n = 50; for 2014, n = 50.
p < .10 and *p < .05, one-tailed t test for the difference between means with a 95 percent confidence interval.
However, our data reveal an opposite change in the concentration of public postsecondary degrees across legislatures. Between 2005 and 2014, we observe a significant decrease in the proportion of postsecondary degrees awarded from public institutions, especially those awarded in legislators’ states of representation. The mean percentage of public degrees held across legislatures declined from 75.83 to 70.86 and from 62.20 to 55.66, respectively. T tests for the difference between means indicate that these decreases are significant (p < .05). For reference, we note that across state legislatures, an average of 96.66 percent of representatives held postsecondary degrees of any type in 2005. That percentage increased to more than 98 percent in 2014. Together, our data indicate that state legislatures were composed of a higher share of representatives with private postsecondary degrees in 2014 than in 2005.
Next, we turn to multivariate regression analyses to test theories of representation as they relate to legislators’ educational backgrounds while also considering competing explanations for variation in state spending on higher education. We report the results of generalized least squares panel regression models in Table 2. Results of our analyses provide strong support for the application of theories of representation to educational backgrounds. Legislatures composed of larger proportions of representatives with postsecondary degrees awarded from public institutions tend to allocate more funds, in terms of spending priorities as well as total spending, to higher education.
Results of Generalized Least Squares Panel Regression Analyses of State Spending on Higher Education, 2005 and 2014 (n = 100).

Note: Standardized coefficients flagged for statistical significance; robust standard errors clustered by state in parentheses; unstandardized coefficients in italics.
p < .10, *p < .05, **p < .01, and ***p < .001 (two-tailed tests).
First, we evaluate the importance of explanatory variables relative to one another with the use of standardized coefficients that summarize the estimated impact of each indicator in reference to its observed distribution. The size and significance of the standardized coefficients of both indicators of the educational composition of legislatures are among the largest of any coefficients in the models. This relationship exists while controlling for the importance of postsecondary degrees in general. That is, although postsecondary degrees of any type are positively related to state spending on higher education, degrees awarded from public postsecondary institutions are most substantially and significantly predictive of variation in spending across states.
Briefly turning to competing explanations for state spending on higher education, we find that total state spending is most strongly predictive of higher education spending across all models. Large, positive coefficients in models 4, 5, and 6 indicate support for resource-based theories. Unsurprisingly, states with larger budgets spend more on higher education. However, large negative coefficients in models 1, 2, and 3 suggest that when resources are scarce, public higher education tends to be prioritized to a lesser extent than other budget items. In addition, we find some support for the importance of the gender composition of legislatures and of organizational stability. Legislatures with higher proportions of female representatives and those with term limits tend to allocate fewer resources to their college and university systems. Although statistically significant, the impacts of both indicators are small. We do not find support for the importance of partisanship in state legislatures, demand for postsecondary degrees, nor states’ broader educational climates.
We now return to our predictors of interest and interpret the results of our analyses in reference to the original units of analysis. We present the estimated effects of each type of legislators’ postsecondary degrees on higher education spending as a percentage of state spending (Figure 1) and in thousands of dollars (Figure 2). To illustrate our estimated effects, we use the unstandardized coefficients reported in Table 2 to calculate the marginal effects of each predictor of interest. For each point estimate, we depict the robust standard errors clustered by state with 95 percent confidence intervals. Each node represents the point estimate for the respective independent variables from 0 to 100 in increments of 10 percentage points. The nodes are slightly staggered to improve clarity. 5

Percentage state spending on higher education by educational composition of state legislatures.
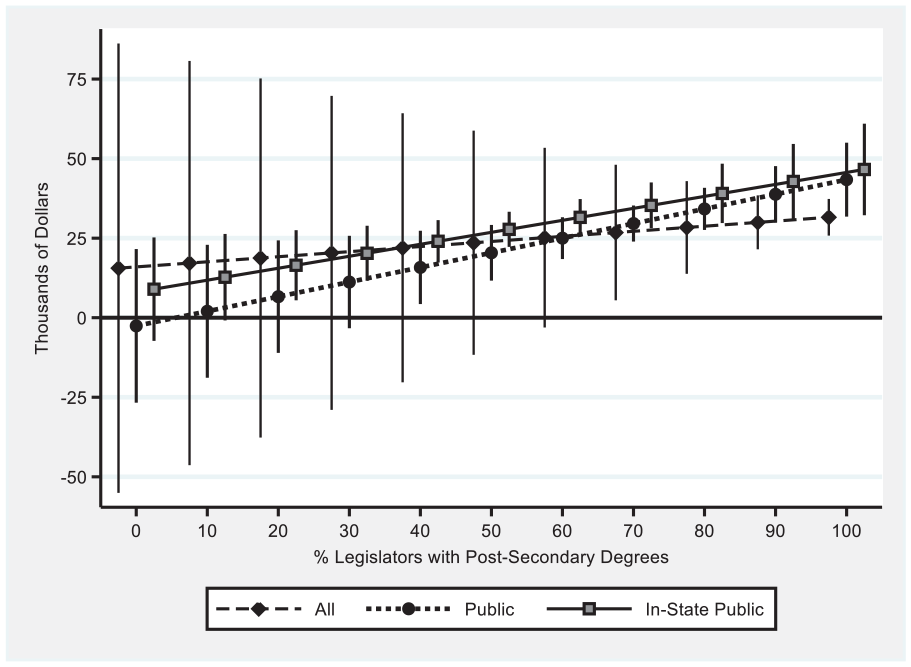
Total state spending on higher education by educational composition of state legislatures.
Both figures highlight the particular importance of public degrees in predicting state spending on higher education. We estimate that at least 80 percent of a state’s representative must have postsecondary degrees of any type to allocate any proportion of its funds to higher education. However, we estimate that only 40 percent of those degrees need be granted from public institutions to result in states’ spending any proportion of their funds on higher education. Furthermore, Figure 1 illustrates that there is no point at which the estimated effect of postsecondary degrees from any institution exceeds that of degrees from public institutions.
Figure 2 illustrates largely consistent point estimates in the impact of postsecondary degrees, regardless of the type of institution from which they are granted, on the percentage of states’ budgets allocated to higher education. However, as indicated by the confidence intervals, the strength of the link between legislature educational composition and state spending on higher education link is much stronger when degrees are awarded from public postsecondary institutions, regardless of whether they are awarded from the states legislators represent. Notably, the impact of in-state public degrees is especially predictive of prioritization of higher education over other budget items. We estimate that a state legislature will allocate some percentage of its funds to higher education when it is composed of at least 10 percent representatives with public in-state postsecondary degrees. The analogous figures are greater than 30 percent and greater than 60 percent for public degrees and degrees from any postsecondary institution, respectively.
Diverging Findings across States
To further examine our findings, we note the relevance of larger differences among states over our two time points. The dispersion of the distribution of both measures of state spending on higher education and all three measures of postsecondary degrees increased between 2005 and 2014. For each of these measures, we observe larger standard deviations in 2014. Additionally, we observe decreased lower bounds. In 2005, states spent at least $1.2 million and 3.03 percent of their budgets on higher education. These figures decreased to $930,000 and 1.81 percent of state spending in 2014. Over the time period, the upper bound of public postsecondary degrees remained stable, while the lower bound decreased
In sum, the results of our series of analyses indicate a positive and robust relationship between legislators’ educational backgrounds and state spending on higher education. Although nearly all state legislators hold postsecondary degrees, fewer of those degrees were awarded from public institutions in 2014 than in 2005. Fewer still were awarded in legislators’ states of representation. Overall, state support for public higher education increased between 2005 and 2014. However, the already considerable inequality in spending across states widened further. We find that despite the countervailing summary data, the positive relationship between educational background and spending remains with the inclusion of controls for numerous structural and political factors. Taken together, we suggest that the relationship between state funding for higher education and legislators’ postsecondary degrees is driven by increased inequality between states. From this, we infer that the increase in average spending between 2005 and 2014 would have increased to a larger extent had the proportion of legislators with public postsecondary degrees remained constant.
Discussion and Conclusion
Maintaining state funding for public higher education plays out in a complex and highly contentious sociopolitical and economic environment. Our results paint a mixed future regarding state legislative support of public higher education. On one hand, publicly educated legislatures appear to “pay it forward,” adding real value to the system of state-sponsored education that has long been central to the mission of state democracies and public will. On the other hand, significantly fewer publicly educated state legislators are being elected, thus indicating that at least one lever of support for state spending on public higher education is weakening. Yet overall, our findings indicate it may behoove the invested public to support lawmakers who have direct experience with public higher education. We provide evidence in favor of the claim that legislatures composed of relatively more publicly educated legislators invest more in higher education.
This finding has a number of implications for socioeconomic, racial, and ethnic stratification in the United States. Public universities are often deemed “engines of upward mobility” (e.g., Leonhardt 2015), and at their best, they equalize opportunities for a high-quality education for students of color and economically disadvantaged populations across the country. During our two time periods of data collection, college enrollment rates for Latinx students increased by 10 percent (NCES 2017a). Despite increases in tuition, public universities are still cost effective compared with private schooling. For the 2016–17 academic year, the average cost of one year of tuition, fees, and room and board at public institutions was an average of $27,314 less than the same expenses at private nonprofit institutions (NCES 2017b).
Furthermore, even while many states are reducing their financial support for public higher education, a four-year college degree is increasingly necessary when it comes to accessing a stable, high-paying job. And, as with primary and secondary schooling, the threat of a two-tiered, stratified system of higher education is an increasing reality. Thus, to speculate from our findings, we might predict that if legislators holding public degrees are allies of the public education mission, the presence of fewer allies may lower state investment, thus restricting the access of lower-income students to college and increasing their relative education debt burden. Already, our results show that the overall increase of higher public education spending masks wide variation across states, whereby many are not keeping up with the cost of public higher education. We find that this inequality is strongly tied to the makeup of the legislatures: the most robust spending happens where the highest proportion of state legislature have public degrees.
As with all studies, ours is not without limitations. First, though an improvement on findings based on one year of data, this study is based only on two time points, making a true exploration of causality or trends impossible. Second, without more and better data, there are a number of competing explanations we are unable to evaluate. For example, the relationship between legislators’ degrees and spending on higher education may be more nuanced and complex than our measures can detect. Future research should distinguish between postsecondary degree types and separate spending by sector of higher education. The predictors of state spending on vocational and technical schools, for example, may differ from universities.
Beyond educational history, there are many other aspects of a legislator’s identity and background that may contribute to his or her individual decision-making processes. Accounting for partisan control of legislature is only the beginning of understanding political effects. Future work can investigate whether public degree holding matters differently for Republican or Democratic legislators and whether the type of degree matters in combination with other factors, such as partisan match between state governors and legislatures. Future research should continue to establish the implicit causal claims and better understand the qualitative explanations for these findings. Next steps would also include efforts to directly model the relationship between state residence and degrees held, though given the strong tendency of states to offer reduced tuition to their residents, we can expect that residence is strongly predictive of access to higher education.
Going forward, it is difficult to know how these mechanisms will unfold. Other factors could step in to galvanize spending, such as grassroots demands and shifting electoral outcomes. Politically, it may be advantageous for state politicians with public degree backgrounds to emphasize this with voters and advantageous for state universities and colleges to encourage their graduates to pursue state civil service careers. Many public universities are connected to state legislators through boards of regents and use lobbying firms and interest groups at the state and national level to make their case to state legislatures and regents. These efforts may be the stopgaps to gain influence that was otherwise held through alumni in office and are a costly addition to university budgets. The market-driven professionalization and privatization of public higher education seems inevitable, though it must be remembered that political landscapes can change suddenly, the will of the people has held up against considerable counterforces throughout time, and sustainability often requires an investment in public services.
Supplemental Material
sj-docx-1-srd-10.1177_23780231211009992 – Supplemental material for Degrees of Support: State Spending on Higher Education and Public Postsecondary Degrees across State Legislatures, 2005 and 2014
Supplemental material, sj-docx-1-srd-10.1177_23780231211009992 for Degrees of Support: State Spending on Higher Education and Public Postsecondary Degrees across State Legislatures, 2005 and 2014 by Kristen Shorette, Megan Thiele and Catherine Bolzendahl in Socius
Supplemental Material
sj-docx-2-srd-10.1177_23780231211009992 – Supplemental material for Degrees of Support: State Spending on Higher Education and Public Postsecondary Degrees across State Legislatures, 2005 and 2014
Supplemental material, sj-docx-2-srd-10.1177_23780231211009992 for Degrees of Support: State Spending on Higher Education and Public Postsecondary Degrees across State Legislatures, 2005 and 2014 by Kristen Shorette, Megan Thiele and Catherine Bolzendahl in Socius
Supplemental Material
sj-docx-3-srd-10.1177_23780231211009992 – Supplemental material for Degrees of Support: State Spending on Higher Education and Public Postsecondary Degrees across State Legislatures, 2005 and 2014
Supplemental material, sj-docx-3-srd-10.1177_23780231211009992 for Degrees of Support: State Spending on Higher Education and Public Postsecondary Degrees across State Legislatures, 2005 and 2014 by Kristen Shorette, Megan Thiele and Catherine Bolzendahl in Socius
Supplemental Material
sj-docx-4-srd-10.1177_23780231211009992 – Supplemental material for Degrees of Support: State Spending on Higher Education and Public Postsecondary Degrees across State Legislatures, 2005 and 2014
Supplemental material, sj-docx-4-srd-10.1177_23780231211009992 for Degrees of Support: State Spending on Higher Education and Public Postsecondary Degrees across State Legislatures, 2005 and 2014 by Kristen Shorette, Megan Thiele and Catherine Bolzendahl in Socius
Supplemental Material
sj-docx-5-srd-10.1177_23780231211009992 – Supplemental material for Degrees of Support: State Spending on Higher Education and Public Postsecondary Degrees across State Legislatures, 2005 and 2014
Supplemental material, sj-docx-5-srd-10.1177_23780231211009992 for Degrees of Support: State Spending on Higher Education and Public Postsecondary Degrees across State Legislatures, 2005 and 2014 by Kristen Shorette, Megan Thiele and Catherine Bolzendahl in Socius
Supplemental Material
sj-docx-6-srd-10.1177_23780231211009992 – Supplemental material for Degrees of Support: State Spending on Higher Education and Public Postsecondary Degrees across State Legislatures, 2005 and 2014
Supplemental material, sj-docx-6-srd-10.1177_23780231211009992 for Degrees of Support: State Spending on Higher Education and Public Postsecondary Degrees across State Legislatures, 2005 and 2014 by Kristen Shorette, Megan Thiele and Catherine Bolzendahl in Socius
Footnotes
Acknowledgements
We are grateful to San José State University for supporting the compilation of original data. We are grateful to the College of Social Sciences at San José State University for its research grants, which funded a large portion of the original data collection. We are also grateful to the following research assistants for their assistance in compiling data: Inessa Arutunyan, Martin Mijares, Michelle Yeung, Erik Ugalde, Taylor Monser, Alexandria Hammond, and Miguel Gonzalez. In addition, we thank Carrie L. Shandra and Kathleen M. Fallon for their feedback on earlier drafts and two anonymous reviewers for their constructive comments.
Authors’ Note
We presented a previous version of this study at the 2018 annual meeting of the Sociology of Education Association in Asilomar, California.
Supplemental Material
Supplemental material for this article is available online.
1
Research often indicates that state legislature partisanship itself is often not useful, and even measures of interparty competition and the presence of “safe” seats do not show consistent effects. These issues are effectively reviewed in Stucky, Heimer, and Lang (2005). Furthermore, ![]() found that governing parties skew the distribution of funds in favor of areas that provide them with the strongest electoral support, supporting our key arguments but also suggesting a path dependence in partisanship and spending that undermines the variation needed to find partisanship as a key predictor.
found that governing parties skew the distribution of funds in favor of areas that provide them with the strongest electoral support, supporting our key arguments but also suggesting a path dependence in partisanship and spending that undermines the variation needed to find partisanship as a key predictor.
2
Because state populations also vary widely, we consider per capita spending as an indicator of states’ relative support for each constituent. These measures are significantly and highly correlated. We find consistent results regardless of how spending is standardized. Analyses of per capita spending are available upon request.
3
The following states have term limits in their legislatures: Arkansas, Arizona, California, Colorado, Florida, Louisiana, Maine, Michigan, Missouri, Montana, Nebraska, Nevada, Ohio, Oklahoma, and South Dakota.
4
Data for the percentage of the population with postsecondary degrees are from the Lumina Foundation for Higher Education (2010, ![]() ). We use age distribution data from the Census Bureau to test for demand posed by the 18- to 24-year-old population and competing demands posed by the population 65 and older. Both indicators are measured as a percentage of state population. Percentage population aged 18 to 24 is natural log transformed to prevent skew. We test percentage population aged 18 to 24 and percentage population aged 65 and above in separate models because of their dependence on each other. We use the Census Bureau–designated regions of Northeast, Midwest, South, and West to test for regional effects. Results are robust to alternative indicators of political partisanship and demand for higher education. We use Shor and McCarty’s (2018) indicators of state legislative ideology to test for partisanship effects.
). We use age distribution data from the Census Bureau to test for demand posed by the 18- to 24-year-old population and competing demands posed by the population 65 and older. Both indicators are measured as a percentage of state population. Percentage population aged 18 to 24 is natural log transformed to prevent skew. We test percentage population aged 18 to 24 and percentage population aged 65 and above in separate models because of their dependence on each other. We use the Census Bureau–designated regions of Northeast, Midwest, South, and West to test for regional effects. Results are robust to alternative indicators of political partisanship and demand for higher education. We use Shor and McCarty’s (2018) indicators of state legislative ideology to test for partisanship effects.
5
To display each of the three indicators of legislature composition on the same figure, we use a two-step process. For each indicator, we calculate its marginal effects on the respective outcome. We then overlay the resulting coefficient plots.
Author Biographies
References
Supplementary Material
Please find the following supplemental material available below.
For Open Access articles published under a Creative Commons License, all supplemental material carries the same license as the article it is associated with.
For non-Open Access articles published, all supplemental material carries a non-exclusive license, and permission requests for re-use of supplemental material or any part of supplemental material shall be sent directly to the copyright owner as specified in the copyright notice associated with the article.