
Abstract
We utilize longitudinal social network data collected pre–COVID-19 in June 2019 and compare them with data collected in the midst of COVID in June 2020. We find significant decreases in network density and global network size following a period of profound social isolation. While there is an overall increase in loneliness during this era, certain social network characteristics of individuals are associated with smaller increases in loneliness. Specifically, we find that people with fewer than five “very close” relationships report increases in loneliness. We further find that face-to-face interactions, as well as the duration and frequency of interactions with very close ties, are associated with smaller increases in loneliness during the pandemic. We also report on factors that do not moderate the effect of social isolation on perceived loneliness, such as gender, age, or overall social network size.
Efforts undertaken to try to minimize the spread of COVID-19 have dramatically altered social life. Beginning in the middle of March of 2020, most U.S. residents were under “stay at home” orders and advised to shelter in place. More than 40 percent of U.S. workers were still working from home full-time in June, the vast majority of students were sent home from school, and travel came to a virtual standstill (Baker et al. 2020; Education Week 2020; Oxford and Osborne 2020). The majority of institutions that structure our social lives were disrupted (Feld 1981; Small 2017; Small, Deeds Pamphile, and McMahan 2015). As state-mandated lockdown orders began to lift at varying rates in early June, considerable restrictions on social interaction remained. As of November 2020, people were still advised to wear masks, social distance, and keep six feet apart.
While existing research has examined the network characteristics associated with loneliness during periods of social stability, the extent to which network size, structure, or composition helps protect against loneliness during periods of prolonged isolation remains understudied. Moreover, very little research in the social sciences has examined changes in networks in response to large-scale exogenous shocks (Romero, Uzzi, and Kleinberg 2016). While research has found an increase in network cohesion and network shrinkage in response to natural disasters (Forgette et al. 2009; Phan and Airoldi 2015), as well as a tendency to “turtle up” or an intensification of strong-tie interactions and clustering following price shocks (Romero et al. 2016), further research is needed to understand how networks have changed during COVID-19. We utilize longitudinal social network data collected pre-COVID (June 2019) and compare them with data collected in June of 2020 to examine changes in social networks following a period of intense social isolation. We also examine how different network properties relate to changes in loneliness during the pandemic.
Our study found a significant increase in loneliness between June 2019 and June 2020. During this period, which coincided with the COVID-19 epidemic, we found significant decreases in network density and the size of extended acquaintance networks. The factor, however, that was most robustly associated with lower levels of loneliness was the number of very close ties in one’s networks, though the effect was nonlinear. Beyond just the number of close ties one has, the frequency, duration, and mode of communicating with very close ties were also associated with loneliness, such that face-to-face communication with very close ties is associated with smaller increases in loneliness during the pandemic.
Social Networks and Loneliness
Early studies have documented an increase in loneliness during COVID-19 (Gauthier et al. 2020; Killgore et al. 2020; Krendl and Perry 2020; van Tilburg et al. 2020). Loneliness is “a discrepancy between an individual’s preferred and actual social relations” that leads to distressing negative feelings of social isolation even when one is among family and friends (Peplau and Perlman 1982). Loneliness is a subjective experience, not simply a condition of being physically isolated. According to Cacioppo et al., “feeling alone or lonely does not necessarily mean being alone nor does being alone necessarily mean feeling alone” (Cacioppo et al. 2015:239). Put differently, while a lack of social interaction and time spent alone are correlated with loneliness, they are distinct psychological constructs (Russell, Peplau, and Cutrona 1980).
A study of 1,013 U.S. adults conducted three weeks after stay-at-home orders were enacted in most states using the UCLA Loneliness Scale found significantly elevated rates of loneliness. Forty-three percent of respondents exceeded the cutoff for high loneliness compared with a baseline of 38 percent reported in prior work (Killgore et al. 2020). A study of a large population of older Dutch adults found that loss of social contact, loss of work, and needing but not receiving social support were associated with emotional loneliness during the pandemic (van Tilburg et al. 2020).
Since the time of Durkheim, sociologists have been keenly aware of the negative consequences of social isolation (Durkheim 2014). A growing body of research at the intersection of social networks and loneliness has found that the quality and quantity of social connections, as well as their structure, are associated with loneliness. In general, the literature on network structure and loneliness has focused on four dimensions: network size, the number of close or intimate ties one has, density, and network composition (particularly, familial ties).
Overall network size, or the number of contacts the respondent frequently interacts with, has not been found to be a consistently significant predictor of loneliness in cross-sectional analyses (Stokes 1985). Yet, network size may be important during crises. Prior work has found that Katrina survivors embedded in larger social networks experienced fewer financial, physical, and health disturbances as a result of the disaster (Forgette et al. 2009). However, survivors’ networks decayed substantially (by more than 25 percent) postcrisis, suggesting that networks themselves are not particularly resilient to negative shocks (Forgette et al. 2009).
Having more confidants or very close ties in one’s network is generally associated with lower levels of loneliness (Hawkley et al. 2008; van Tilburg 1990). The marginal effect of an additional very close tie is especially large for the four closest ties, while additional close ties beyond the first four continue to be associated with lower levels of loneliness but are not as protective (Gierveld, Tilburg, and Dykstra 2006). The composition of these intimate ties also seems to matter, with people whose networks are composed primarily of familial ties being at higher risk of loneliness than those with more heterogenous networks (Dykstra 1990; Silverstein, Chen, and Heller 1996). Finally, network density has been shown to help guard against loneliness. In a study that simultaneously examined network size, closeness, and density, as well as individual and personality characteristics, network density was found to be the strongest predictor of loneliness (Stokes 1985). While density can help protect against loneliness during periods of stability, research has found that network density can have negative effects during periods of change, such as divorce, widowhood, and transitioning to college (Cacioppo, Fowler, and Christakis 2009; Hirsch 1980; Wilcox 1981).
Beyond the frequency and structure of interactions, modes of communication may also be associated with loneliness. Recent research suggest that smartphone usage increased during the pandemic. A study of Flemish adults found that on average, users were spending more time on their phones, roughly 45 more minutes than prior to the outbreak. The increase arose from an increased duration of calls, texts, and media use rather than more frequent use (Ohme et al. 2020). While more frequent and longer face-to-face social interactions have been associated with lower rates of loneliness outside of the pandemic in some studies (Lee and Ko 2018; Roberts and Dunbar 2011; Russell et al. 1980), there is mixed evidence of the extent to which communication via phone, videoconferencing, text, or email reduces loneliness. Randomized control trials examining modality of communication remain fairly limited (Noone et al. 2020) but are necessary to deal with the selection issues endemic to studies in this area. Given the restrictions on face-to-face interactions during COVID-19, the pandemic presents an unusual opportunity to study whether technologically mediated communication can act as an effective substitute for face-to-face interaction while avoiding some of the selection issues common in this line of research. Early research on older adults has found that the strength of social relationships, but not how frequently they engaged with social contacts, was associated with depression during COVID-19 (Krendl and Perry 2020). This suggests that technologically mediated communication may not have been an effective substitute for other forms of social interaction during the pandemic.
Existing research has documented the key role that social networks play in guarding against loneliness (Gierveld et al. 2006; Hawkley et al. 2008; Stokes 1985) as well as the role of external shocks in shaping networks (Phan and Airoldi 2015; Romero et al. 2016). COVID-19 is likely to be a particularly disruptive shock to networks since many of the foci for social activities that structure our daily social interactions from schools to workplaces (Feld 1981; Hsung, Lin, and Breiger 2010; Small 2017) were closed during the lockdown. We bring together these two streams of research and build on a growing literature examining how individuals’ networks change over time (Burt 2000; Sasovova et al. 2010; Small et al. 2015). We do so by examining how networks have changed during the social isolation brought about by the COVID-19 pandemic as well as the relationship between these changes and loneliness. In doing so, we contribute to research at the intersection of social networks and mental health by highlighting how exogenous events can shape networks and, in turn, mental health (Kawachi and Berkman 2001; Liu, King, and Bearman 2010; Perry and Pescosolido 2015) and answer calls for more research on how COVID-19 has disrupted networks (Gauthier et al. 2020). The context also affords an important opportunity to examine exogenously induced social isolation, networks, and loneliness. Moreover, this study provides insight into one of the most profoundly impactful social experiences of our time.
Data
We recruited survey participants from a Yale University local participant research pool. Surveys were completed for a small monetary payment, and the survey questions and design were deemed exempt by the Yale Institutional Review Board. The surveys were administered online. We collected our data in two waves. The first wave was collected in mid-June 2019. The second wave was collected in mid-June of 2020, just before the state entered its second stage of reopening. In both waves, we conducted a detailed survey with participants answering questions about their perceptions of loneliness, detailed information on their social networks, frequency and mode of communication, and demographic characteristics, such as gender, age, and race-ethnicity.
Because our sample is drawn from a specific state and county, participants in our sample are exposed to the same quarantine requirements (e.g., closure of major foci for social activity, such as restaurants, bars, hair salons, and schools). Of the respondents, 50.1 percent were employed, 4.7 percent were living alone, 38 percent were female, 81 percent were white, and their average age was 27.6 years. Only a small proportion (two people, 0.8 percent of the sample in the second wave) were recently laid off or unemployed due to COVID. The sample is a convenience sample (whoever signed up to the local university’s participant pool) and is admittedly not representative of the larger U.S. population.
The first wave of the survey was completed by 418 participants. A year later, we contacted the same participants through the email address they provided and asked them to do a follow-up survey. The follow-up survey included the same questions asked during the first wave; in addition, it contained a few questions about the respondents’ communication patterns, employment status, and household living situation during the COVID-19 quarantine. (See the appendix for all questions and instruments used in the survey.) Out of the 418 original participants, 189 participants completed the second wave of the survey. Because our main aim is to compare the change in loneliness pre- and postquarantine, we report results using these 189 participants. Additional analyses show that even though there is some self-selection bias into the second wave such that African Americans, Latinx people, and people with more social ties or a higher level of loneliness are less likely to repeat the survey, additional analyses show that our results hold even after controlling for the self-selection bias statistically with a Heckman correction (see Table A1 in the appendix).
Loneliness Scale
We used the UCLA Loneliness Scale (Version 3; Russell 1996), an established scale in the psychology literature that has been applied in more than 3,000 studies. We asked the participants 20 items of the loneliness scale, about half positively worded (“I have people to talk to”) and half negatively worded (“I feel lonely”). People responded on a 4-point Likert scale. The questions were displayed in a randomized order. We reverse-coded the responses to positively worded statements, so that higher values correspond to higher loneliness, and took the average of the responses to create a composite loneliness scale. The Cronbach’s alpha test value was .89, confirming that the question items can be combined into a single scale.
Network Survey
The network survey was conducted using the Assess Your Network survey platform (www.assessyournetwork.com). Participants were asked to name up to seven people with whom they have discussed important matters, up to seven people in their organization (workplace, school, etc.) who are important for them to get decisions done, and up to seven people with whom they spend social time with. Using an ego-network approach, the survey also asked participants about relationships among their alters. Participants were then asked about the gender, age, and occupation of these people and their relationship with them (family/work/friend, how close they are to each other, how often they communicate). From the survey answers, we calculated aggregate ego-network measures to characterize each respondent’s social networks in terms of overall composition, closeness, frequency of communication, and density. (See Figures A1 to A6 in the appendix for the actual questions in the survey.) Density was calculated as the total number of observed edges divided by the total number of possible edges. Edges between alters were defined by asking whether alters knew one another (see Appendix Figure A4).
Global network size, or the estimated size of the respondents’ extended acquaintance network, was calculated using the network scale-up method, which allowed us to estimate the overall size of a respondent’s networks beyond their ego network (Zheng, Salganik, and Gelman 2006). Following McCarty et al. (2001), in this context, “knowing” someone was defined as (1) recognizing them by sight or name, (2) being able to contact them without searching online for their email address or connecting through social media, and (3) having been in contact with them by phone, snail mail, or face-to-face in the past two years. To estimate network size, we asked respondents how many people they know named Alan, Adam, Bruce, Emily, and Rachel. The names for the network size estimate are taken from McCormick, Salganik, and Zheng (2010) since they tend to generate less biased estimates across age groups. (See Appendix Figure A2 for questions.) For each of these names, we calculated global network size by scaling up responses based on how frequently the names occur in the United States and then took the average across all five names.
Mode of Communication
To assess how frequently respondents used various modes of communication (phone, text, face-to-face, email, video calling, etc.) to interact with members of their network of varying tie strengths, we used a modified version of the Rochester Interaction Record (Cohen et al. 2015; Reis and Wheeler 1991). This work has established that a 10-minute minimum duration improves respondents’ accuracy at recalling interactions and provides a well-established definition of what constitutes an interaction. While doing a full time-diary analysis was beyond the scope of this study, previous work has found that recollection of interactions within 24 hours is accurate (Cohen et al. 2015; Reis and Wheeler 1991). Accuracy is likely to be increased in our study since most interactions happened over media that has digital records (phone, email, video-calling logs). Participants were asked to draw on these logs when answering questions about the duration and frequency of interactions.
Method
Our primary goal is to explore what social network patterns are associated with changes in levels of loneliness from June 2019 to June 2020. We first report on simple mean comparisons of the key variables in June 2019 and June 2020. We then turn to a regression framework and use 2019 levels of the key variables to predict change in loneliness from 2019 to 2020.
We explicitly note that for our independent variables, the count and strength of network ties and network density, we are estimating the effect of the level of the relevant variables. We do so because this statistical modeling approach is closer to the spirit of our argument. We are interested in how social networks may buffer against increases in loneliness during COVID-19 lockdowns. This is an argument about a moderation effect, specifically, how network ties moderate the effect of the lockdown. Because it is a moderation argument, the level of variables should be used. 1
Because there are significant changes in individuals’ reported social networks, the next question is then to decide whether we want to explore the effects of the 2019 or the 2020 network characteristics. Arguments could be made for and against either of the network time snapshots, so we present results using both alternatives. Finally, we examine associations between the frequency, duration, and modality of interaction and loneliness.
All models control for loneliness in 2019 as well as employment status, whether the respondent lived alone, gender, race-ethnicity, and age, which have been shown in previous studies to be associated with loneliness. We first report models for very close or close ties, network density, and network size separately before reporting the full combined model. We take this modeling approach since network variables are frequently highly correlated. Theoretically, given time and cognitive constraints, there are often trade-offs between the number and strength of ties someone can maintain. Moreover, density is likely to be higher in networks composed of strong ties. By first examining these variables separately, we can assess their independent associations with loneliness.
Results
We first report on simple mean comparisons of the key variables in June 2019 and June 2020. Table 1 shows the results. Loneliness increased significantly during COVID-19: The average loneliness score in 2019 was 2.69 versus 2.82 in 2020 (t = −3.96, p < .001), corresponding to a 0.29-standard-deviation increase in loneliness.
Comparison of the June 2019 and June 2020 Values of Key Variables.

Note: N = 189. CI = confidence interval.
For this question, N = 161 because not all participants answered the network scale-up questions, based on which this variable is calculated.
This period was also accompanied by considerable shifts in network composition and structure. We find that the global estimated network size of respondents decreased from 1,503 people in June 2019 to 1,098 individuals in June 2020 (t = 3.51, p < .001). Interestingly, we observed statistically significant differences for men and women. Men’s networks experienced significantly more shrinkage than women’s networks (t = −2.75, p < .001). 2
The overall count of very close and close ties in core networks did not significantly change during this period. While the overall count of very close ties does not change, the composition of very close ties changes: We see a decrease in the count of very close friends (1.51 vs. 1.21, t = 2.80, p < .01) and very close colleagues (0.26 vs. 0.20, t = 1.645, p = .051) but an increase in the count of very close family members in individuals’ core networks (1.20 vs. 1.52, t = 3.589, p < .001). Finally, the density of the reported network decreases from 0.69 to 0.64 (t = 3.43, p < .001).
Table 2 reports regression results that explore network factors associated with the change in reported loneliness between 2019 and 2020. The eight model specifications are all linear regressions predicting a change in the person’s reported loneliness. Models 1 through 4 use the respondents’ 2019 network information to predict the change in their reported loneliness from 2019 to 2020. Models 5 through 8 use the respondent’s 2020 network information to predict the change in their reported loneliness from 2019 to 2020. In each model, we control for the respondent’s level of loneliness in 2019. The results across the models show that while global network size in 2019, or the number of people the respondent recalls knowing, is not associated significantly with the change in loneliness, there is a negative and significant association between the number of people the respondent recalled knowing in 2020 and change in loneliness.
Linear Regressions Predicting a Person’s Change in Level of Loneliness from 2019 to 2020.
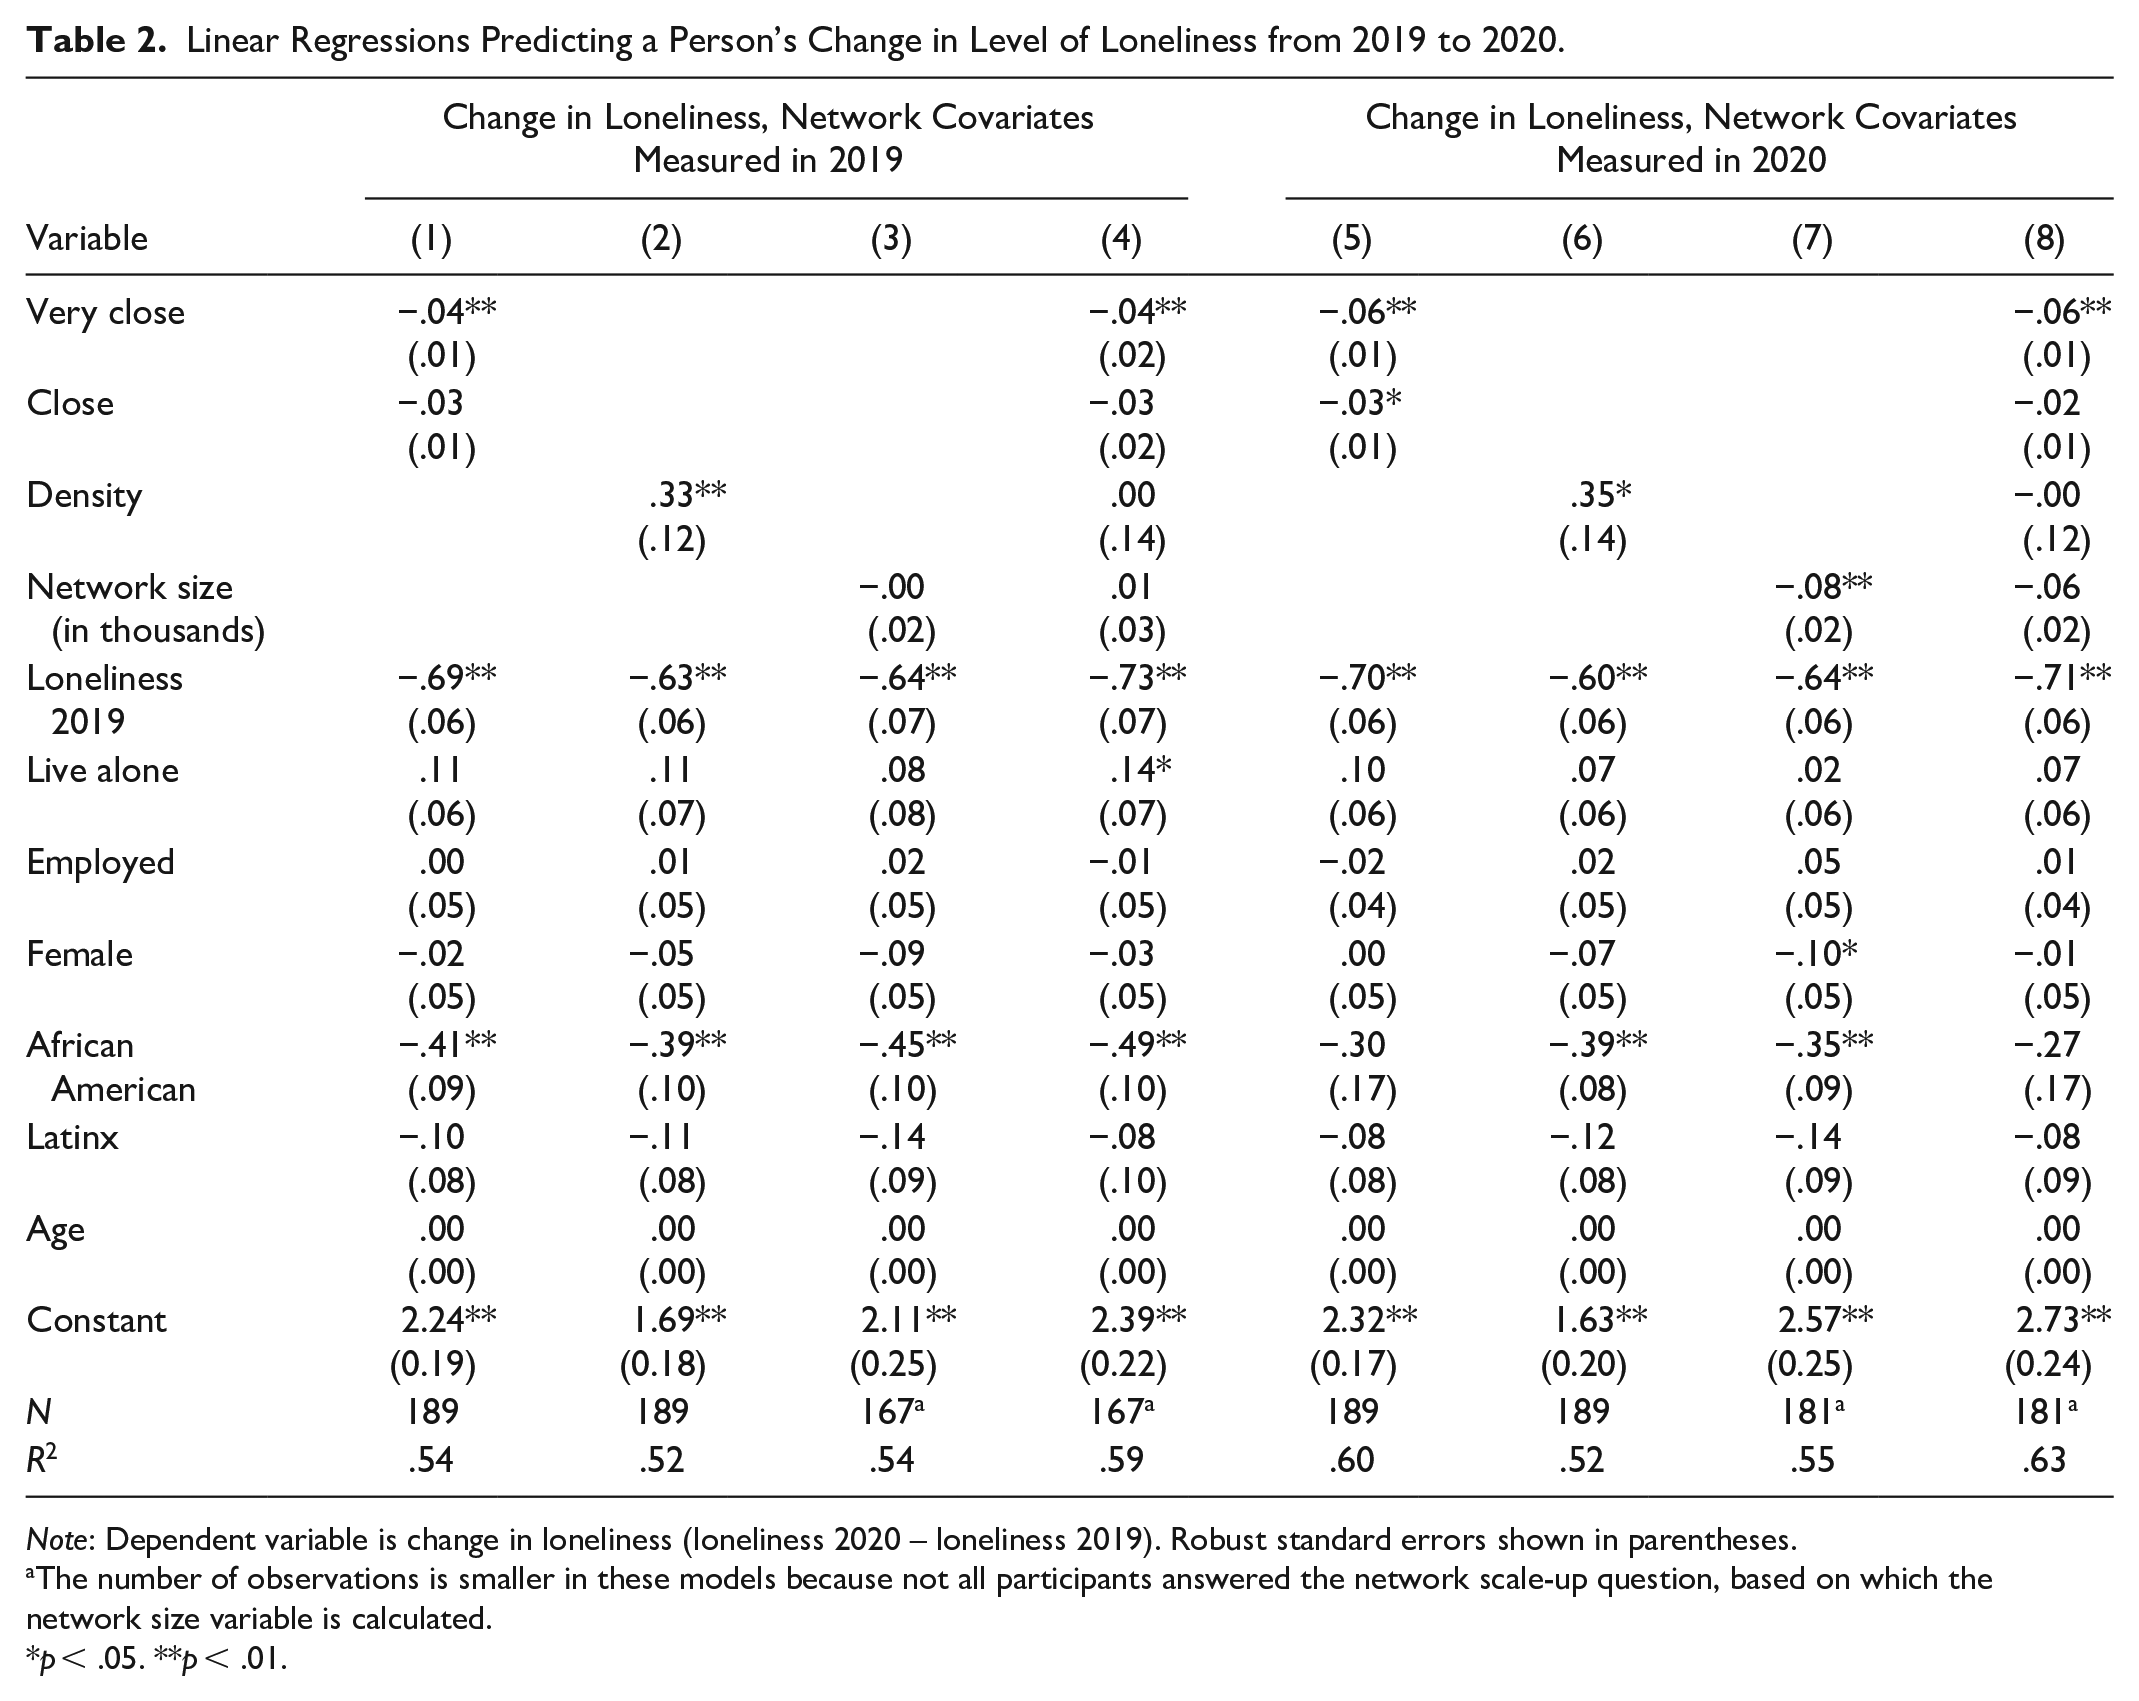
Note: Dependent variable is change in loneliness (loneliness 2020 – loneliness 2019). Robust standard errors shown in parentheses.
The number of observations is smaller in these models because not all participants answered the network scale-up question, based on which the network size variable is calculated.
p < .05. **p < .01.
Participants with a larger number of very close and close ties reported lower increase in loneliness during COVID-19 than those with lower counts of very close and close ties. Across models, we also see that very close contacts are associated with lower increases in loneliness than close contacts. Based on the 2019 network data, each additional very close tie, on average, is associated with an 11 percent standard deviation lower increase in loneliness. In models without the full set of network controls, denser networks are associated with higher rates of self-reported loneliness, though this effect disappears when controls for the number of close ties and network size are included.
Gender, age, employment status, or living alone does not affect significantly whether the respondent reported an increased loneliness level in 2020. 3 In terms of race, we find that blacks and/or African Americans report lower increases in loneliness than non–African Americans, but given the very low number of African Americans in our sample (n = 6), we would refrain from making any substantial interpretation of this finding.
Because the count of very close contacts seems to be the most strongly associated with low increases in loneliness during the social isolation, we further explore this effect by replacing the linear term of “count of very close contacts” in Table 2’s Model 1 with dummy variables for each level of count of contacts and then plot the marginal effect of each level of very close contacts on change in loneliness. Figure 1 plots the results. We see that for respondents who did not report any very close contacts in 2019, there is no significant increase in loneliness during the social isolation—presumably because they did not have very close contacts before and already had higher levels of reported loneliness, so the social isolation and quarantine did not change this significantly. 4 Respondents with one to four very close ties reported in 2019 did report significantly higher loneliness in June 2020 than in June 2019. Respondents with five or more very close contacts did not report increased loneliness. 5

Change in loneliness=loneliness_2020-loneliness_2019, as a function of the count of very close contacts in 2019.
Next, we disaggregate the count of very close ties from type of tie (family, friends, colleagues, contacts from social organizations, contacts from professional organizations). Table 3 shows the results. Family, friends, and fellow members of professional organizations account for the reduction in loneliness associated with close ties. Similarly, tests for differences in coefficients for each of the categories across the two periods were also not significant. Collectively, these results suggest that family, friends, and fellow members of professional organizations had a stable association with loneliness irrespective of the pandemic.
Composition of Very Close Ties Predicting a Person’s Change in Level of Loneliness from 2019 to 2020.

Note: N = 189. Models include controls for self-reported loneliness in 2019, close ties, employment status, whether the respondent lived alone, gender, race-ethnicity, and age. Coefficient estimates for the controls are not shown here. Comparisons of coefficients for tie composition in 2019 and 2020 did not find statistically significant differences. Robust standard errors shown in parentheses.
p < .05. **p < .01.
Finally, Tables 4 and 5 report results exploring whether the frequency, duration, and mode of communication between respondents and their social ties are related to respondents’ change in reported loneliness from June 2019 to June 2020. Table 4 analyzes answers given to the questions “How many people did you interact with for at least 10 minutes in the previous 24 hours?” and “How many hours did you spend interacting with individuals during the past 24 hours?” Each answer was broken down by ties of different relationship length (see the appendix for the exact prompts). Table 4 shows that both more frequent and longer interactions with very close ties were associated with lower levels of increase in loneliness. Specifically, on basis of estimates in Model 3, we find that interaction with an additional very close tie, on average, is associated with a 13 percent standard deviation lower increase in loneliness, while each additional hour of interaction with a very close tie is associated with a 5 percent standard deviation lower increase in loneliness.
Interaction Frequency and Duration Predicting a Person’s Change in Level of Loneliness from 2019 to 2020.

Note: N = 189. Includes controls for self-reported loneliness in 2019, employment status, whether the respondent lived alone, gender, race, and age. Coefficient estimates for the controls are not shown here. Robust standard errors shown in parentheses.
p < .05. **p < .01.
Interaction Mode Predicting a Person’s Change in Level of Loneliness from 2019 to 2020.
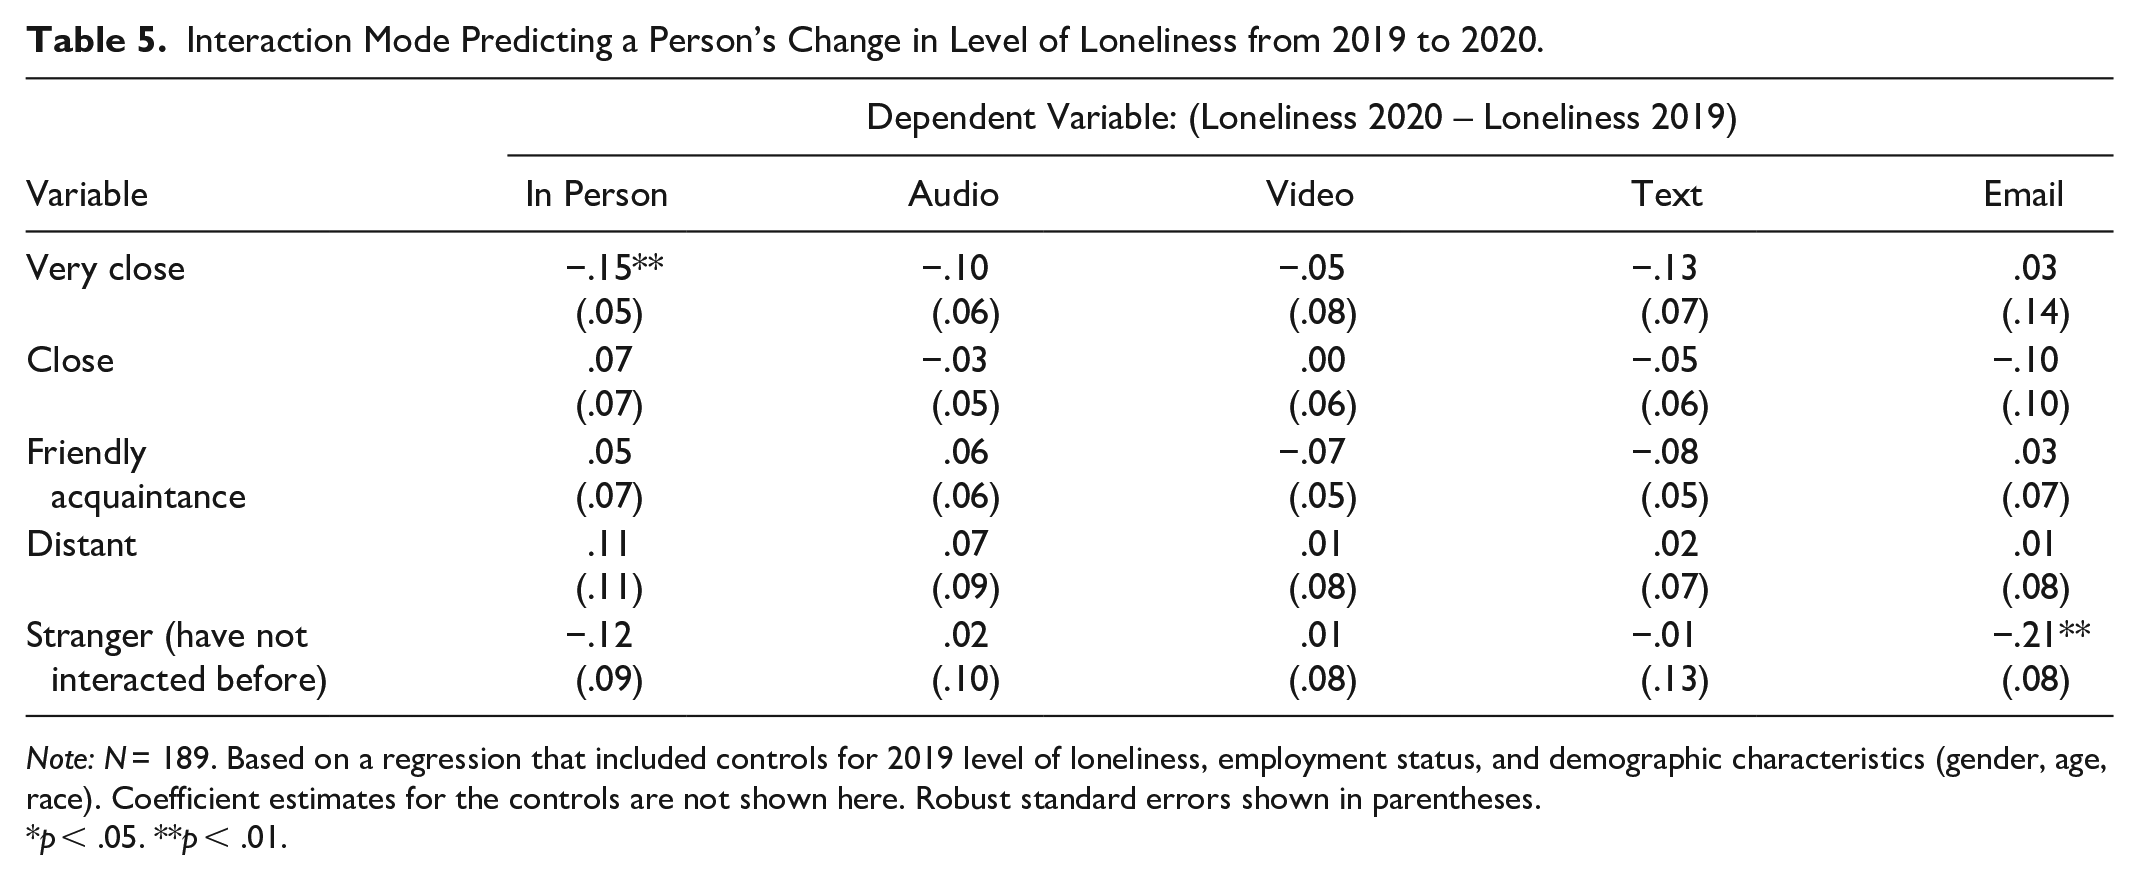
Note: N = 189. Based on a regression that included controls for 2019 level of loneliness, employment status, and demographic characteristics (gender, age, race). Coefficient estimates for the controls are not shown here. Robust standard errors shown in parentheses.
p < .05. **p < .01.
Table 5 explores how the mode of communication with social ties is associated with the change in loneliness (based on the question shown in Figure A4 in the appendix). The only mode of communication for very close ties that was statistically significant was in-person communication. The effect is quite sizable: People who reported to have interacted with a very close tie in person reported a 31 percent standard deviation lower increase in loneliness than those who did not have an in-person interaction with a very close tie. Interestingly, emailing with strangers (people previously not known to the participant) was also associated with lower levels of increase in self-reported loneliness.
Discussion, Limitations, and Future Work
We utilize longitudinal social network data collected pre–COVID-19 in June 2019 and compare them with data collected in June 2020. We found significant decreases in the size of respondents’ acquaintance networks during COVID-19 but a strengthening of their closest ties. This is consistent with prior work that has found that crises, negative affect, and stressful external shocks lead networks to “turtle up” or focus on stronger ties (Romero et al. 2016) and shrink (Forgette et al., 2009; Shea et al., 2015). While the network shrinkage we observe may arise from a smaller part of one’s acquaintance network being activated and mobilized (Menon and Smith 2014; Shea et al. 2015), social disruption and a lack of social interaction are also likely contributors to shrinkage (Gauthier et al. 2020). After two months without face-to-face contact, feelings of closeness between friends and family members drop by more than 30 percent, according to a study by Roberts and Dunbar (2011). For friends, feelings of closeness continue to decline, dropping by close to 80 percent after five months. Thus, a lack of contact with friends and acquaintances may also help explain network shrinkage.
The gender differences in network shrinkage we observe are somewhat revealing in this regard. Given that we observe strong gender differences, it is unlikely that this finding is an artifact or arises from measurement error. However, the differences still do not provide a clear indication which mechanism may be driving this finding, since women tend to have more accurate network recall (Brashears, Hoagland, and Quintaine 2016) and also tend to rely more heavily on conversation to maintain ties (Roberts and Dunbar 2015). In contrast, men are more likely to rely on shared activities, which are more likely than conversation to be interrupted by COVID. Future research examining what accounts for the observed network shrinkage, as well as the observed gender differences, is needed.
The increased focus on close ties during COVID was associated with a lower increase in loneliness. We examine changes in perceived loneliness and changes in social networks following a period of intense social isolation. We find that while there was an overall increase in loneliness during the social isolation of March to June 2020, certain social network characteristics of individuals are associated with lower increases in loneliness. Specifically, we find that people with fewer than five close ties reported a higher increase in loneliness. It is worth noting that research estimating the size of core networks generally finds that most Americans have far fewer than five ties (Brashears 2011; Marsden 1987; McPherson, Smith-Lovin, and Brashears 2006). We show that both more frequent and longer interactions with very close ties were associated with a lower increase in loneliness, especially when the interaction was face-to-face. We also report on factors that do not moderate the effect of social isolation on change in perceived loneliness, such as gender, age, and overall social network size. Our work contributes to the literature on social networks and mental health by highlighting how exogenous events and social isolation can shape networks and, in turn, mental health (Kawachi and Berkman 2001; Liu et al. 2010; Perry and Pescosolido 2015).
One major advantage of our research design is that it utilizes an external shock of social isolation and therefore suffers to a lesser extent from endogeneity bias. That is, in theory, the arrow of causality can move both from perceptions of loneliness to social networks (people who feel lonely are less likely to make friends) and from social networks to loneliness (people with fewer social ties feel lonelier). Because the quarantine orders in the state directly influenced the opportunities to meet with one’s network, this external shock to social isolation provides evidence for the social network–to–loneliness pathway. While our statistical identification strategy cannot directly prove causality because it is not a randomized trial (it would be hard to do a randomize trial on people’s core social networks), our design utilizes an unanticipated external shock to help understand the network paths of loneliness.
Limitations
Of course, our paper is not without limitation. One limitation is sample size. Only 189 people completed both rounds of the survey, and this sample size limits the extent to which we can confidently report null results (such that age does not matter) or test other effects for which we do not have enough variability (for example, only 19 percent of respondents are nonwhite, and this translates to 37 people, making it impossible to earnestly study the effect of race and ethnicity). Also, the sample is a convenience sample and comprises individuals who signed up to our study through our university’s participant pool. We make no claims, therefore, about the representativeness of the participant pool to the general U.S. population.
Another related limitation of our sample is that it was collected in a limited geographical area—most respondents are from a single county. While this limits the generalizability of our sample to other geographical areas, our research design keeps constant the quarantine regulations our participants experienced. That is, because they all live in the same area, they were all subject to the same government regulations, workplace limitations, restaurant and movie theater closings, and so on.
Finally, our data allow us to compare two waves of data, one well before the social isolation started and one that was collected before the quarantine regulations were about to be eased. In the future, researchers could collect a third wave to see if the loneliness levels go back to pre-COVID times after the quarantine is over.
Implications
Our results document an association between social isolation due to the COVID-19 outbreak and increased loneliness. While loneliness in itself is an important phenomenon to study, social isolation–induced loneliness could have indirect health effects as well because loneliness is also associated with wide-ranging health problems such as high blood pressure, obesity, anxiety, depression, cognitive decline, Alzheimer’s disease, and suicide (Holt-Lunstad et al., 2015). We call for future research to study how these health indicators have changed during and after the period of social isolation and to study the extent to which these changes can be explained by increases in loneliness or moderated by social networks.
Our results also show that the increase in loneliness during the pandemic did not affect all people equally: People with more very close social ties and people with less dense networks were less likely to report increased loneliness during social isolation. Having many less close connections, however, did not seem to be associated with lower increase in loneliness. These patterns indicate that the lockdown had a heterogenous effect on the population. For individuals, our work suggests that focusing efforts on maintaining relationships with close ties through frequent, in-person communication may be an important way to curtail loneliness during periods of social isolation. We find little evidence that non-face-to-face modalities of communication, such as videoconferencing or text-based exchanges, are associated with a lower increase in loneliness, suggesting that alternative media are not an effective substitute for face-to-face interaction. The social isolation–induced increase in loneliness is, of course, just one of the aspects to be considered, but our results indicate that this is an important aspect to consider, especially given the secondary health effects of increased loneliness.
Footnotes
Appendix
Distribution of the Count of “Very Close” Ties in 2019 (on the Subsample of Participants Who Completed Both Waves of the Survey).

| Count of “Very Close” Ties | Frequency |
|---|---|
| 0 | 7 |
| 1 | 35 |
| 2 | 44 |
| 3 | 43 |
| 4 | 16 |
| 5 | 14 |
| 6 | 13 |
| 7 | 9 |
| 8 | 3 |
| 10 | 2 |
| 11 | 1 |
Acknowledgements
We are grateful for the research support of Jess Halten and Rob Bartholomew, and for the detailed feedback at a Yale internal seminar where we presented our results. We have no conflicts of interest to disclose.
Funding
The author(s) disclosed receipt of the following financial support for the research, authorship, and/or publication of this article: Data collection was sponsored by Yale University SOM’s Faculty Research Funds and its Behavioral Lab.