
Abstract
Lesbian and gay workers hold different occupations than straight workers, partly reflecting lesbian and gay workers’ tendency to avoid same-gender-dominated occupations. Previous studies have grappled with significant data limitations, obscuring patterns for bisexual workers and potentially biasing estimates of occupational segregation by sexual orientation. In this study the author addresses these limitations using large-scale, nationally representative data from the 2013–2018 National Health Interview Survey. Occupational segregation by sexual orientation is stronger among men than women. Within gender, lesbian/gay and bisexual workers are as segregated from each other as they are from straight workers. These differences are structured by both occupational gender composition and education: occupational segregation by sexual orientation is greatest among less educated workers and when correlated with occupational gender composition. These findings contribute to a more detailed empirical description of labor market inequalities by sexual orientation and offer some empirical puzzles for further theoretical development.
Labor market experiences for lesbian, gay, and bisexual (LGB) workers are structured by stereotypes and stigmas related to both sexual orientation and gender. 1 Compared with straight workers, gay men infrequently work in male-dominated occupations, and lesbians infrequently work in female-dominated occupations. This pattern may reflect lesbian and gay workers’ attempts to manage stigma and gender-related stereotypes in the workplace (Badgett and King 1997; Baumle, Compton, and Poston 2009; Gorsuch 2019; Tilcsik, Anteby, and Knight 2015). Occupation differences by sexual orientation may have other consequences for LGB workers. Occupations powerfully structure many dimensions of well-being (Weeden and Grusky 2005), and occupational segregation—differences in the distributions of groups of workers across occupations—by gender shapes inequalities in earnings, authority, and prestige (Reskin 1993; Reskin, McBrier, and Kmec 1999). Occupational segregation by sexual orientation and its association with occupational gender composition thus warrant further examination.
Most past studies of labor market outcomes by sexual orientation have grappled with significant data limitations. Data on gays and lesbians often come from the census or the American Community Survey (ACS), which indirectly measure sexual orientation through same-sex marriage or cohabitation (Baumle et al. 2009; Black et al. 2000). Other commonly used surveys directly measuring sexual orientation yield very small samples. Labor market outcomes are correlated with partnership, and relatively large samples are needed to reliably estimate the concentrations of LGB workers across occupations. As a result, the literature lacks population-representative estimates of occupational segregation by sexual orientation that can be compared with other common forms of occupational segregation (i.e., by gender or race/ethnicity). By extension, the importance of occupational gender composition and workers’ education may be insufficiently understood as well.
This research complements previous studies with an analysis of nationally representative data from the 2013–2018 National Health Interview Survey (NHIS). The NHIS offers both large sample sizes and an individual-level measure of sexual orientation and has recently been used to assess labor market inequalities by sexual orientation (Carpenter and Eppink 2017). The present results make several new contributions to the literature. First, I estimate lesbian-straight, gay-straight, and bisexual-straight occupational segregation separately and find substantial differences among them. Second, I examine the association between occupational segregation by sexual orientation and occupational gender composition, again finding large differences across groups. Third, I find that occupational segregation by sexual orientation differs by education, in part because of the negative association between education and occupational gender segregation (Blau, Brummund, and Liu 2013). Finally, I compare results from the NHIS and ACS, further establishing the robustness of the main findings. Overall, this research contributes to the growing empirical foundation for understanding labor market stratification by sexual orientation.
Prior Research on Occupational Segregation by Sexual Orientation
A growing literature documents differential labor market experiences for LGB relative to straight workers. Past studies have most typically focused on earnings differences. A small number of studies have documented that LGB workers also concentrate in different occupations than straight workers, potentially to limit their risk for experiencing discrimination. Based on 2000 census data, Baumle et al. (2009) found, “same-sex partners are overrepresented in the professions as a whole, and are concentrated in fields that focus on creativity, psychology/counseling, and law/ social work” (p. 168). Older evidence showed that workers in professional and technical occupations expressed more tolerant attitudes than workers in service or blue-collar occupations (Badgett 2001; Badgett and King 1997), even net of workers’ education. Gay and bisexual (GB) men, but not lesbian and bisexual (LB) women, disproportionately worked in these more tolerant occupations.
LGB workers are also more likely than straight workers to hold gender-integrated occupations (Badgett and King 1997; Baumle et al. 2009; Tilcsik et al. 2015). Despite stereotypes that gay and lesbian workers disproportionately work in occupations dominated by a different gender, the most prominent difference in past studies is that gay and lesbian workers are significantly underrepresented in occupations dominated by the same gender (Baumle et al. 2009). Gay men avoid male-dominated occupations, and lesbian women avoid female-dominated occupations.
The overlapping concentration of sexual minority and different-gender workers may stem from the gender typing of occupations—“men’s work” and “women’s work” (Reskin 1993)—combined with stereotypes or stigma regarding sexual minority workers. Homosexuality is constructed as gender-nonconforming behavior, which may face greater sanction in predominantly same-gender contexts. Experiments and audit studies have provided evidence that these dynamics may be especially strong among men and in male-typed jobs. Participants in one experiment perceived male job applicants with LGBT+-related résumé items as more feminine than male applicants without them (Pedulla 2014). In another experiment, male participants discriminated against LGBT+-signaling résumés more strongly than female participants (Gorsuch 2019). In Tilcsik’s (2011) audit study, discrimination against male applicants with LGBT+-related items was stronger among employers advertising stereotypically masculine traits such as assertiveness or decisiveness. Taken together, gender-related stigma against GB men combined with greater discrimination by men may lead GB men to avoid male-dominated occupations.
Evidence for the gender-related dynamics for LB women compared with presumably straight women differs from evidence for men. Mishel’s (2016) audit study demonstrated discrimination against women with LGBT+-signaling résumés compared with résumés without such activity. Gorsuch’s (2019) experiment found somewhat less discrimination against LGBT-signaling women than LGBT+-signaling men. Gorsuch also found that male participants penalized women’s résumés using stereotypically masculine adjectives, such as assertive or enterprising, but not when the résumés also signaled LGBT+ activities. Both LB and GB workers face discrimination, but the lower stigma for gender-nonconforming behavior by LB women (compared with GB men) makes their overrepresentation in male-dominated fields less puzzling.
Building on prior studies (Badgett 2001; e.g., Badgett and King 1997), Tilcsik et al. (2015) conceptualized “minority sexual orientation as a potential source of concealable stigma” (p. 447). They argued that LGB workers seek occupations that allow them to manage whether and how to disclose their sexual orientation in the workplace and moderate any negative consequences of stigma. Supporting this argument, Tilcsik et al. (2015:447) found that compared with straight workers, lesbian and gay workers held occupations with higher task independence and social perceptiveness, qualities that enable them to assess coworkers’ potential reactions to their sexual orientation or to blunt any negative repercussions by working independently of coworkers. These characteristics were positively correlated with occupational education and the fraction of women, but they did not fully account for their associations with the concentration of lesbian and gay workers.
Studies of occupational segregation by sexual orientation have often been constrained by substantial data limitations. The commonly used census and ACS indirectly measure sexual orientation through same-sex versus different-sex marriage or cohabitation (Baumle et al. 2009; Black et al. 2000; Tilcsik 2011). However, labor market outcomes significantly differ by partnership status. Moreover, partnership-based measures cannot identify those identifying as bisexual, for whom labor market outcomes differ from both straight and lesbian/gay workers (Carpenter and Eppink 2017; Mize 2016; Sabia 2014). The General Social Survey and National Longitudinal Study of Adolescent to Adult Health both directly measure sexual orientation (Badgett 1995; Mize 2016; Sabia 2014; Tilcsik et al. 2015), but sample sizes are prohibitively small for reliably estimating occupational segregation. Studies analyzing the General Social Survey have also pooled observations spanning decades, introducing substantial temporal variation in labor market and social conditions. The National Longitudinal Study of Adolescent to Adult Health is a cohort survey of young adults (ages 26–31 in Tilcsik et al. 2015), and labor market outcomes are strongly associated with age. Given these limitations, past evidence on occupational segregation by sexual orientation may suffer from nonnegligible biases if the sample constraints are strongly associated with occupation.
This study complements past research with an analysis of the 2013–2018 waves of the NHIS, which asks directly about sexual identity, includes relatively large samples, and represents the national adult population. Although the NHIS focuses on health-related characteristics, it has recently been used to examine labor market outcomes by sexual orientation (Carpenter and Eppink 2017). 2 To my knowledge, this study is the first to estimate the extent of occupational segregation by sexual orientation with the commonly used Duncan segregation index (Blau et al. 2013; Duncan and Duncan 1955; Reskin 1993) and compare its magnitude with other commonly studied forms of occupational segregation (i.e., by gender and race/ethnicity).
Research Questions
This study builds on past work to further examine occupational segregation by sexual orientation and its overlap with occupational gender composition, addressing three research questions.
Research Question 1: How strong is occupational segregation for LGB workers from straight workers?
In addition to excluding unpartnered workers, past studies relying on partnership-based measures have been unable to separate lesbian/gay and bisexual workers with same-sex partners. These studies have also been forced to include bisexual workers in different-sex partnerships with ostensibly straight workers. Even studies with direct measurements of sexual identity have often grouped LGB workers together because of sample-size constraints (e.g., Badgett and King 1997) or excluded bisexual workers altogether (e.g., Tilcsik et al. 2015). The degree of occupational segregation between bisexual and straight workers is thus unknown.
Occupational concentration for bisexual workers may notably differ from LG workers. Conceptualizing sexual orientation as concealable stigma (Tilcsik et al. 2015), bisexual workers may be more able to conceal their sexual orientation than lesbian and gay workers, particularly if bisexual workers are in different-sex relationships. Conversely, bisexual workers may be especially stigmatized if people view bisexuality as more of a personal choice than being gay or lesbian (Mize 2016). Empirically, both Mize (2016) and Sabia (2014) found that relative to straight men, bisexual men had larger earnings disparities than gay men. Carpenter and Eppink (2017) did not find significant bisexual-straight earnings disparities but did find especially large employment disparities. Findings also differed regarding bisexual versus lesbian women. Past evidence is thus unclear on whether bisexual workers concentrate in the same occupations as lesbian and gay workers or experience the same degree of occupational segregation from straight workers.
I also characterize the relative strength of occupational segregation by sexual orientation in comparison with occupational segregation by gender and race/ethnicity. To my knowledge, no prior studies examining occupation differences by sexual orientation have calculated the commonly used Duncan index for occupational segregation. As a result, it remains unclear how occupational segregation by sexual orientation compares with other well-recognized patterns of occupational segregation.
Research Question 2: How strongly does occupational gender composition contribute to lesbian-straight, gay-straight, and bisexual-straight occupational segregation?
Stemming from the first question, the greater tendency for LGB relative to straight workers to hold gender-integrated occupations may also differ among lesbians, gays, and bisexuals. If the concealability or nature of stigma and discrimination differs for lesbian, gay, or bisexual workers, the tendency to seek gender-integrated occupations to avoid stigma and discrimination may also differ. To test this possibility, I estimate the correlations between occupational gender composition and concentrations of LGB workers. I also estimate the extent to which observed patterns of lesbian-straight, gay-straight, and bisexual-straight occupation segregation can be accounted for by occupational gender composition.
Research Question 3: Does occupational segregation by sexual orientation differ by education?
Although multiple studies have examined the importance of occupational gender composition, there has been relatively little study of how education may shape occupational segregation by sexual orientation. Studies have repeatedly found that LGB workers have higher levels of education compared with straight workers (Baumle et al. 2009; Black et al. 2000). Recent population-level estimates found that LGB workers were 5.9 to 13.1 percentage points more likely than straight workers of the same gender to have a college degree (Carpenter and Eppink 2017). These education differences by sexual orientation may further shape occupational differences.
Higher education could plausibly contribute to either lower or greater occupational segregation by sexual orientation. Occupational segregation could be lower among more educated workers because education is correlated with positive attitudes toward gays and lesbians (Loftus 2001). Occupations with many highly educated workers may be more uniformly accepting, so more educated LGB workers may have less need to select specific occupations to avoid stigma and discrimination. Occupational gender segregation is also less severe for more educated workers (Blau et al. 2013), potentially implying occupational integration by sexual orientation by association.
One could also expect greater occupational segregation by sexual orientation for more educated workers. More educated workers have greater employment rates and access to a wider variety of occupations, particularly those that may be relatively accepting or allow greater management of potential stigma (Badgett and King 1997; Tilcsik et al. 2015). Constrained opportunities for less educated workers may force LGB workers into more similar occupations as their straight counterparts. Higher education among LGB workers may even be a strategy for accessing accepting occupations and avoiding discrimination.
These research questions are motivated by theories of occupational gender typing, concealable stigma, and educational stratification. Thorough tests of these theories are beyond the scope of this study. Answers to these research questions provide a more detailed empirical description of occupational segregation by sexual orientation, necessary for further theoretical tests in future work.
Data and Methods
The 2013–2018 NHIS is the primary data for this study, accessed through the Integrated Public Use Microdata Series (Blewett et al. 2019). The NHIS samples about 40,000 households annually, randomly selecting one adult per household for detailed survey questions. The NHIS focuses on health conditions and behaviors along with basic demographic and socioeconomic information, including a question about sexual orientation since 2013. The analytic sample includes 86,629 respondents of prime working age (25–64 years) who were currently employed at the time of the survey and have information on all key variables (sexual orientation, gender, age, education, and occupation). Given the inverted patterns of lesbian-straight and gay-straight labor market differences, all analyses are stratified by gender.
Gender and Sexual Orientation
The NHIS measures sex as a binary variable (male, female). Unfortunately, the NHIS does not currently include alternative sex categories or ask about gender identity. However, it is possible or even likely that respondents answer on the basis of their gender identity rather than biological sex. Although sex (biological categories) and gender (social identity) are distinct, I interpret the results in the more commonly used language of gender (men, women) to emphasize that labor market patterns are socially structured.
The NHIS question on sexual orientation is designed to measure identity (Miller and Ryan 2011), asking, “Which of the following best represents how you think of yourself?” Response categories include “gay or lesbian,” “straight, that is, not lesbian or gay,” “bisexual,” “something else,” and “I don’t know the answer.” Table 1 presents the number and percentage of the sample in each category by gender. Consistent with prior studies (Carpenter and Eppink 2017; Mize 2016), bisexual identities are more common for women than men.
Number and Percentage with Each Sexual Orientation by Gender.

Note: The sample is limited to employed workers 25 to 64 years of age with information on all variables. Estimated percentages apply National Health Interview Survey sampling weights.
For comparison with past research based on the census and ACS, I measure partnership using three categories: not married or cohabiting, married or cohabiting with a same-sex partner, and married or cohabiting with a different-sex partner. NHIS respondents provide information on all other household members, including their sex. Respondents also report their relationships to other household members, identifying which person is their married or cohabiting partner, if applicable.
Education
For analyses stratified by education, I create a binary variable for having a college degree (bachelor’s degree or higher) versus not having a college degree (including those with some college or an associate’s degree).
Occupational Characteristics
The NHIS codes the current or most recent job into 94 occupation categories, which are groupings based on the 2000 Standard Occupational Classification. The relatively course occupation categories in the NHIS (compared with about 500 detailed codes) are an unfortunate limitation, potentially obscuring segregation among detailed occupations within these categories. Occupational segregation may be underestimated as a result. Additional analyses with the ACS (described later) assess this potential bias.
I estimate occupational composition by aggregating the individual-level data, applying NHIS sampling weights. Occupation % LB or % GB is the percentage of respondents in each occupation identifying as lesbian/bisexual or gay/bisexual by gender. Occupation % lesbian/gay and % bisexual are the percentages of each gender identifying as lesbian/gay and bisexual specifically. I similarly estimate occupation % female. 3 Table 2 presents descriptive statistics at the individual level by gender and sexual orientation.
Means or Percentages and Standard Deviations (in Parentheses) by Gender and Sexual Orientation.

Note: The sample is limited to workers 25 to 64 years of age with information on all variables. Occupation-level characteristics aggregate individual-level data to 94 occupation categories. All estimates apply National Health Interview Survey sampling weights. GED = General Educational Development; GB = gay and bisexual; HS = high school; LB = lesbian and bisexual.
Analytic Strategy
Following past studies (Blau et al. 2013; Reskin 1993), I measure occupational segregation by sexual orientation using the Duncan segregation index (Duncan and Duncan 1955). The index is calculated as

where ni is the number workers with the given sexual orientation in occupation i, N is the total number of workers in the given sexual orientation, and Nocc is the total number of occupations. The index ranges from 0 (total integration) to 1 (total segregation) and can be interpreted as the percentage of one group that would have to change occupations to match the distribution of the other group. I calculate the segregation index separately for LB- or GB-straight segregation, lesbian- or gay-straight segregation, and bisexual-straight segregation.
To assess the importance of occupational gender composition, I compare the segregation indexes calculated previously with residual segregation that removes the correlation with the occupation % female. To calculate residual occupational segregation, I first predict the proportion of workers in each sexual orientation with the occupation % female using fractional logistic regression at the occupation level:

where
Second, I subtract the predicted proportions, which are a function of occupation % female only, from the observed proportions,

where
Third, I calculate the residual number of workers with each sexual orientation in each occupation i based on the residual proportions and the total number of workers in the occupation, ni,

Fourth, I calculate residual occupational segregation using these residual numbers of workers,

where D* is the extent of occupational segregation by sexual orientation if this segregation was uncorrelated with occupational gender composition. The difference between D and D* estimates the extent to which occupational gender composition contributes to occupational segregation by sexual orientation. To assess potential differences by education, I repeat these calculations separately for workers with and without college degrees.
I use a bootstrap approach to estimate potential sampling error, similar to prior studies using the dissimilarity index (e.g., Napierala and Denton 2017). I randomly sampled the individual-level data with replacement 500 times, obtaining the same sample size as the original data for each iteration. For each random sample, I again estimated the occupation-level characteristics and the resulting D and D*. These 500 iterations simulate the sampling distributions of the segregation indexes. The standard deviations of these 500 estimates of D and D* estimate their standard errors, and the 95 percent confidence intervals are the point estimate ± 1.96 × standard error.
I test the statistical significance for differences between any two segregation indexes, D1 and D2, with the z-score formula
Comparison with the ACS
In Appendix B, I compare results from the NHIS with results from the 2018 ACS. Following past studies (Baumle et al. 2009; Tilcsik et al. 2015), I indirectly measure sexual orientation using same-sex partnership as a proxy for being LGB and different-sex partnership as a proxy for being straight. Although the ACS lacks a direct measure of sexual identity, it offers very large sample sizes and detailed occupation categories (426 categories on the basis of the 2010 census codes). I assess the potential limitations of the NHIS’s more limited occupation categories by comparing occupation segregation in the ACS with 426 detailed occupation categories versus 99 aggregated categories. Any difference in segregation using the different occupation categories helps estimate the size and direction of any bias due to the NHIS’s more limited categories.
Results
Research Question 1: How Strong Is Occupational Segregation for LGB Workers from Straight Workers?
The degree of occupational segregation depends on both sexual orientation and gender, with several notable results. Table 3 presents Duncan segregation indexes for all LGB workers relative to straight workers, lesbian or gay workers relative to straight workers, and bisexual workers relative to straight workers by gender. The table also includes bootstrapped 95 percent confidence intervals. Confidence intervals are relatively wide for bisexual-straight segregation given the relatively small fraction of bisexual workers in the sample.
Occupational Segregation Index between each Sexual Minority Group and Straight-Identified Workers by Gender, with 95 Percent Confidence Intervals (in Parentheses).
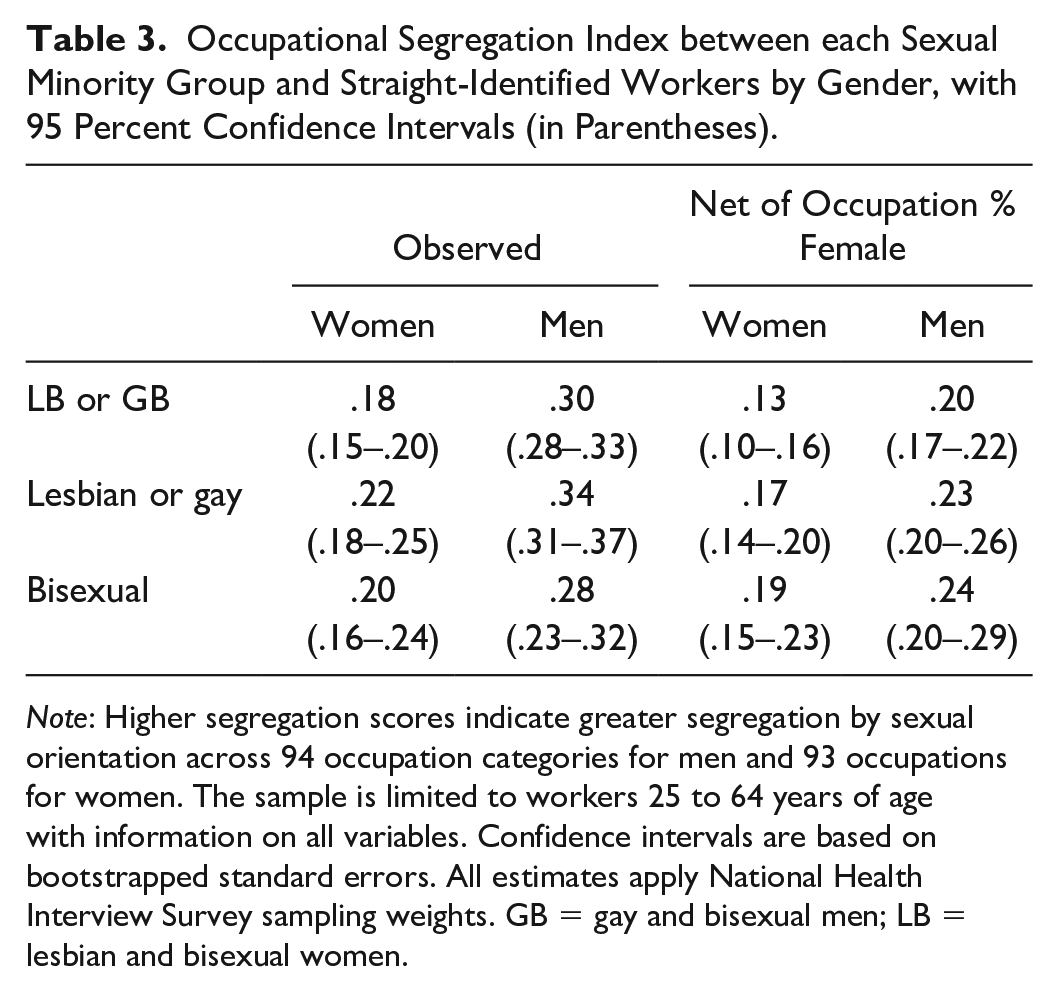
Note: Higher segregation scores indicate greater segregation by sexual orientation across 94 occupation categories for men and 93 occupations for women. The sample is limited to workers 25 to 64 years of age with information on all variables. Confidence intervals are based on bootstrapped standard errors. All estimates apply National Health Interview Survey sampling weights. GB = gay and bisexual men; LB = lesbian and bisexual women.
First, all segregation indexes are statistically significantly lower among women than men (p < .05). Greater segregation among men is consistent with past evidence that gay men experience somewhat greater discrimination than lesbian women and that men and male-typed jobs discriminate more (Gorsuch 2019; Tilcsik 2011).
Second, grouping LGB workers together mischaracterizes occupational segregation relative to straight workers. Both lesbian-straight and bisexual-straight segregation are greater than LB-straight segregation among women (statistically significantly so only for lesbian-straight segregation). Lesbian-straight and bisexual-straight segregation among women are of similar magnitudes, and the difference is not statistically significant. Among men, gay-straight segregation is statistically significantly greater than GB-straight segregation (p < .001) and bisexual-straight segregation (p < .05).
Third, lesbian/gay and bisexual workers concentrate in different occupations. LGB workers all experience at least moderate occupational segregation from straight workers, but they are also occupationally segregated from each other. As shown in Tables A1 and A2 in Appendix A, there is little overlap in the list of occupations with the highest fractions of lesbian/gay versus bisexual workers by gender, especially among men. Table A3 in Appendix A presents correlations between all occupational composition variables by gender. At the occupation level, the correlation between occupation % gay and occupation % bisexual among men is .30 (p < .001), and the correlation between occupation % lesbian and occupation % bisexual among women is only .13 (p = .06). These differences explain why pooled LG-straight and GB-straight dissimilarity estimates mischaracterize lesbian/gay-straight and bisexual-straight occupational segregation.
Fourth, occupational segregation by sexual orientation is comparable with or stronger than racial/ethnic segregation but weaker than gender segregation. Overall, lesbian-straight and bisexual-straight occupational segregation among women are lowest but still similar to occupational segregation between non-Hispanic whites and all other racial/ethnic groups (D = .20). Gay-straight occupational segregation among men is greatest but still weaker than occupational segregation by gender (D = .43). These comparisons suggest that occupational segregation by sexual orientation can be characterized as moderate in strength.
Question 2: How Strongly Does Occupational Gender Composition Contribute to Lesbian-Straight, Gay-Straight, and Bisexual-Straight Occupational Segregation?
The results demonstrate that occupational gender composition matters most for the occupational concentrations of gay men and lesbian women. However, it matters less for occupational concentrations of bisexual men and women. This difference can be seen in three ways.
First, lesbian and gay workers hold the most gender-integrated occupations, on average. As shown in Table 2, the average occupation % female for gay men is 14.6 percentage points higher than for straight men, but the difference for bisexual compared with straight men is only 7.7 percentage points. The occupation % female is more similar for lesbian and bisexual women.
Second, occupation % female is more strongly associated with the occupational concentrations of lesbian or gay workers than with the concentrations of bisexual workers. Figure 1 presents the occupational concentrations of lesbian/gay and bisexual workers by occupation % female and gender. 5 Occupation % gay among men is strongly positively correlated with occupation % female (r = .71), and occupation % lesbian is moderately negatively correlated with occupation % female (r = –.43). The correlations between occupation % bisexual and occupation % female are in the same direction for each gender but much weaker.
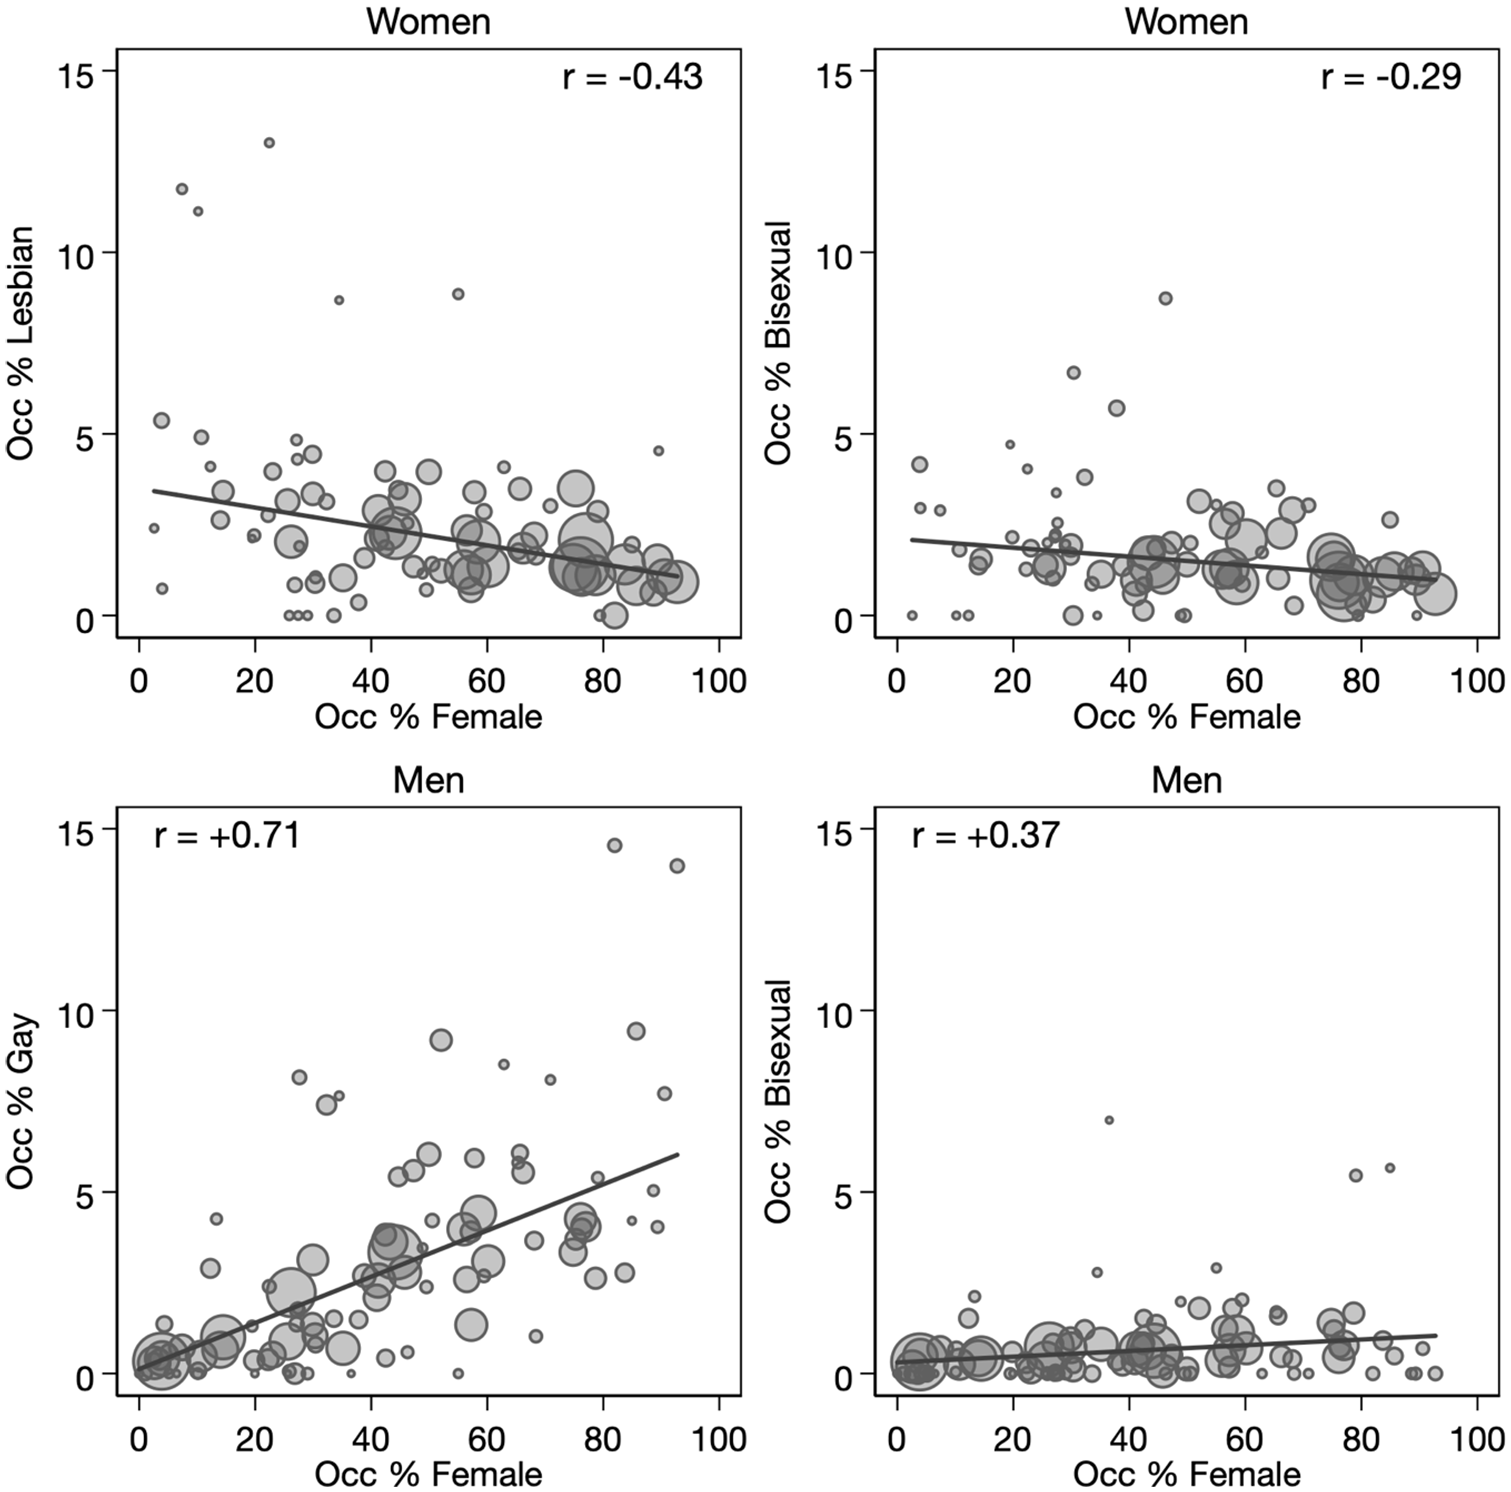
Associations between occupation % lesbian, gay, or bisexual and % female by gender.
Third, occupation % female accounts for moderate shares of gay-straight and lesbian-straight occupational segregation but small shares of bisexual-straight segregation. As shown in Table 3, residual occupational segregation by sexual orientation, which removes the portion correlated with occupation % female, is lower than observed segregation for all groups. The difference is greatest for gay-straight segregation among men, with residual segregation being 32 percent smaller than observed segregation (p < .001). Residual lesbian-straight segregation is 21 percent smaller than the observed value (p < .001). However, residual bisexual-straight segregation is only 12 percent smaller than the observed value among men (p < .05) and 6 percent smaller among women (p = .18).
In summary, occupational gender composition structures a meaningful portion of gay-straight and lesbian-straight segregation, though still only a minority (consistent with Tilcsik et al. 2015). In contrast, occupational gender segregation contributes very little to bisexual-straight segregation.
Question 3: Does Occupational Segregation by Sexual Orientation Differ by Education?
Consistent with past studies motivating this research question, higher education is more common for LGB than straight workers. As shown in Table 2, gay and lesbian workers are especially likely to have college degrees. Relative to straight workers of the same gender, the advantage in rates of higher education (bachelor’s or postgraduate) is greatest for gay men (17.3 percentage points), moderate for lesbian women and bisexual men (8.6 and 8.4 percentage points, respectively), and smallest for bisexual women (1.9 percentage points).
Occupational segregation by sexual orientation differs notably by education. Table 4 presents the Duncan segregation indexes by college degree attainment, along with bootstrapped 95 percent confidence intervals. Most notably, gay-straight occupational segregation is profoundly higher among non-college-educated men than college-educated men (p < .001). Lesbian-straight occupational segregation is also greater among non-college-educated women, but the difference is smaller and not statistically significant (p = .14). Conversely, bisexual-straight occupational segregation is greater among college-educated than less educated men and women. Neither difference is statistically significant, but the margins of error for bisexual-straight segregation are particularly large when splitting the sample by both gender and education.
Occupational Segregation Index between Each Sexual Minority Group and Straight-Identified Workers by Gender and College Degree Status, with 95% Confidence Intervals (in Parentheses).

Note: Higher segregation scores indicate greater segregation by sexual orientation across up to 94 occupation categories. The sample is limited to workers 25 to 64 years of age with information on all variables. All estimates apply National Health Interview Survey sampling weights. Confidence intervals are based on bootstrapped standard errors. GB = gay and bisexual men; LB = lesbian and bisexual women.
The association between occupational segregation by sexual orientation and occupational gender composition also differs by education. Among workers without college degrees in Table 4, residual gay-straight occupational segregation is 36 percent lower than observed segregation (p < .001), and residual lesbian-straight segregation is 31 percent lower (p < .001). Occupation % female accounts for smaller fractions of bisexual-straight segregation among men (15 percent) and women (6 percent) without college degrees, and the difference is statistically significant only among men.
In contrast, residual and observed occupational segregation are very similar among college-educated workers. The differences between observed and residual values are only statistically significant for GB-straight and gay-straight segregation among men. Even these differences are small in magnitude.
These patterns are not necessarily surprising, given that occupational gender segregation is also lower among more educated workers (Blau et al. 2013). Two additional comparisons demonstrate that the association between occupational gender composition is more relevant for less educated than more educated workers. First, occupational gender composition differs more strongly by sexual orientation among workers without college degrees than with college degrees. Figure A1 in Appendix A visualizes the distribution of occupation % female by gender, sexual orientation, and college degree status. Among workers without college degrees, straight men overwhelmingly concentrate in male-dominated occupations, while gay and, to a lesser extent, bisexual men avoid them. All three groups tend to hold more gender-integrated occupations among college-educated workers. The pattern is mirrored but less pronounced among women.
Second, occupational concentrations of LGB workers are more strongly correlated with occupation % female among non-college-educated than college-educated workers. As shown in Figure A2 in Appendix A, the concentration of lesbian women is moderately negatively correlated with occupation % female among workers without college degrees (r = –.53). However, the correlation is much weaker among college-educated women (r = –.14), and this difference is statistically significant (p < .001). Similarly, Figure A3 shows the positive correlations between occupation % female and concentrations of gay and bisexual men are stronger among those without college degrees (p = .06 for gay men, p < .05 for bisexual men).
In summary, lesbian-straight and especially gay-straight occupational segregation are stronger among workers without college degrees than workers with them. Bisexual-straight segregation is stronger among college-educated workers, but not statistically significantly so. Finally, occupational gender composition is strongly related to lesbian-straight and especially gay-straight segregation among workers without college degrees, but gender composition matters less for other groups.
Comparison with Partnership-Based Sexual Orientation
Partnership patterns differ notably by sexual orientation in the NHIS (Table 2), which may have implications for other studies using partnership-based measures. The majority of straight men and women are married or cohabiting, as are about half of lesbian workers. However, the majority of bisexual women and gay and bisexual men are not married or cohabiting. Almost no straight-identified workers report same-sex partners, and few lesbian/gay-identified workers report different-sex partners. However, different-sex partners are vastly more common than same-sex partners for bisexual workers. Using a partnership-based measure, very few bisexual workers would be included with lesbian/gay workers; bisexual workers would be much more commonly included with straight workers. These patterns also suggest that most LGB workers are excluded in data using partnership-based measures of sexual orientation.
Appendix B compares estimates of occupational segregation between the NHIS and ACS to assess any potential bias from the partnership-based measure. First, I compare estimated occupational segregation by gender (men/women) and race/ethnicity (non-Hispanic white/nonwhite) to establish baseline similarity between the surveys. Table B1 shows that estimated gender and racial/ethnic segregation are very similar between the surveys when using the 94 occupation categories in the NHIS and a comparable set of 99 categories in the ACS. However, both segregation estimates are higher in the ACS using 426 detailed occupations. These patterns suggest that occupational segregation by sexual orientation is underestimated in the NHIS because of its more limited set of occupation categories.
Second, I estimated occupational segregation by sexual orientation in the NHIS and ACS, replicating the partnership-based measure in the NHIS. Table B2 shows that occupational segregation in the NHIS is greater using the partnership-based measure compared with the results presented above. Estimated segregation in the ACS is greater using detailed occupation categories than using the more general occupational groupings. These patterns suggest that occupational segregation in the ACS may be slightly overstated by excluding unpartnered workers, while segregation in the NHIS may be slightly understated because of its limited set of occupation categories.
The results from the ACS also support the key patterns in the NHIS. 6 Occupational segregation by sexual orientation is greater among men than women. Segregation by sexual orientation is similar to or greater than segregation by race/ethnicity but smaller than segregation by gender. Segregation by sexual orientation is also greater among non-college-educated than college-educated workers, and this education difference is especially pronounced among men.
Conclusion
Occupations powerfully structure life chances (Weeden and Grusky 2005), and occupational segregation institutionalizes differences and inequalities between groups (Reskin et al. 1999). Past research has shown that LGB workers hold different occupations than straight workers, arguing that LGB workers seek occupations that would limit their potential exposure to discrimination and stigma (Badgett and King 1997; Baumle et al. 2009; Gorsuch 2019; Tilcsik et al. 2015). LGB workers tend to avoid occupations dominated by members of the same gender, reflecting the mutual construction of norms regarding gender and sexual orientation (Gorsuch 2019; Pedulla 2014; Tilcsik 2011). In this study I further examine the occupational segregation of LGB from straight workers and present several novel findings.
First, I disentangled the segregation of LGB workers from overall LGB segregation. Prior evidence from the census or ACS indirectly measured sexual orientation through same- or different-sex partnership, obscuring the distinction between lesbians/gay and bisexual workers. LGB workers concentrate in different occupations. Among men, bisexual-straight occupational segregation is weaker than gay-straight segregation. Occupational segregation by sexual orientation was weaker among women than men, and lesbian-straight and bisexual-straight segregation were of similar magnitudes. Conceptualizing sexual orientation as concealable stigma (Tilcsik et al. 2015), these patterns suggest that bisexual men may be more able to conceal or otherwise manage the disclosure of their sexual orientation or related stigma than gay men, particularly given their relatively high rates of different-sex partnership.
Second, occupational gender composition contributes differently to lesbian-straight, gay-straight, and bisexual-straight occupational segregation. The occupational concentrations of gay and lesbian workers are positively associated with the fraction of different-gender workers, but these associations were much weaker for bisexual workers. The proportion of women across occupations accounts for about one third of gay-straight segregation and one fifth of lesbian-straight segregation, but relatively little of bisexual-straight segregation. These patterns may reflect greater discrimination against gay workers by men than women (Gorsuch 2019) and in jobs seeking stereotypically masculine attributes (Tilcsik 2011). However, lesbian workers may not experience the same discrimination as gay workers for gender-nonconforming attributes (Gorsuch 2019). Again, bisexual workers may be less influenced by occupational gender composition if they have more concealable or otherwise less overt identities.
Relatively low bisexual-straight occupational segregation and weak overlap with occupational gender composition are puzzling given particularly large bisexual-straight disparities in employment (Carpenter and Eppink 2017) and earnings (Mize 2016; Sabia 2014) documented in prior studies. The patterns documented above suggest that bisexual workers may not avoid intolerant occupations as frequently as gay and lesbian workers. However, stereotypes that erase bisexual identities or equate them with personal choice can still be harmful both in the labor market and for general well-being (as argued by Mize 2016). Relatively large bisexual-straight employment and earnings disparities may even result from the greater exposure to straight workers in same-gender-dominated occupations found here, creating potential for discrimination. Further theory and research can interrogate how perceptions and stereotypes may shape bisexual-straight disparities differently for different labor market outcomes.
Third, I find that occupational segregation by sexual orientation differs substantially by education. Gay-straight segregation is much higher among workers without college degrees than workers with them, and lesbian-straight segregation is also somewhat higher among less educated workers. In contrast, bisexual-straight segregation is lower among less educated workers for men and women. Greater gay-straight and lesbian-straight segregation among less educated workers is due in large part to greater gender-segregation among less educated workers (Blau et al. 2013). Lower segregation among college-educated workers may also reflect more tolerant attitudes with higher education (Loftus 2001). Given the relatively low levels of segregation among more educated workers, high educational attainment for LGB compared with straight workers may be a strategy for avoiding discrimination and stigma. Greater segregation between bisexual and straight workers with higher education presents another puzzle, however.
This study’s strengths require some trade-offs. First, the NHIS’s occupation categories are unfortunately crude. Comparison with the ACS suggests occupational segregation may be slightly understated relative to a larger number of more detailed occupations. Second, the NHIS’s identity-based measure of sexual orientation may be sensitive to selection. For example, education may be greater among LGB workers than others because higher education creates more opportunities to form those identities. More generally, the data speak to patterns consistent or inconsistent with past theory but cannot directly test the mechanisms generating these patterns. Third, the NHIS does not truly measure gender identity. In addition to the direct importance of gender identity for labor market outcomes, discrimination on sexual orientation is intrinsically linked to gender. Data with more refined measures of gender identity could more precisely capture the theoretical processes driving these patterns of occupational segregation.
Despite these limitations, this study contributes to the growing empirical foundation for understanding how the occupational structure of the labor market differs by sexual orientation. This knowledge base is particularly crucial for systematically understanding stratification by sexual orientation and for informing the expansion of civil rights policies for equal opportunity in the labor market (Gates 2009). The U.S. Supreme Court recently ruled that LGBTQ+ workers are protected from employment discrimination by the Civil Rights Act. LGBTQ+ legal protections have rapidly progressed in recent years, but considerable occupational segregation by gender and race/ethnicity persist more than 50 years after passage of the Civil Rights Act. Future research can continue estimating occupational segregation by sexual orientation to track any subsequent trend toward integration.
Footnotes
Appendix A: Supplementary Results from the NHIS
Correlations between Occupational Composition Variables by Gender.

| Women (Nocc = 93) | % LB | % Lesbian | % Bisexual | % Female | % College |
|---|---|---|---|---|---|
| % LB | 1.00 | ||||
| % Lesbian | .85 | 1.00 | |||
| % Bisexual | .64 | .13 a | 1.00 | ||
| % Female | −.49 | −.43 | −.29 | 1.00 | |
| % College | −.08 a | −.17 | .09 a | .03 | 1.00 |
| Men (Nocc = 94) | % GB | % Gay | % Bisexual | % Female | % College |
| % GB | 1.00 | ||||
| % Gay | .98 | 1.00 | |||
| % Bisexual | .49 | .30 | 1.00 | ||
| % Female | .73 | .71 | .37 | 1.00 | |
| % College | −.43 | −.45 | −.12 a | −.39 | 1.00 |
Note: The sample is limited to workers 25 to 64 years of age with information on all variables. Occupation-level characteristics aggregate individual-level data to 94 occupation categories. Estimates calculated with National Health Interview Survey sampling weights. GB = gay and bisexual men; LB = lesbian and bisexual women.
Correlations that are not statistically significant. All other correlations are statistically significant at p < .05 using two-tailed p values calculated using bootstrapped standard errors.
Appendix B: Comparison of NHIS and ACS Results
Occupational Segregation Index between Sexual Minority and Straight Workers, with Sexual Minority Sample Sizes (in Parentheses).

| Total | Noncollege | College | |
|---|---|---|---|
| Women | |||
| NHIS LB total | .16 | .18 | .18 |
| (n = 1,688) | (n = 920) | (n = 768) | |
| NHIS Partnership Sample | .24 | .32 | .26 |
| (n = 450) | (n = 194) | (n = 256) | |
| ACS (99 occupations) | .17 | .19 | .16 |
| ACS (426 occupations) | .22 | .25 | .21 |
| (n = 7,162) | (n = 3,479) | (n = 3,683) | |
| Men | |||
| NHIS GB total | .25 | .29 | .20 |
| (n = 1,582) | (n = 802) | (n = 780) | |
| NHIS Partnership Sample | .40 | .55 | .29 |
| (n = 376) | (n = 156) | (n = 220) | |
| ACS (99 occupations) | .31 | .37 | .17 |
| ACS (426 occupations) | .35 | .41 | .24 |
| (n = 7,369) | (n = 3,324) | (n = 4,045) | |
Note: Higher segregation scores indicate greater segregation by sexual orientation. The samples are limited to workers 25 to 64 years of age with information on all variables. The NHIS Partnership Sample and ACS compare workers in same-sex and different-sex partnerships, excluding unpartnered workers. All estimates apply NHIS or ACS sampling weights. ACS = American Community Survey; GB = self-identified gay and bisexual men; LB = self-identified lesbian and bisexual women; NHIS = National Health Interview Survey.
Acknowledgements
I thank David Orzechowicz, Jacob Hibel, the anonymous reviewers, and the editors for helpful suggestions.
1
I use “LGB” to refer to evidence grouping all LGB people relative to straight (heterosexual) people or using same-sex relative to different-sex partnership to indirectly measure orientation. I use “LB” when referring to lesbian and bisexual women being grouped together and “GB” for gay and bisexual men grouped together. I write out lesbian, gay, and bisexual when referring to group-specific results.
2
3
I use “occupation % female” rather than “% women” to follow convention in past research on occupational segregation, but I interpret the variable as occupational “gender” composition.
4
Results were very similar using the z-score formula
5
6
Estimated segregation is still notably greater in the NHIS than the ACS, even when constructed to be as similar as possible (i.e., partnership-based measure of sexual orientation and 94 or 99 occupation groupings). The discrepancy may be driven by the NHIS’s particularly limited sample sizes using the partnership-based measure.