
Abstract
This study addresses inequality through resource distribution in Iranian provinces with the use of new data collected and compiled from various sources using multilevel modeling. The models compare predictions of the various resource distribution theories using Iran’s 31 provincial budgets over 10 years. This resource distribution study provides a rare look at inequality in a country that, to a large degree, prohibits such examinations. The authors find that although ethnicity, religiosity, and allegiance to the regime have no influence on provincial budgets, geographic proximity to the central government is the strongest and only consistent predictor of resource allocation. The authors find that the greater the distance from the capital, the larger the respective per capita budget, net of other factors. This study contradicts both the centrality theory of state economic distribution and specific Iranian economic distribution theory and provides a new body of knowledge on state resource distribution.
The ongoing Iranian economic crisis of 2017 and 2018, often cited in international media (Brennan 2018), is nothing new to the Iranian people. Iran is a country with vivid memories of great instability over the lifetime of most of its current citizens. The older generations still invoke the memory of the 1953 coup orchestrated by the United States and the Islamic Revolution that brought down the shah’s regime in 1979 (Kurzman 2004). The younger generations recall the Persian Awakening or Green Movement of the 2009 Iranian presidential election and the “Day of Rage” of February 2011 in the wake of the Arab Spring. The dissatisfaction that has created this ongoing instability has most recently concerned the strict Islamic rules of the clerical regime, a weak economy, water shortages, and a desire for a different future (Erdbrink 2018). Despite an earlier attempt by President Ahmadinejad to assuage the economic concerns of the population in 2010 with a subsidy reform program that provided each Iranian family roughly $90 over two months for increases in the cost of bread and energy, inequality continues to pervade in Iran, feeding the frustration of the disenfranchised (Salehi-Isfahani 2011). In a nation ruled by clerics, this inequality has overtones of religion and allegiance to the Islamic theocratic principles that guide the country. The large areas with a predominance of members of one culture, such as the Kurds, Turks, Arabs, and Baluch, suggest an ethnic divide as well. Finally, as a result of reforms under Reza Shah in the 1920s and 1930s, a mass movement occurred from the rural, agriculturally focused areas of Iran to the more urban centers. These movements, together with the isolating geography of the Iranian deserts and mountains and the insecurities along the borders, have created less developed zones in Iran (Hosseini and Rahbar 2012). Many Iranian economists believe that the provincial budgets provided by the central government are the best tools to influence these less developed zones on the periphery of Iran (Bakhtiyari, Zadeh, and Hussienpour 2010; Hosseini and Rahbar 2012).
An important component of Iranis’ perceptions of inequality is that provincial budgets are unfairly allocated by the central government in Tehran. As Mahdavi (2014) noted, provincial governors have very little control over their finances, receiving the bulk of their provincial budget from the Majlis, the Iranian legislative body. However, bias in the Iranian state’s distribution of resources, a major concern with the previous government’s issues of corruption under the shah, would contradict the current 48th article of the Constitution of the Islamic Republic of Iran. The 48th article prohibits discrimination in the use of national revenues in the provinces, “thereby ensuring that every region has access to the necessary capital and facilities in accordance with its needs and capacity for growth.”
Despite this prohibition, a growing perception within Iranian society exists of a disparity among certain minority groups suggesting that such an inequality in resource distribution does in fact exists (Horowitz 1985). Popular opinion that the clerical scholars in Iran, through jurisprudence, reward their most loyal followers is consistent with Weber’s (1978) explanation in Economy and Society of patrimonial domination, a state in which legitimacy and power are “guaranteed by personal subjection.” By virtue of this patronage distinction, the state will distribute resources to its loyal supporters rather than to those who are critical of the regime (Bartels 1985; Bratton and van de Walle 1997). In this article, we use new data to investigate whether budgets are allocated equally in Iran and the extent to which various resource distribution theories successfully predict any inequality in distribution. We also investigate whether the less developed areas of Iran around the periphery are over- or underbudgeted per capita relative to the rest of the provinces in the country.
Background
A lack of research on religious governments by social scientists exists (Waskey 2007), and it is mirrored by the lack of study of state resource distribution in the Middle East (Anselmi, Lagarde, and Hanson 2015). Both gaps are puzzling in that poverty, lack of opportunity, and power vacuums are often cited in public and academic discourse as causes of radicalization and turmoil in the Middle East (Wimmer 2013). Indeed, as this article was in process, the ongoing crisis in Iran continued, with major protests raging in 19 cities over rising food prices and government corruption (Dewan and McKirdy 2018). Resource distribution, therefore, is an important matter to consider when examining state processes, whether in a theocracy or democracy, as it is the “grease” that allows the state machinery to function.
Movements such as Islamism may affect this grease, causing the state machinery to falter or adapt to new efficiencies, and so studying resource distribution can help understand state priorities, intentions, and bias. Saudi Arabia, for example, has had to coopt the Islamist movement over decades to maintain its monarchical control of resource distribution (Al-Atawneh 2009). It is in this examination of resource distribution that one can move beyond political rhetoric and signaling to determine state motives and the existence of bias and inequality (Gheissari 2009). States in which resource distribution is highly inefficient, whether from corruption, political clientelism, or ineptitude, have historically had more occasions for political interruptions in the form of revolutions and unrest. In countries that have notoriously opaque government processes, studies of the results of fiscal spending can often bring sunlight to obscure activities. Thus, investigating Iran’s fiscal allotments may help improve our theoretical understanding of the causes and consequences of resource distribution. The first step in exploring the possible causes is to briefly explain the complexity of the Iranian budgeting process and why it can be problematic to investigate.
The Iranian Budgeting Process
Iran’s budgetary process is not a simple one but one that involves numerous stages and actors over a long period of time. There is a central government budget spent on eight main areas: general affairs, national defense, social affairs, economic affairs, Jahad-e Sazandegi (the Engineering Research Center, similar to the U.S. Army Corps of Engineers), miscellaneous expenses, interest on loans, and debt and prepayments. There is a separate budget that is distributed to the provinces for four of these categories: (1) general affairs, which includes law enforcement, mass communications, public buildings, and the administration of the work force; (2) social affairs such as public education, culture, social security, urban development, and rural development; (3) economic affairs for water, electricity, manufacturing, gas, oil, mining, roads, and tourism; and finally (4) defense and security affairs. This budget is developed through a number of steps, passing through several governmental entities before final approval in the Majlis. In a recent budget process primer produced by an external group for accountability of elections and local Iranian government (Nabz Iran 2014), the basic procedures for the creation of the budget begins when the president submits a budget to the Majlis by December 6 each year. The Majlis have 10 days to review the budget and then provide their recommendations to the Expert Committee, a special group within the Majlis that focuses on key areas of health, education, defense, and security. The Expert Committee then has 15 days to provide its report to the Compilation Committee. The Compilation Committee reviews the report and provides a final assessment back to the Majlis General Assembly, where only recommendations from the Compilation Committee can be debated. There must be an agreement of two thirds of the General Assembly to move the budget on to an allocation part of the process. The General Assembly will debate the allocation recommendations in the report, item by item, with two-thirds approval necessary to proceed. The budget then proceeds to the Guardian Council for ratification after assessing its compliance with Islamic law and the constitution. Any irreconcilable differences between the Guardian Council and Majlis are sent to the Expediency Discernment Council for final arbitration. The budget is then signed into law by the speaker of the Majlis and sent to the president for implementation.
On one hand, the complexity of this budgeting process seems to imply that there are numerous “checks” that would prevent unfairness or inequality from arising. However, a special “Did you know?” box within the budget process primer notes, “The amount of funds that your province receives is influenced in part by bargaining among the Majlis representatives, as well as the nature of the relationship between Majlis members and your provincial officials” (Nabz Iran 2014). It is in these procedures, with the lobbying efforts mentioned above, that influence and inequality may arise (Boroujerdi 2014). Any patronage found in provincial budgets is most likely due to several of these groups—the Majlis, the Expert Committee, the Compilation Committee, and the Guardian Council—acting in a biased manner at any one of several points in the process.
The existence of bias within the process would be unsurprising. The Iranian regime often mitigates opposition by tightly controlling the presidential and legislative candidates to be considered, ruling most of the registered candidates as “un-Islamic” and disqualifying them from the ballot (Buchta 2000). This bias would also be consistent with predictions implicit in several the theories found in the literature on resource distribution.
Resource Distribution Theory
Resource distribution theory encompasses a wide swath of literature that varies in the size of units investigated, including small intrahousehold distributional theory, larger organizational distribution theories such as with universities or public local entities, and macro-level national and international economic theories. For the most part, factors that influence distribution in complex organizations such as countries are different than those affecting small units such as families (Kaufman 1974). A common thread found across large and small organizations, however, is that there is an expectation that the allocation of resources will be equitable among its members (Arrow 1969).
In this study we investigate potential sources of inequitable distribution of resources in Iran, appealing to, and testing, three subsections of this theory: (1) political clientelism, which focuses on the political process and its interaction with the distribution of public goods (Heeger 1974; Weber 1978; Theobald 1982; Chehabi 1997; Franck and Rainer 2012; Kaiser 2007; Kimenyi 2006; Persico, Rodríguez-Pueblita, and Silverman 2011); (2) public choice theory of governance, which focuses on the self-interest of the state and citizen; and (3) core-periphery theory, which focuses on the unequal distribution of resources in large organizations and countries on the basis of the proximity to their core (Ashar and Shapiro 1988; Bakhtiyari et al. 2006; Krugman 1991).
Political clientelism—also called political patronage or patrimonialism—is an important part of resource distribution literature, in that with national resource distribution, there can be patterns of asymmetric patron-client relationships, and these relationships are durable (Lemarchand and Legg 1972). Indeed, as noted by Heeger (1974), patrimonialism in new states is often provided by the leadership to various factions to retain their support (Theobald 1982). Heeger saw this apportioning process constructed in the administrative functions of governing. It is considered a “necessary evil” to provide for the patron-client relationship of major state actors. Lemarchand and Legg (1972) defined it as a reciprocal relationship between two entities of unequal resources that allows mutually beneficial process a quid pro quo.
These authors built on Weber’s (1978) position that, in contrast to rational bureaucracies that govern with impersonal rules and fixed apportionments of resources, patrimonial states provide inconsistent distribution of resources at the whims of the ruler on the basis of an ill-defined rationale. As bureaucracies mature, stability forms in the patron-client distributive relationship. It is not hard to imagine the relatively new Islamic Republic of Iran is in the early stages of the patrimonial apportionment that Weber and the other authors described.
Public choice theory of governance suggests that states act in their own self-interest, requiring corrective action in the distribution of goods to support constituency groups and prevent market failure (Olson 2002). Tullock (2008) noted that government’s self-interest necessitates economic tools that will correct for bureaucratic inefficiencies. An example of these tools is “vote trading,” in which a politician supports another’s legislation to get support on his or her special issue(s). Vote trading, special interests, and “pork barrel” spending are political tools that exacerbate in-group and out-group problems in an attempt to provide bureaucratic efficiency. This by-product can also be found in ethnic, religious, political, and social enclaves. Kimenyi (2006) applied this theory in African states to demonstrate that the distribution of public goods follows ethnic fractionalization. He found that ethnic heterogeneity, which is substantial in many African countries, yields unequal distribution of resources. States use public goods to support their own self-interest in the form of their favored ethnic clients. Franck and Rainer (2012) also found that ethnic favoritism was prevalent in their study of 18 countries in Africa, in both education levels and infant mortality rates. Franck and Rainer and and Kimenyi argued that the element of ethnicity is an important factor in this region largely because of the ethnic diversity found. This subtheory of political clientelism can also be tested well in Iran, which hosts a majority 51 percent Persian ethnic group as well as seven other distinct ethnic groups: Kurds, Azeris, Mazandaranis, Arabs, Lurs, Baluch, and Turkmen (Amanolahi 2005; Sanasarian 2000, 2013). These groups are similar in societal positions to those found in Franck and Rainer’s and Kimenyi’s studies.
Many Iranian economists subscribe to a version of core-periphery theory, in which concentrations of manufacturing and agriculture determine patterns of migration focused on a central geographic hub with less valued elements on the periphery (Krugman 1991). Krugman (1991) noted that because of land constraints on agricultural production, economies of scale are difficult to achieve relative to what is possible in manufacturing. The interaction between agricultural and manufacturing markets creates concentrations that eventually establish core-periphery relationships between larger cities and markets at the core and rural and agricultural areas at the periphery. In Iran, a massive demographic shift occurred following the modernization of Reza Shah in the 1920s and 1930s that makes this core-periphery pattern particularly important. Many Iranian economists working in Iran believe that spatial proximity to the capital of Iran, Tehran, is the greatest influence on provincial revenue, education, and even life expectancy, exceeding any influence from religion, ethnicity, or regime loyalty (Bakhtiyari et al. 2006).
Consistent with this perspective, Hosseini and Kaneko (2012) found significant influence of spatial distance from Tehran on provincial budgets while controlling for oil market fluctuation, population density, province size, and other external factors. Hosseini and Kaneko examined these factors between 2000 and 2007 and found the distance of the province from the capital was negatively related to its respective budget. Hosseini and Kaneko’s examination, however, did not consider any elements of the other major theories of resource distribution such political clientelism or public choice theory. Doing so would have required the inclusion of other internal factors such as ethnicity and religion in their study, which may have confounded the importance of core-periphery issues. Likewise, many of the economic studies in Iran regarding this subject focused primarily on the core-periphery theory.
As with public choice theory, the state’s self-interest supersedes that of the periphery. Concentrating the bulk of power and economic resources close to a centrally located capital is a concept seen in many countries and empires throughout history (Centeno and Enriquez 2010). Political patronage and public choice theories suggest resource distribution is based on a proclivity to a certain group, whether it be religious, ethnic, or simply regime loyalty (Brender and Drazen 2005). The core-periphery proximity theory would expect influence on the basis of geographic distance to the capital in which distance from the capital has a negative relationship on resource distribution.
Hypotheses
Predictions of political clientelism, public choice, and core-periphery theories, substantiated in other political system, can also be tested in Iran’s provincial budgeting process. Given that Iran is a theocracy with greater ethnic diversity than many countries in the region, it would not be unreasonable to suspect that either or both ethnic heterogeneity and religiosity could influence decisions on budget distributions. Although there may not be formal ethnic or religious parties in Iran, as the government would and has prevented such groups in the past, there are still strong undercurrents of dissatisfaction found with peripheral ethnic classes such as the Baluch and Kurds as well as secularists and those whose religiosity might not rise to the levels of the clerics. Testing these theories along these subtle ethnic and religious lines has not been done in Iran, as it would involve a critical analysis of Iranian society that the government does not condone. Political allegiance as well as the historic core-periphery pattern that existed under the Persian Empire may also be important in affecting budget distributions. Specific to patrimonialism theory, the initial hypothesis for this study is that greater religious participation positively and significantly influences the per capita budget received by the province. This hypothesis stems from political clientelism and interest-group theories discussed earlier. Testing this hypothesis in a theocracy such as Iran can really be done only at institutions outside of the country because of the sensitivity of the topics. The fact that ethnic and religious political parties are nonexistent in Iran provides a very nuanced example of how political clientelism could function even without formal political groups but rather at the individual level by those in the budgetary process.
The second hypothesis, that greater ethnic heterogeneity positively influences per capita budgets, similarly stems from political clientelism and interest-group theories. A third hypothesis can also be derived from these theories, namely, that greater provincial votes for conservative candidates in previous elections, used as a proxy for clientelism, positively influence per capita budgets received by the provinces. Our final hypothesis stems from core-periphery theory. Specifically, smaller distances between the provincial capital and Tehran positively influences per capita budgets received as the theory suggests that the closer an entity is to the center, the more resources it should have (Centeno and Enriquez 2010). These four hypotheses represent the key expected sources for inequality in resource distribution in Iran.
Analytic Strategy
Data Sources
The major challenge for any research on Iran is often simply obtaining data. The transition of the state from a monarchy that was moving toward modernization to an Islamic republic that remains notoriously opaque problematizes any representative analyses. The key variables needed for this study were not available from any central resource or previous study; therefore, over the course of two years, the first author compiled information from numerous government documents and publications with the help of a team of five Iranian research assistants. Most of the information obtained is not readily available. It therefore represents a new collection of data on the topic (see Appendix A).
Outcome Variable
The outcome of interest was the approved per capita budget for each province (31) per year from 2005 to 2014 (10 years). Obtaining these data required extensive effort, as there was no single repository for provincial budgets for the years from 2005 to 2013. As indicated in Appendix D, the sources for provincial budget data included the Web site for the Iranian Majlis, microfiche from editions of the Iranian Statistical Yearbook, the Iranian Expediency Discernment Council’s Web site, the Budget Planning Institute, Ministry of Economic Affairs and Finance publications, and the Agriculture-Jahad Ministry Web site. Each of these sources had partial data for the years considered, but none had data for all years. These sources were also exclusively in Persian, requiring native expertise to translate the data.
Often two budgets are listed for each province in Iran in government documents: a realized budget, representing what the provinces actually use (and need), and an approved budget from the Majlis, which was what they were allowed to spend. The realized budget included not only what a province received from Tehran but also what it received from other internal sources. For the purposes of this study, the approved budget was used, as it was the best reflection of the state’s resource distribution to the provinces. Since 2010, the budgets have been broken down into subcategories of spending and recorded in the annual Statistical Yearbook. Prior to 2010, however, the Islamic Parliament Research Center had very poor reporting of its figures. Rather than using grossly inconsistent economic data, we used total provincial budget data. Although this did not account for minor changes in one of the four budgetary categories described above, it does capture large differences over time in each province and large differences among provinces. Although using the total provincial budget does not enable a complete understanding of the differences in spending on roads and tourism in Bushehr Province, for example, it does capture any large budgetary shifts in the province over time and how the province compare with other provinces of Iran. We coded budgets as the proportion of the total state outlay allocated to each province per capita, that is, divided by the number of persons in the province. Although there are recent detailed data for how these budgets are spent by provinces, such as for law enforcement, public buildings and installations, administration of the work force, public education, culture and arts, and urban development, to name just a few, those data are not fully available for the earlier years of this study. This presents a limitation of the research in that the budgets used are grouped together, with limited ability to determine if internal fluctuations in expenditures for infrastructure were a factor in the variation in the overall provincial budgets. Ultimately, the Iranian research assistants for this project spent approximately 200 total hours collecting this information from the various sources, all of which is now posted on the Iran Social Science Data Portal, hosted originally by Princeton University and now by Syracuse University. The unit of analysis for the study is the province-year, with 310 possible province-year records. However, there were a few instances of incomplete budget data for several of the 31 provinces over the 10-year period, yielding an analytic sample of 302 records.
To produce per capita budget data, population counts were required. The data for population counts were obtained from the Iranian National Population and Housing Census, which is typically produced every 10 years (1976, 1986, 1996, and 2006), as well as the Web site for the Statistical Center of Iran. Population counts were imputed for intervening years using simple demographic interpolation: pt = p0ert, where pt is the population at time t, p0 is the base population, t is the number of years between 0 and t, and r is the annual growth rate computed from the start and end of the [0, t] interval. These population counts were also used in some analyses to standardize province-specific covariates (see below). For the sake of yielding model coefficients that are not miniscule decimals, we rescaled the outcome to be in 10,000 rial units.
Covariates
The key covariates used in this study are ethnicity, religiosity, allegiance to the regime in power, distance from Tehran, the length of roads in each province, an indicator of whether the province has a large water border, and the number of countries the province borders. These latter measures of infrastructure and geography are include to control for potential province-specific financial needs that may produce disproportionate allocation.
By far, ethnicity and religiosity were the two most difficult variables to obtain. After months of searching and with the help of the Economics Department of the University of Tehran, the first author discovered an individual-level survey that included four years of data (2010–2013) on ethnicity and religious participation. One of the only four copies made of the survey was found at the Parke Shahr Public Library in Tehran. Data from the survey, titled “The Measured Indicators of Public Culture,” were compiled from copies of hundreds of documents and tables and were sent by mail to be reassembled and examined by Iranian research assistants hired for this study.
The difficulty in finding ethnicity data in Iran cannot be overstated. Iran is one of the few countries in the world that does not record ethnicity in its national, regional, or municipal censuses. The Islamic Republic views ethnic nepotism as a potential catalyst for dissent and is disinterested in any public dissemination of its composition (Elling 2013).
The survey found in the Parke Shahr Public Library in Tehran, in addition to including a survey question on ethnicity, also queried participants on religious participation. Appendix B provides the procedure for how the survey was conducted in each province. The sample sizes ranged from 500 to 650 respondents in each province, as indicated in Appendix C, yielding approximately 17,000 interviews.
Data for measuring allegiance to the current regime was obtained from a table of presidential election figures for the years considered. Some of the voting data were already available on one of the largest academic portals of Iranian research. However, it was also necessary to obtain voting records by province for each candidate. These data were available only for the 2009 elections and beyond. Prior to that, data for 2005 were obtained from a fellow Iranian studies researcher after many months of query within the Iranian scholar community.
Data for measuring geographic and infrastructure characteristics were relatively easy to obtain from Iran’s Ministry of Roads and Urban Development as well as from atlases and maps.
Covariate Measurement
Ethnicity
Persian is the dominant ethnicity in Iran, especially in Tehran and in the Parliament. Respondents report numerous other ethnicities in the “Measured Indicators of Public Culture” survey, including Kurdish, Turkish, and Arab, among others. For our analyses, ethnicity is measured as the proportion of each province in each year that is Persian multiplied by the proportion that is not Persian. This quantity is maximized when Persian and non-Persian ethnicities are balanced. As discussed earlier, ethnic heterogeneity may be a better measure than raw ethnic percentages, because there may be less tendency for one majority group to influence the process on the basis of ethnic priority (see Posner 2004). The data for ethnicity had some inconsistencies over several years in several provinces that can attributed to the difficulty of collecting ethnic information in Iran as well as the less than perfect sample sizes used in the survey for each province. This irregularity was found in several provinces, and we addressed it in several ways in the analyses, as discussed below.
Religiosity
The survey asked, “How often do you attend religious services?” with categories of responses as follows: 1 = every week, 2 = two or three times per month, 3 = once per month, 4 = less than once per month, 5 = only on special days, 6 = never, and 7 = don’t know/didn’t answer. We created two measures. For one, the measure was kept as ordinal. For the other, responses were coded on the basis of the number of times per year a respondent is expected to attend religious services. Those who attend religious services each week received a value of 52. Those who attend two to three times a month received a value of 30 (the midpoint between 24 and 36 times). Those who attend once per month received a value of 12. Those who attend less than once a month were issued a value of 6 (the midpoint between 0 and 12), and those who attend only on special occasions were assigned a value of 4 (as there are traditionally four special occasions per year in Iran). For both measures, those who were missing (value of 7) were coded to the middle of the range. There was minimal missingness on this item, however (<3 percent), and the results of analyses were robust to alternative approaches to imputing the missing responses. A provincial-level measure for religiosity was constructed by averaging individual level responses across all residents of each province. Results using both the ordinal and interval level measure were nearly identical; thus, we report results using the ordinal measure only.
Measures of ethnic heterogeneity and religious participation were almost perfectly stable over time, so we coded these measures as constant for each province for the period of this study, 2005 to 2014.
Allegiance
Allegiance to the current regime was measured as the percentage of respondents in a province during a given election who voted for conservative candidates who fully support the government. The other group of candidates, labeled in Iran as reformists, often has some degree of dissatisfaction with the status quo. Voters certainly can have different levels of dissatisfaction with their government. This does not suggest that voting for a reformist candidate is the equivalent of seeking total regime change; however, it does convey some level of dissatisfaction with the current state structure and underlines a level of desire for a different outcome.
Political allegiance values by province were calculated as the proportion of voters who voted for reformist candidates. If there were multiple reformist candidates, their votes were pooled. The method used to measure allegiance in nonvoting years was to take the last election value and carry it forward until the next election (i.e., the last observation carried forward [LOCF] method). Results obtained using LOCF were not substantially different from those obtained using linear interpolation instead.
Infrastructure
Larger provinces and/or those with greater population densities may have a greater need for larger per capita budgets than smaller provinces to support infrastructure and services, and provinces farther away from Tehran tend to be larger than central provinces. Thus, data on total road length (highways and major roads) were included, both in raw form and standardized per capita. Additionally, we included measures for the number of countries bordered by each province as well as an indicator for whether a province bordered the Persian Gulf or Caspian Sea to control for additional financial needs that may produce budget disparities, such as security threats. Models with and without these controls yielded nearly identical results.
Table 1 shows the years for which all variables were available, the data characteristics, and a summary of how data were coded for years in which data were not available. Of note in the data is that province budgets across all provinces experienced a dip in 2008 and 2009. This most likely has to do with the onset of international sanctions that significantly started in 2007 and early 2008.
Measure Characteristics by Year.

Note: Data are expressed as mean (SD) [range].
Available for all years.
Available for 2010 to 2013. Treated as time constant on the basis of means of data in observed years.
Elections were held in 2005, 2009, and 2013. Last observation was carried forward.
Available for 2006 and 2013. Remaining years were imputed using standard demographic calculations.
Methods
Random-effects methods were used for the analyses. Specifically, we used random intercept models with robust-clustered standard errors (see Allison 2009). The general model is:
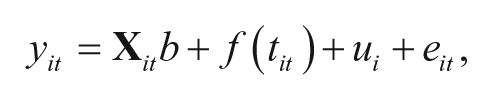
where yit is the allocated per capita budget (in $10,000 rials) for province i in year t;
Results
Table 2 presents the results of eight random-effects models. In each model, the outcome is the annual per capita province budget; models differ in the predictors that are included. The eight models differ with respect to measures of infrastructure that are included and with the inclusion or exclusion of an indicator (a “flag”) for provinces with potentially unreliable measures for ethnicity in some years (models 5–8), on the basis of ethnic heterogeneity measures that varied substantially from one survey wave to another. The four infrastructure measures include the area of the province per capita, the length of highways per capita, the length of roads per capita, and finally the length of all roads in the province per capita. Models were also estimated (not shown in table) that included non-population-adjusted measures of these infrastructure measures. Given that none of these is a complete or ideal measure of infrastructure needs, we included each in separate models as a sensitivity test. In all models, fixed effects are included for each year only to capture nonlinear annual fluctuation in budgets due to changes in national-level economic conditions. The other key predictors of interest included are the ethnic composition, religiosity, allegiance to the ruling regime, and distance from Tehran.
Results of Random-Effects Models of per Capita Provincial Budgets with Fixed Effects for Year.
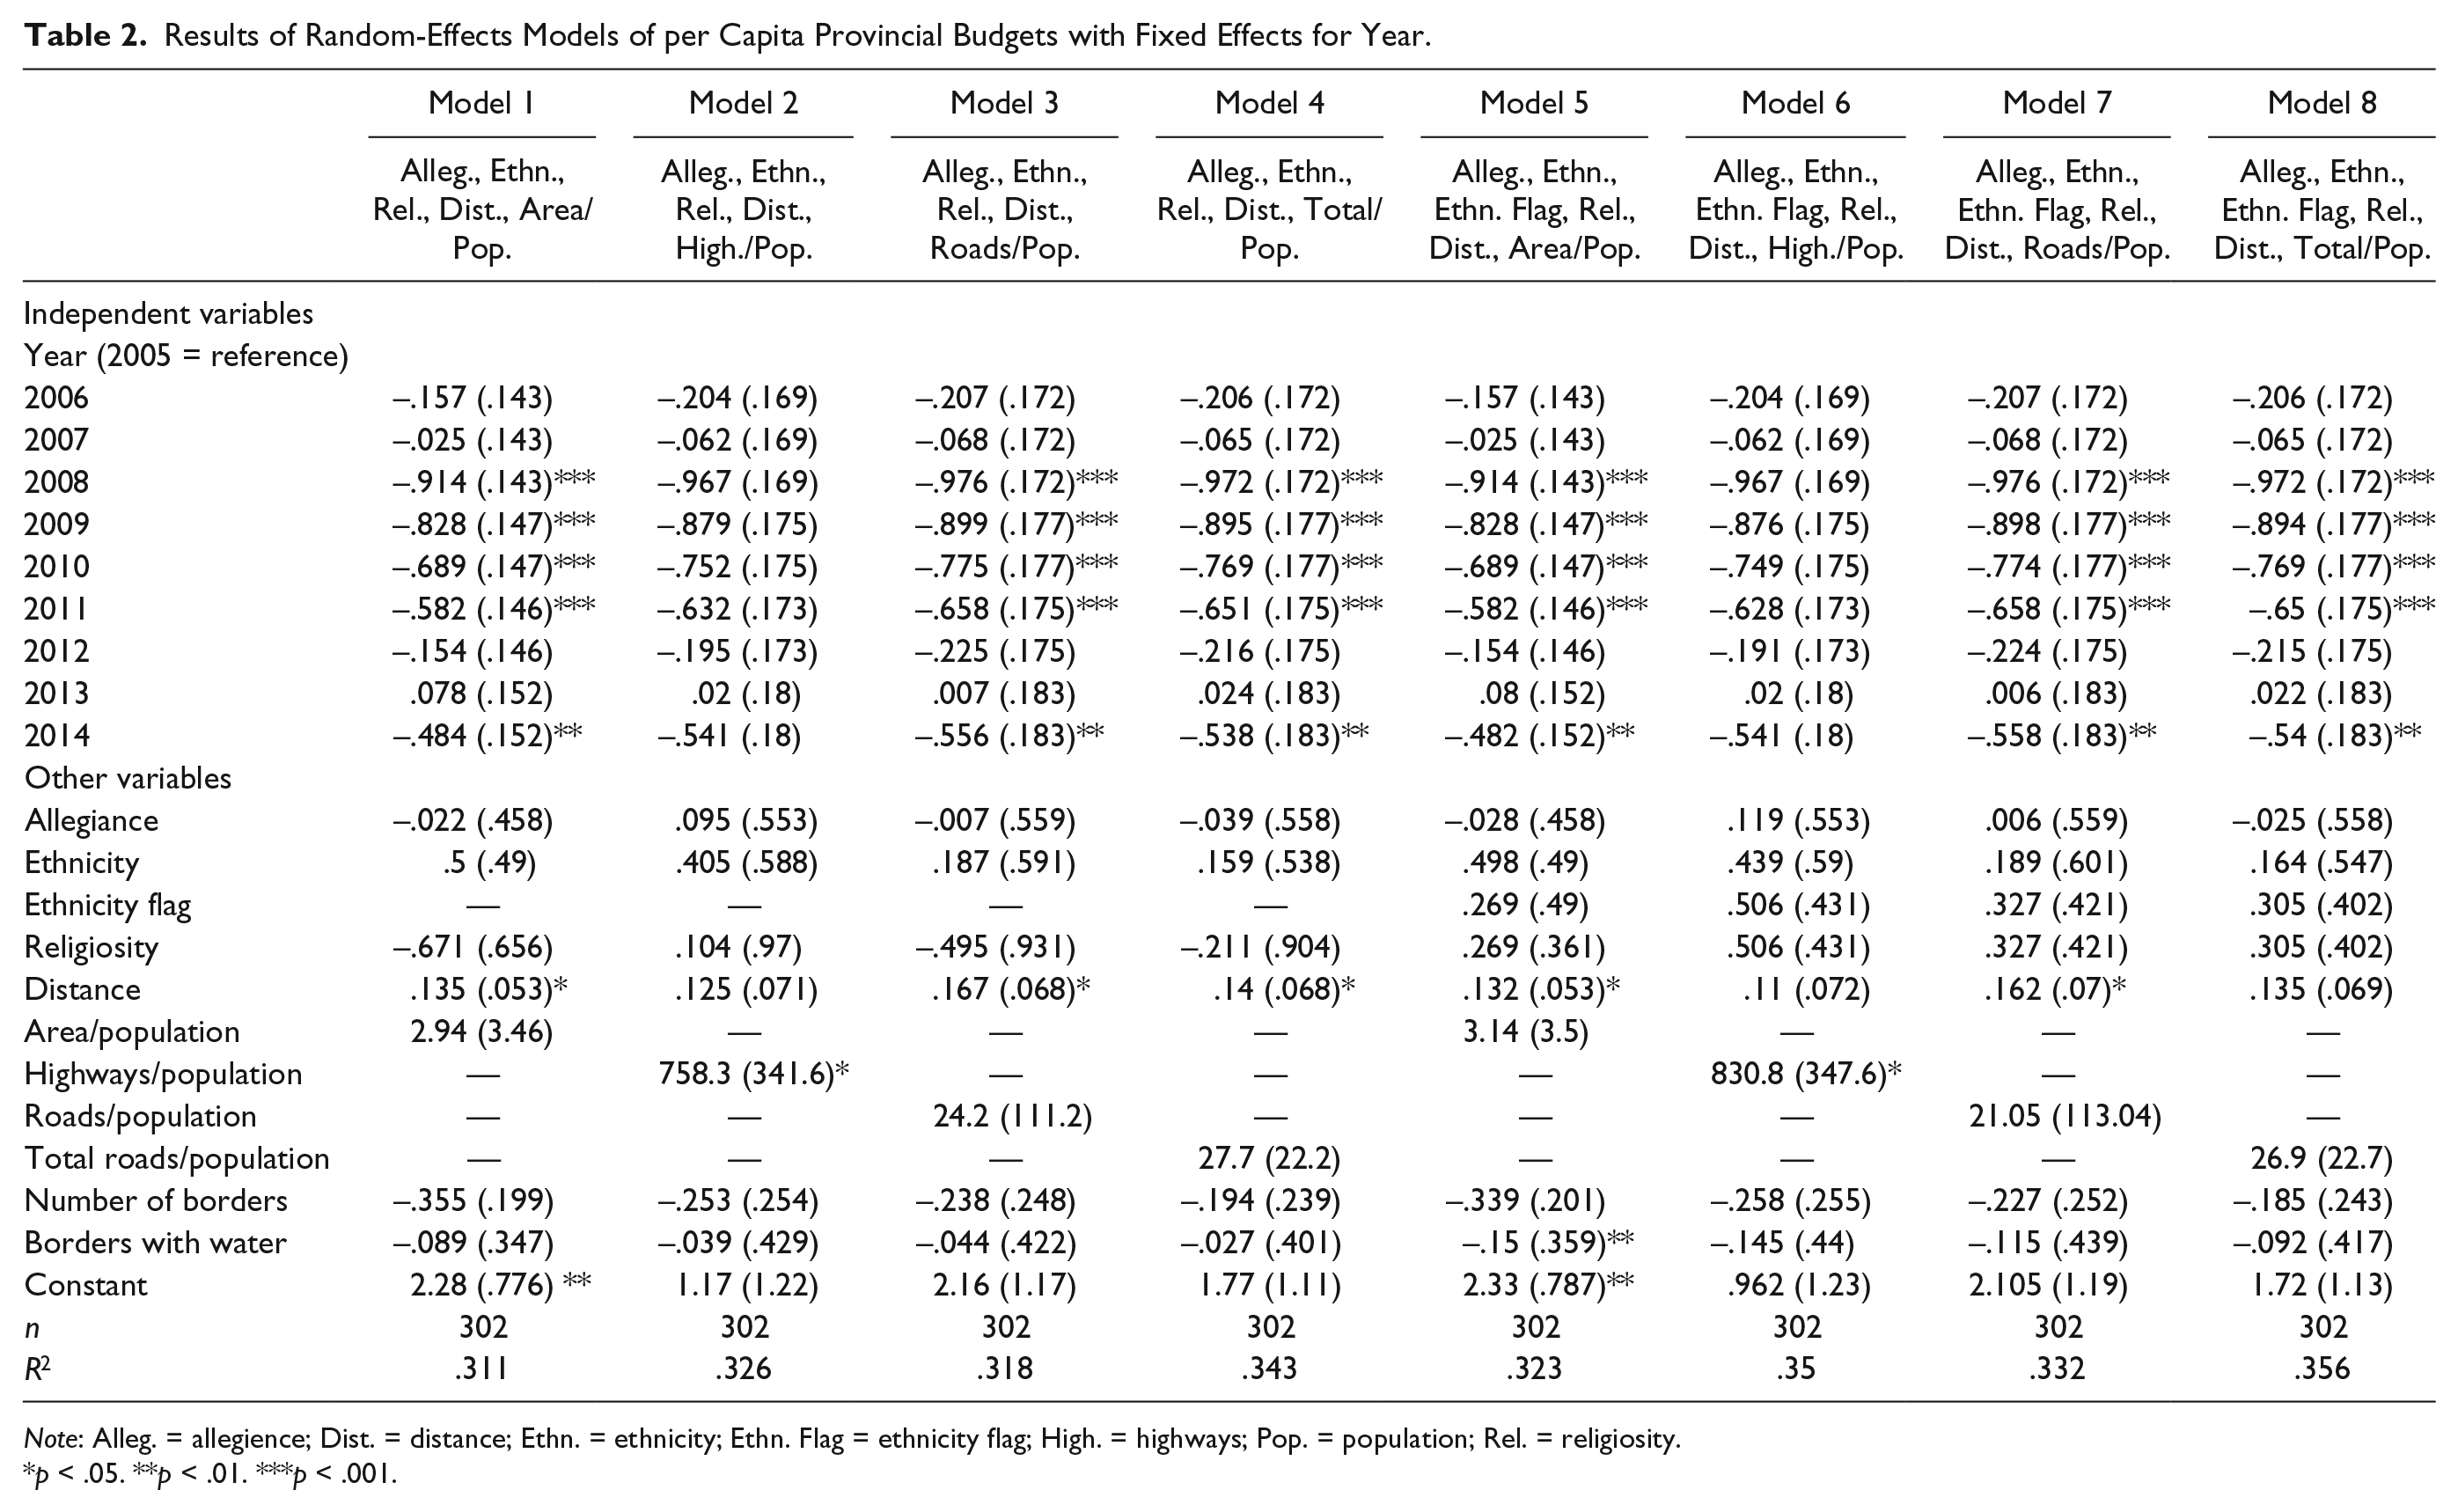
Note: Alleg. = allegience; Dist. = distance; Ethn. = ethnicity; Ethn. Flag = ethnicity flag; High. = highways; Pop. = population; Rel. = religiosity.
p < .05. **p < .01. ***p < .001.
In model 1, the coefficients for 2005 to 2007 are negative and significant, indicating that there was a nationwide decline in the Iranian budget during these years, relative to earlier and later years. Of the other variables in the model, only distance from the capital emerged as statistically significant, and its coefficient is positive (b = .135, p < .05), indicating that outlying provinces receive higher outlays than provinces closer to Tehran.
In model 2, length of highways replaces area as the measure of infrastructure. In that model, in addition to the middle year indicators, only highway length is statistically significant. The coefficient for distance from Tehran remains positive but is no longer statistically significant at the p < .05 level. It is statistically significant at the p < .10 level, however. In model 3, total road length replaces highway length as the infrastructure measure, and the coefficient for distance from Tehran is again statistically significant (b = .167, p < .05). The model 4 results tell the same story (coefficient for distance = .14, p < .05).
The remaining models replicate the results of models 1 to 4 but include a “flag” indicator variable for province-year records with measures of ethnicity that are potentially unreliable. That is, for some provinces in some years, the ethnic heterogeneity measure obtained from our survey data is substantially different from those in other years for the same province. The results of those remaining models, however, are nearly identical to those obtained in models 1 to 4. Specifically, aside from the significance of the year indicators for the middle years of the observed period, the coefficient for distance is the only one to obtain significance in most models. The one exception is in model 8, in which the coefficient is not significant but nearly is (t = 1.956). Years 2005 through 2007 were found with a consistent U-shaped pattern for ethnicity across all provinces, which is most likely the source of the significant coefficient findings for those specific years across six of the eight models.
Additional analyses were conducted by estimating models in which we systematically excluded each province. In general, the results do not change substantially when provinces are omitted. Several of the year coefficients change when Khuzestan is omitted, but none of the coefficients for the key variables of interest change to a significant degree. Overall, when a variable has a nonsignificant coefficient, the coefficient is always nonsignificant, no matter which province is excluded. The only exceptions are for the roads per population measure, which is significant only when Mazandaran is excluded, and distance from Tehran, which is significant except when Fars, Khuzestan, West Azerbaijan, Mazandaran, Kerman, Alborz, Kermanshah, Golestan, Hormozgan, Qazvin, Chaharmahaal/Bakhtiari, or South Khorasan is excluded. Given the relatively small sample size, if the p < .10 threshold is used for significance, distance still remains significant in all models.
In sum, the results indicate that budget outlays were generally U-shaped from 2005 to 2014, with a dip in the middle years and in 2014. Furthermore, in almost all models, the only key covariate to reach statistical significance at the p < .05 level—and at the p < .10 level in all models—is distance from Tehran. Finally, highway length is statistically significant in both models in which it is included, and these are the two models in which distance is only significant at the p < .10 level.
Discussion and Conclusion
In this article, we have evaluated predictions that arise from various theories in social science regarding factors that matter in budgeting in highly centralized countries. We found that, contrary to previous theories of in-group heterogeneity, allegiance to the regime in power does not directly influence per capita budgets. Likewise, the analysis did not reveal any significant effect of ethnic composition or heterogeneity or religiosity, indicating that patronage in Iran also does not significantly occur along ethnic or religious lines. The truly surprising finding, however, was not what failed to be significant but what was significant: distance from the capital had a positive relationship with provincial resource allocation.
The findings provide three significant theoretical contributions. First, the findings address political science resource allocation theory and specifically political clientelism theory. A common Western assumption is that in the absence of democracy, political patronage theories would be highly explanatory (Olson 2002; Tullock 2008), especially in the Middle East, where authoritarianism pervades. This prediction is not directly supported by the results. Even under the authoritarian regime of the clerics, resource distribution is not significantly influenced by political bias toward supporters. As Hosseini and Rahbar (2012) suggest, however, there are less developed areas of Iran in which an increase in provincial budgeting could mitigate the instability typically found there. The lack of evidence of a relationship between voting patterns or religiosity by province and Iranian provincial budgets does not directly support the patronage theory of Heeger (1974) and Theobald (1982) in which public goods are unequally distributed along patronage lines for support, but the positive distance findings suggest that there is more to this. If greater distances from the capital correlate to increased provincial budgets, there is some support to this theory in general given the historical instability of the peripheral provinces. In regimes that do not claim their legitimacy from the consent of the people, this finding normalizes the Islamic Republic of Iran to some degree in that budgetary appropriations are not related to identity politics, as many would likely assume for a theocratic regime struggling at times to maintain power.
The second contribution of these analyses is that, at least in the case of Iran, the results are not consistent with the findings of many African studies, such as those by Kimenyi (2006) or Franck and Rainer (2012), which, as an offshoot of political patronage theory, showed that ethnic heterogeneity has a significant influence on state distribution of goods and services. That the Iranian data demonstrate that ethnic heterogeneity plays little role in influencing Iranian provincial budgets is surprising given that ethnic groups such as the Kurds, Turks, and Baluch have historically been forgotten (Nader and Stewart 2013). Likewise, religiosity does not play a role in the inequality of budget resource distribution either. There are several reasons why these findings may differ from what is commonly perceived in Iran, namely, that ethnicity and religiosity are the chief suspects in budget disparities. The inequality between provinces may be a historical phenomenon that has been recently corrected, especially after the major provincial budget reform of 1999 and 2000, which centralized more spending rather than providing it to the provinces. It is possible that this budgetary reform corrected for past disparities in some meaningful way, but perceived disparities in infrastructure, life expectancy, and literacy, for example, all require decades rather than years to change significantly. If the major budgetary reforms of 1999 corrected past bias in some significant manner, the popular perception of budget disparities might still reflect the past rather than what is currently happening since reform.
This lag in the relationship between the perception of the Iranian people and reality may also be influenced by the fact that there are still some real disparities in budget allocation across provinces. The national average per capita budget over the period is 19,200 rials, with a standard deviation of 9,700 rials. However, there are a few provinces with budgets of 5,000 and 30,000 rials per person, suggesting that there are indeed still some significant disparities in the budgets. To determine if these disparities were aimed at bolstering the less developed areas of the country in an attempt to assuage the economic frustration evident in the protests over the past two years, we examined the northwestern region (which includes East Azerbaijan and West Azerbaijan, Mazandaran, Kerman, Gilan, Lorestan, Kurdistan, Chahar Mahaal/Bakhtiari, and North Khorasan) and found an average per capita budget of 18,300 rials, with a standard deviation of 10,800 rials. In short, this region does not appear much different than the overall country.
The third key contribution of this research is that the results contradict core-periphery theory as described by Krugman (1991) and Centeno and Enriquez (2010). That theory would suggest that in Iran, the demographic shift from rural to urban areas in the 1920s and 1930s would produce greater allocation of resources around the immediate core of Iran, Tehran. Indeed, Iranian economists such as Bakhtiyari et al. (2006) and Hosseini and Kaneko (2012) claim that proximity of the province to Tehran (the capital) influence resource distribution. Their studies were limited in their examination from 2000 to 2007. It is possible that the budgetary reform of 1999 and 2000 affected budgets only in the latter years of their data. Examining budgetary data over 14 years beyond the reform rather than the first 8 years may explain why our results differ from theirs. Additionally, the previous studies cited the sensitivities to research and data from within the country as a limitation. It is hard to decipher from outside Iran how these sensitivities affect their ability to use data such as from the ethnicity and religion survey, their analysis, or findings specifically, other than to acknowledge that there might not be complete academic freedom regarding the topics of ethnicity, religiosity, allegiance to the regime, or the centralization of power around the capital.
The argument of core-periphery state development theory and many Iranian economists is that provinces closer to the capital of Iran get more attention, power, and corresponding funding. The findings of this study show the opposite: more distant provinces receive disproportionate funding. Provinces on the periphery of the country may be better able to make strong arguments for higher levels of funding because they are not able to access services and programs emanating from the capital region, unlike nearby provinces that can leverage services provided by Tehran. For example, the neighboring province of Alborz is able to connect to the Tehran’s massive subway system, access the largest highways in Iran encircling the capital, and tap into the central distribution hub for cheaper food, energy, and building materials. If Tehran is the largest hub of resources and activities in the country, it is not hard to imagine the surrounding provinces on what is known as the Central Plateau benefiting from their proximity. This Central Plateau has two vast deserts to the east (Dasht-e Kavir and Dasht-e Lut), a large mountain range to the north (Alborz), and another large mountain range to the southeast (Zagros), all of which isolate the central area of Iran by geography to some degree. This can be seen in the road networks as well as the railway networks. This topography provides a strong argument for greater resources to be provided to the peripheral provinces.
Additionally, stabilizing areas that have been historically unstable, such as the northwestern provinces of Iran that sought to break away in the first two years of the Islamic Republic, is the strongest argument for this disparity. The influence of the United States in Iraq to the west and Afghanistan to the east is also worrisome to the regime. It is more likely that patrimonial apportionment as a form of the patronage theory satisfies fears of the Green Movement reemerging into yet another revolution from the fringes of the state.
Inequitable state resource distribution has long been a popular grievance that, in some cases, leads to social frustration and ultimately, revolution. In the case of Iran, this inequality was visually present with the grandeur of the royal family prior to the 1979 Islamic Revolution and continues to be a source of turmoil for the country to this day. It is a common ailment found in almost all countries to some degree. Understanding the possible contributors to the inequality and working to combat such bias is a useful activity for those governments, such as Iran, that know the fragility of state power even with a seemingly invincible national security apparatus. The positive distance bias found is not the source of the current protests in Iran, but the perception of inequality that underscores this bias certainly is. The data for this research precede the protests in late 2017 and 2018, but this work provides a better understanding of the complexity of resource distribution theories for countries beyond the Iranian borders. As the economic crisis continues to unfold in Iran, continued research with data beyond 2013, now more accessible than ever, could provide greater clarity of the Iranian resource allocation process. Additionally, greater exploration of the connection between geographic enclaves and budgeting within Iran as well as elsewhere can further shed light on a critical issue to the region and beyond.
Footnotes
Appendix B
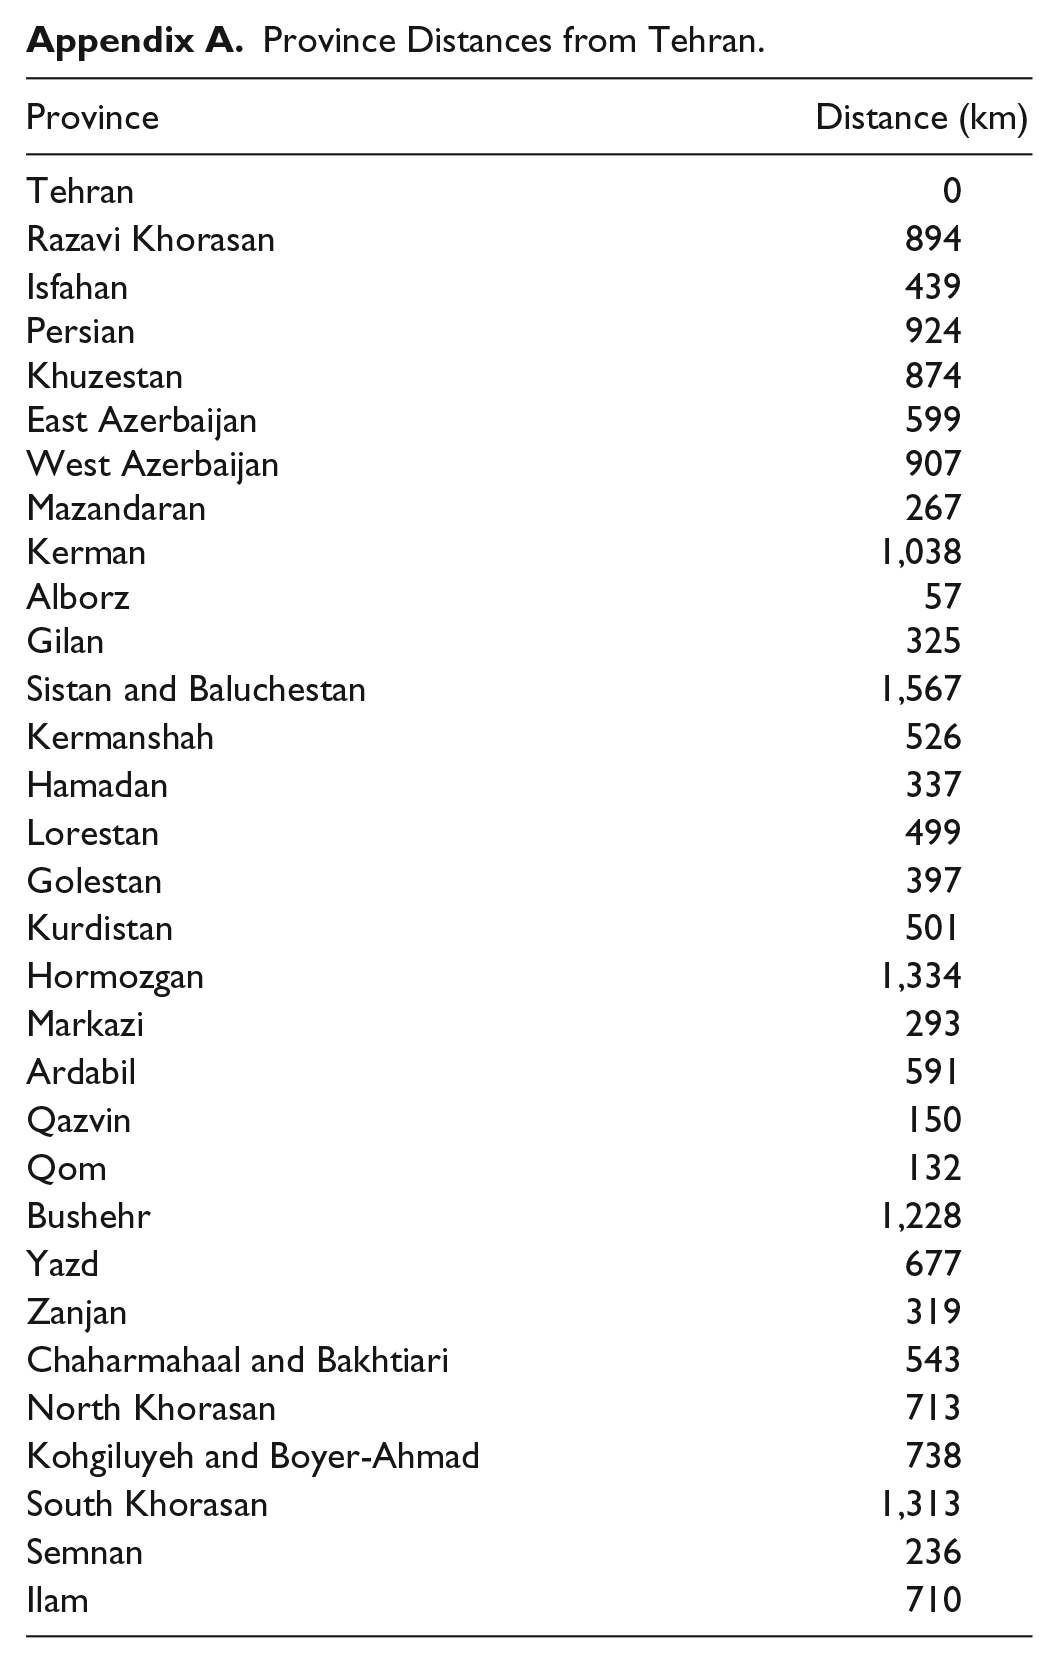
Appendix A.
Province Distances from Tehran.
| Province | Distance (km) |
|---|---|
| Tehran | 0 |
| Razavi Khorasan | 894 |
| Isfahan | 439 |
| Persian | 924 |
| Khuzestan | 874 |
| East Azerbaijan | 599 |
| West Azerbaijan | 907 |
| Mazandaran | 267 |
| Kerman | 1,038 |
| Alborz | 57 |
| Gilan | 325 |
| Sistan and Baluchestan | 1,567 |
| Kermanshah | 526 |
| Hamadan | 337 |
| Lorestan | 499 |
| Golestan | 397 |
| Kurdistan | 501 |
| Hormozgan | 1,334 |
| Markazi | 293 |
| Ardabil | 591 |
| Qazvin | 150 |
| Qom | 132 |
| Bushehr | 1,228 |
| Yazd | 677 |
| Zanjan | 319 |
| Chaharmahaal and Bakhtiari | 543 |
| North Khorasan | 713 |
| Kohgiluyeh and Boyer-Ahmad | 738 |
| South Khorasan | 1,313 |
| Semnan | 236 |
| Ilam | 710 |
Acknowledgements
Special appreciation is owed to Professor Hossein Mirshojaeian Hosseini and the graduate students at the University of Tehran, who generously supported the collection of data. Professors Miguel Centeno, Patricia Fernandez-Kelly, Andreas Wimmer, and Kevan Harris also provided significant advice and support for this study.
Funding
The author(s) disclosed receipt of the following financial support for the research, authorship, and/or publication of this article: This work was supported by the Sharmin and Bijan Mossavar-Rahmani Center for Iran and Persian Gulf Studies and Princeton University’s Sociology Department.