
Abstract
Discussion of “daddies” has exploded in popular discourse, yet there is little sociological research on age-heterogenous partnerships. This paper uses data from the 2013 Midlife in the United States survey and the 2015–2016 National Social Life, Health, and Aging Project to examine age-heterogenous partnerships at older ages (63 was the approximate average age of each sample). On most measures of life satisfaction and relationship well-being, individuals in age-heterogenous partnerships—regardless of age or gender—were not very different from their counterparts in age-homogenous relationships. Some differences did emerge, however, especially related to sexual well-being. Women partnered to older men had less sex and more issues related to sexual satisfaction than their counterparts in age-homogenous relationships. Latent class analyses suggest that these differences were driven by around 40 percent of younger women partnered to older men, a minority of whom were deeply dissatisfied. This research helps address the underrepresentation of sexuality research at older ages and the sociological research gap about age-heterogenous partnerships.
“Now,” asked Matt Damon in a December 2018 skit on Saturday Night Live (SNL), “what exactly is a daddy?” One of the comedians, Kate McKinnon, responded, “Well, think George Clooney, but achievable.” They both said in unison, “Any man can be a father, but it takes a hot middle-aged guy with a big job to be a daddy.” In the skit, various “daddies” competed for the title of Westminster Daddy. Judges looked for, as Matt Damon explained, “men over the age of 46 with a little salt-and-pepper in the temples, some play money to throw around, and a smug knowing smile that says, ‘I do sex good.’” Contestants included West Palm Golf Daddy, Berkeley Tweedy Daddy, Wall Street Business Daddy, and Broadcast Daddy. This skit was the culmination of popular interest in daddies in recent years. Outlets such as the Independent and the Toronto Sun have examined how younger women are connecting with older men—“sugar daddies”—to help cover living and educational expenses (Adams 2012; Maimann 2015). Representations on SNL and in these news articles explicitly tie being a daddy to having and exercising financial leverage. Other articles, such as one in the Washington Post, discuss how and why people refer to men as daddies (Dewey 2016), which does not necessarily reflect a class difference between a daddy and his admirer. Kirkland (2018), in Esquire, detailed distinct types of daddies: “daddy,” “zaddy,” “poppa” or “papi,” “sugar daddy,” and DILF (“dad I’d like to fuck”). The article dramatically states that “there is a time in every man’s life when he becomes a daddy.” While that point is arguable, it is clear that for many, calling someone “daddy” is similar to a sexual fetish or kink, imbued with consensual power dynamics (Levinson 2017). Daddy has had a sexual meaning for centuries, though that exact meaning has differed by context, population, and era (Farhi 2005). While socially validated sexual fetishization of older men may be more common among gay men (Albo 2013), there are also many straight men who are daddies and straight women who yearn for them—with or without financial benefits.
While discussion of daddies in popular culture has exploded, there has been less coverage of women partnered to younger men (“cougars”) and even less of women partnered to older men and men partnered to older women. Differential coverage of daddies and cougars reflects gender inequalities: It is rarer for women than men to be considered desirable as they age, and there is more stigma attached to woman-older relationships than man-older relationships (Alarie 2019a, 2019b; Warren 1996). While many consider it appropriate and desirable for older men to pursue younger women, the same is generally not true for women, and there are misconceptions and stigmas about women who partner with younger men (Alarie 2019b). Evaluation of age-heterogenous partnerships is imbued with gendered inequalities that reflect women’s devaluation in society more broadly, especially as they age (Alarie 2019a, 2019b; Warren 1996).
Despite popular interest in daddies, there is little academic examination of age-heterogenous partnerships or individuals in them. The current paper considers how and to what extent individuals in age-heterogenous partnerships differ from those in age-homogenous partnerships about gender attitudes and relationship satisfaction, including that related to sex and how often partners disagree about relationship issues.
All data come from the 2013 Midlife in the United States (MIDUS) survey and the 2015–2016 National Social Life, Health, and Aging Project (NSHAP). While the results cannot determine causality, they highlight the extent to which individuals in age-heterogenous relationships are distinct (or not) from their counterparts, which in turn has implications for understanding relationship inequality and characteristics of uncommon but highly visible and often misunderstood partnerships. While some individuals describe themselves as daddies or cougars, for others these labels have negative meanings. To avoid terminology that some may find offensive and to use language that is as straightforward as possible, this paper uses the terms men partnered to younger women instead of daddy and women partnered to younger men instead of cougar as well as women partnered to older men and men partnered to older women. Relatedly, this research cannot examine identification as a daddy or cougar, given that the surveys did not ask that (sadly, no representative surveys do), but it can examine the characteristics of individuals in age-heterogenous partnerships. This paper specifically focuses on individuals at older ages, both to help correct the underrepresentation of older individuals in gender and sexuality research and to examine age-heterogenous partnerships past ages typically represented in the media. This paper also adds to the relatively sparse literature on age-heterogenous partnerships in the United States, since much prior research has examined western Europe, Australia, New Zealand, Hong Kong, South Korea, or Taiwan.
When discussing relationships, this paper uses the terms age heterogenous and age homogenous to refer to partnerships with substantial age gaps or no substantial age gaps, respectively, as well as age concordant to refer to individuals in age-homogenous partnerships. It also uses the terms man-older and woman-older to refer to gender arrangements within these relationship types. For instance, man-older refers to relationships in which men are substantially older than their woman partner, not relationships in which men are older than their woman partner by any age. Scholars use markedly different cutoff points for what constitutes an age-heterogenous relationship, and these often differ by gender; there is little consistency in the literature. This paper measures age-heterogenous relationships as those in which either partner is 10 or more years older than his or her partner, though other studies have used different cutoff points (as the next section details).
What We Know about Different-Sex Age-Heterogenous Partnerships 1
Historical Changes to Age-Related Partnering Practices
In most countries, including the United States (Feighan 2018), age-heterogenous relationships have declined in frequency. Fairly steep declines have occurred with man-older relationships, while woman-older relationships have increased slightly: Considering age gaps of at least eight years in the United States, census data show that man-older relationships declined from 12.8 percent of marriages in 1960 to 9.3 percent of marriages in 2000, and woman-older relationships slightly increased, from 1.4 percent to 2 percent of marriages in the same time frame (Mansour and McKinnish 2013). Marriages in Spain, New Zealand, and Sweden have followed a similar trend (Esteve, Cortina, and Cabré 2009; Kolk 2015; Lawton and Callister 2010). These changes may be part of a larger pattern of changing relationship norms (e.g., delayed marriage) in the same time frame (Kolk 2015).
Physical and Mental Health
Fairly few differences in physical and mental health exist between individuals in age-heterogenous and age-homogenous unions (Choi and Vasunilashorn 2014), though levels of cognitive ability and interviewer-rated attractiveness differ. In terms of physical and mental health, the 1992-to-1993 and 2003-to-2005 Wisconsin Longitudinal Study show few overall differences between individuals in age-heterogenous and age-homogenous relationships, those in which the husband is 12 or more years older than his wife or the wife is 4 or more years older than her husband (Choi and Vasunilashorn 2014). At the same time, widowed respondents who were previously in an age-heterogenous relationship had somewhat worse mental health than their widowed counterparts who had been in age-homogenous relationships (Choi and Vasunilashorn 2014). However, the 2006-to-2012 Korean Longitudinal Study of Aging shows that depressive symptoms are higher for men and women in marriages in which the wife is older than the husband (Kim, Park, and Lee 2015). In terms of death rates, Danish register systems—which comprehensively document characteristics of the entire population—show that net of other controls, women had higher mortality rates if they were either older or younger than their husband compared to women who were within one year of their husband’s age (Drefahl 2010). In contrast, men younger than their wife had higher mortality rates than men about the same age as their wife but lower rates if they were older than their wife (Drefahl 2010). Why these trends exist is unclear.
Evidence from the National Longitudinal Survey of Youth 1979 indicates that men at least eight years older or younger than their wife have significantly lower cognitive ability than men married to women around the same age (Mansour and McKinnish 2013). Additionally, data from the National Longitudinal Study of Adolescent to Adult Health show that men five or more years older than their wife were significantly less attractive (as determined by interviewers) than those who married a woman around the same age, whereas women who married men at least five years older had significantly higher measures of body mass index in high school (Mansour and McKinnish 2013). Importantly, attractiveness is socially constructed and differs across cultures and time periods (Travis, Meginnis, and Bardari 2000; Wolf 1991), so these findings should be evaluated with caution. Reasons why cognitive abilities may differ are discussed later, in the Earnings and Education section.
Relationship Satisfaction
Few data exist on measures of relationship satisfaction within age-heterogenous and age-homogenous partnerships. The 2001-to-2013 longitudinal Household, Income, and Labor Dynamics in Australia study shows that both men and women are more satisfied when they have younger spouses but that marital satisfaction declines more over time among individuals in relationships with age gaps (Lee and McKinnish 2018). Similarly, a representative survey of Hong Kong shows that husbands who were two to four years older than their wife had higher relationship satisfaction than men about the same age as their wife, whereas husbands five or more years younger than their wife had lower relationship satisfaction and lower satisfaction with their sex lives (Zhang, Ho, and Yip 2012). Women younger than their husband had higher sexual satisfaction than women around the same age as their husband (Zhang et al. 2012). While intriguing, little is known about relationship satisfaction or sexual satisfaction by partnership type in the United States.
Earnings and Education
Overall, individuals in age-heterogenous partnerships (whether men or women, older or younger) have lower incomes and rates of educational attainment, on average, than individuals in age-homogenous relationships, and this is evident across multiple Western countries (Dribe and Nystedt 2017; Feighan 2018; Gustafson and Fransson 2015; Mansour and McKinnish 2013). Education and earnings differences are more about individuals than the partnerships they form. In other words, individuals who are likelier to have lower incomes and educational attainment are also likelier to enter into age-heterogenous partnerships (Dribe and Nystedt 2017; Mansour and McKinnish 2013; Oksuzyan et al. 2017). This is likely because individuals who attain a bachelor’s or above spend more time in institutions and settings with people around their same age (e.g., universities) and are thus likelier to meet same-age partners (Mansour and McKinnish 2013).
At the same time, Census and American Community Survey (ACS) data show that among full-time workers, the median spousal income gap was greater in marriages in which the husband was older than his wife, whereas the gap was lowest in marriages in which the wife was older than her husband (Feighan 2018). This is a shift from prior years: Previously, British and U.S. Census data suggested that the probability of being in a marriage in which the wife is at least five years older than the husband increased if the wife had more education and income than her husband (Coles and Francesconi 2011). Despite some inconsistent findings, most research indicates that individuals in age-heterogenous partnerships—regardless of age or gender—are likelier to have lower education and earnings than their age-homogenous counterparts.
Immigration, National Origin, and Race
Transnational processes and race are also tied to age-related partnering practices. Using the 2010-to-2014 ACS, Balistreri, Joyner, and Kao (2017) found that citizenship status was related to age gaps between partners, particularly for women. Immigrant women who married a U.S. citizen before or upon arrival had the largest age gaps between themselves and their husband, with smaller but still substantial gaps between immigrant women who married a U.S. citizen a year or more after arrival. Gaps between immigrant women and immigrant men were much smaller, as were gaps between immigrant men and either citizen or immigrant wives. This strongly suggests that nationality is being exchanged for youth, and in gendered ways (see also Levchenko and Solheim 2013). Similar results about age gaps between citizen men and immigrant women are evident in Sweden (Elwert 2016; Gustafson and Fransson 2015), Italy (Guetto and Azzolini 2015), and Taiwan (Tsai 2011), particularly between citizen men and immigrant women from low- and middle-income countries (Niedomysl, Östh, and van Ham 2010).
Relatedly, census and ACS data show that while the odds of being in an age-heterogenous marriage lowered for most groups over the past century, the odds actually increased for Asian women (Feighan 2018). They also show that being in age-heterogenous unions was greater for black-white or Asian-white relationships compared to same-race unions, and for black and Latino men compared to white men such that they had higher odds of having an older wife (Feighan 2018). Overall, there are clear differences in the odds of entering into age-heterogenous partnerships based on immigrant status and race. These reflect broader patterns of inequality regarding intersections of gender, race, and national origin.
Age and Prior Relationships
Data from the U.S. Census and the ACS show that the odds of being in age-heterogenous unions are usually greater for people who are older and who remarry (Feighan 2018), patterns that are also evident in Spain, Sweden, and Britain (Coles and Francesconi 2011; Esteve et al. 2009; Gustafson and Fransson 2015). Age heterogamy may increase with higher-order marriages because individuals are no longer in age-graded institutions, like higher education (Mare 1991). This is gendered, however. While certain economic models suggest that differences in fecundity rather than income are the primary driver of age gaps between men and women at marriage (Díaz-Giménez and Giolito 2013), evidence shows that the main reason is that women are devalued as they age much more than men. Indeed, in the United States, as men’s age at marriage increases, so, too, does the age gap with their wife—even when she is past childbearing age (England and McClintock 2009). The effect of education or educational differences is fairly small compared to that of the age of the husband (England and McClintock 2009). Overall, evidence shows that women are devalued when aging in ways men are not, explaining much of the difference in prevalence rates of man-older and woman-older relationships.
Attitudes
Few studies have examined attitudinal characteristics of individuals in age-heterogenous partnerships. Alarie and Carmichael (2015) conducted one of the only studies. They analyzed the 2002 National Survey of Family Growth, of women 15 to 44 in the United States, and found that liberal attitudes about stay-at-home mothers and the morality of unconventional consensual sexual activities were associated with a woman being 5 or 10 years older than a male sexual partner. Their results suggest that women who are 5 or 10 years older than a male sexual partner are more liberal than their counterparts who sexually partner with men around their same age, whereas women who partnered with older men did not have significantly different attitudes than women who partnered with men around their same age. Their study examined only women and did so using a fairly old data source; I build on it to examine both men and women, using more recent data and in older ages.
Few qualitative studies have examined individuals in age-heterogenous partnerships, but those that do suggest unique characteristics of individuals in them. Alarie (2019a) interviewed 55 women ages 30 to 60 who had dated men at least five years younger than them. She found that participants felt that they could have higher-quality sex with younger men, be sexually assertive, and ensure that their pleasure was attended to just as much as the man’s. Other studies have suggested that individuals in man-older age-heterogenous relationships frame inequalities in their relationship as individual issues that are either relatively unproblematic or able to be resolved through relationship work (that they have not yet done), thereby leaving inequality intact (McKenzie 2015). This suggests that individuals in man-older relationships may be more socially conservative than their counterparts, but this is an empirical question needing to be addressed.
Overall, there is a fairly sizable literature about the prevalence of age-heterogenous partnerships and how odds of being in them differ by gender, age, education, earnings, nationality, and marriage history. There is little, however, about the attitudes of individuals in these partnerships or of their measures of sex and relationship satisfaction, particularly in the United States. These are the gaps this paper hopes to fill.
Method
One data set this paper uses is MIDUS, a U.S.-based longitudinal study that last interviewed participants in 2013. This paper analyzes the 3,294 who participated in wave 3, of whom 1,414 had been recruited via random-digit dialing (RDD), 544 who were nontwin siblings of respondents, 1,018 who were twins, and 318 who were part of a Milwaukee, Wisconsin, oversample. The sample is not nationally representative, but poststratification weights for the participants recruited via RDD were applied to make the results more reflective of race, age, gender, and education in the October 2013 Current Population Survey. The current paper analyzes this survey because of the rich data it offers about respondents’ partners as well as respondents’ attitudes about gender. Despite it not being nationally representative, it offers a greater variety of variables for analysis than NSHAP, the nationally representative survey. Of the final interviewed sample, 2,294 were in different-sex relationships; this is the subset this paper analyzes. 2 Of the 1,167 men in relationships with data about the age of their woman partner, 85 were partnered to younger women, 10 were partnered to older women, and 1,072 were partnered to women within 10 years of their own age. Of women, 14 were partnered to younger men, 78 were partnered to older men, and 1,075 were partnered to men within 10 years of their own age. The age range of respondents ranged from 39 to 93, with a weighted mean of 62.1. For shorthand, I use age concordants to describe people whose partners were fewer than 10 years older or younger than them.
The second data set this paper analyzes is NSHAP, a U.S.-based nationally representative sample of older adults. Its first wave included individuals ages 57 to 85 in 2004; its second wave included original wave 1 respondents, their spouses or coresident partners, and when possible, nonresponders who were selected for wave 1. Wave 3 interviewed surviving members of wave 2 as well as a nationally representative sample of individuals born between 1948 and 1965. Overall, 4,777 individuals participated in the 2015-to-2016 NSHAP wave 3. Weights make the results generalizable to the older adult population of the United States. Of the final interviewed sample, 2,843 were currently in different-sex relationships and had complete information about the age of their partner. This included 1,499 men, of whom 200 were partnered to younger women, 9 were partnered to older women, and 1,290 were age concordants; and 1,344 women, of whom 35 were partnered to younger men, 91 were partnered to older men, and 1,218 of whom were age concordants. The age range of respondents was 49 to 95, with a weighted mean of 63.6.
Independent Variables: MIDUS
All models with MIDUS include nine independent variables. Age was the respondents’ age in years. Race included white, black, Native American, Asian or Pacific Islander, other, and Latinx; the vast majority of the sample, however, was white (88.6%). (Relatedly, immigrant status was not measured.) Educational difference included four categories: neither respondents nor partners had at least a bachelor’s, both partners had a bachelor’s or above, the respondent had at least a bachelor’s but his or her partner did not, and the respondent’s partner had at least a bachelor’s but the respondent did not. Children measured whether or not the respondents had ever had children. Religious attendance included six options: never, less than once per month, one to three times per month, once a week, a few times a week, and once a day or more. Marriage number measures whether the respondents were married zero times, one time, or two or more times. Cohabitation identifies whether respondents were currently married or cohabitating. Relationship time measures the length of respondents’ current relationship, in years. Relationship type is a three-option variable measuring whether the respondent was with a younger partner, was with an older partner, or was in an age-concordant relationship. This is the main independent variable of interest.
Control Variables: NSHAP
NSHAP wave 3 had fewer data available about characteristics of respondents’ partners and marital history, so only eight independent variables were included. 3 Age was the respondent’s age in years. Education included four categories: less than high school; high school; some college, a vocational certificate, or an associate’s; and a bachelor’s or above. Race included white, black, Latinx, and other. Children measured whether respondents ever had children. Religious attendance included never, about once or twice a year, several times a year, about once a month, every week, and several times a week. Also included was a measure of the respondents’ immigrant status (yes or no). Relationship status included married or unmarried (including cohabitating). Relationship type, based on the age of the respondent’s partner, was measured the same way as in MIDUS.
Outcomes of Interest: MIDUS
Within MIDUS, this paper examines three main variable types: gender attitudes, nonsexual relationship quality, and sex life satisfaction.
Attitudes toward traditional gender practices within the family
All gender attitudes were measured using a 1-to-7 Likert scale including agree strongly, agree somewhat, agree a little, neither agree nor disagree, disagree a little, disagree somewhat, and disagree strongly. Due to the similarity between somewhat and a little, I collapsed them such that the Likert scale was reduced to 1 to 5. Questions included the following, with variations in brackets: “[Women/men] can have full and happy lives without marrying.” “[Women/men] can have full and happy lives without any children.” The Cronbach’s alpha was .89, so these four were transformed into an additive scale ranging from 4 to 20. Other attitudes included “Children need to be raised in a family with both parents,” “Single parents can rear children just as well as married adults,” “Employed mothers can have just as good a relationship with children,” and “The partner who earns the least money should do the most household chores.” With all variables, more conservative responses were given higher values. These variables measure different beliefs about traditional gender practices within the family. For shorthand, the tables in this paper refer to these variables as the “gender attitudes scale,” “both parents needed,” “single parents unacceptable,” “working mothers unacceptable,” and “partner with less money should do more chores,” respectively.
Relationship quality
Three measures were combined into an additive scale because their Cronbach’s alpha was .74. Their options included a lot, some, a little, and not at all. These variables included “Couples often disagree about a lot of issues in life. How much do you and your spouse or partner disagree about money matters, such as how much to spend, save or invest? Household tasks, such as what needs doing and who does it? Leisure time activities, such as what to do and with whom?” The additive scale ranged from 3 to 12. Four other measures about communication were in a 1-to-7 Likert scale (like the gender attitudes) and were collapsed into 1-to-5 categories. They included “My partner and I are a team when it comes to making decisions,” “Things turn out better when I talk things over with my partner,” “I don’t make plans for the future without talking it over with my partner,” and “When I have to make decisions about medical, financial, or family issues, I ask my partner for advice.” The Cronbach’s’ alpha was .88, and the four were transformed into an additive index from 4 to 20. All variables were coded such that more disagreement and less communication were given higher values. These variables are referred to as “partner disagreement scale” and “poor partner communication scale,” respectively.
Sex life satisfaction
Respondents were asked to rate aspects of their sex life. These included the following: “Using a scale from 0 to 10 where 0 means ‘the worst possible situation’ and 10 means ‘the best possible situation,’ how would you rate the sexual aspect of your life these days?” “Using a 0 to 10 scale where 0 means ‘no control at all’ and 10 means ‘very much control,’ how would you rate the amount of control you have over the sexual aspect of your life these days?” The Cronbach’s alpha was .75; the scores were transformed into an additive index ranging from 0 to 20, with worse responses given higher values. This is referred to as “poor sex life satisfaction.”
Outcomes of Interest: NSHAP
A variety of questions asked about relationship quality, mental health, and sex life satisfaction in NSHAP. I recoded all responses such that more negative responses were given higher values.
Relationship quality
The following eight relationship measures included the options never, hardly ever or rarely, some of the time, and often. In the following questions, CP (current partner) represents the respondents’ partner’s name. Questions included “How often can you open up to [CP] if you need to talk about your worries?” “How often does [CP] make too many demands on you?” “How often does [CP] criticize you?” “How much does [CP] really understand the way you feel about things?” “How often does [CP] open up to you if [he/she] needs to talk about [his/her] worries?” “How often does [CP] rely on you for help if [she/he] has a problem?” “How much does [CP] let you down when you are counting on [him/her]?” and “How often does [CP] get on your nerves?” The Cronbach’s alpha was .77, so I combined the responses into an additive scale from 0 to 24, with higher measures indicating lower relationship satisfaction. Another question was “Taking all things together, how would you describe your [marriage/relationship] with [CP] on a scale from 1 to 7 with 1 being very unhappy and 7 being very happy?” 4 Another question on a 5-point scale included “How emotionally satisfying did/do you find your relationship with (him/her) to be? Extremely satisfying, very satisfying, moderately satisfying, slightly satisfying, or not at all satisfying?” These variables are named “relationship problems,” “relationship is unhappy,” and “relationship is unemotional,” respectively.
Mental health
Six questions asked about anxiety, with options including rarely or none of the time, some of the time, occasionally, and most of the time. Respondents were asked how many times during the past week “I felt tense or ‘wound up,’” “I got a frightened feeling as if something awful was about to happen,” “worrying thoughts went through my mind,” “I got a frightened feeling like butterflies in my stomach,” “I felt restless as if I had to be on the move,” and “I had a sudden feeling of panic.” The Cronbach’s alpha was .78, so I combined the responses into an additive scale from 6 to 24. Other questions about feelings within the past week, with the same answer options, included “I was unable to control important things in my life” and “I felt that difficulties were piling up so high I could not overcome them.” One question asked about general happiness on a 1-to-5 scale: “If you were to consider your life in general these days, how happy or unhappy would you say you are, on the whole?” These variables are “anxiety,” “lack of control,” “life is difficult,” and “life is unhappy,” respectively.
Sex life satisfaction
A variety of questions asked about respondents’ sex lives, including “How physically pleasurable did/do you find your relationship with [CP] to be: extremely pleasurable, very pleasurable, moderately pleasurable, slightly pleasurable, or not at all pleasurable?” 5 Another question on a 5-point scale included “In the past 12 months, how often did you have sex primarily because you felt obligated or that it was your duty?” 6 Sexual frequency included none, once a month or less, two or three times a month, once or twice a week, three to six times a week, and once a day or more. 7 The following were yes-or-no questions about whether during the last 12 months there had ever been a period of several months or more when respondents “lacked interest in having sex”; “were unable to climax, that is, experience an orgasm”; “came to a climax, that is, experienced orgasm too quickly”; or “experienced physical pain during intercourse.” The final yes-or-no questions was “Have you ever talked with [CP] about the problem(s) you mentioned?” These variables are “sex is unpleasurable,” “frequency of obligated sex,” “lacked interest in sex,” “unable to orgasm,” “orgasmed too quickly,” “sex is painful,” and “talk to partner about sex issues,” respectively.
Analytic Strategy
All analyses are stratified by sex. Linear regression, ordered logit, and logistic regression were used for variables depending on variable type. All ordinal variables were evaluated to ensure they did not violate assumptions for ordered logit regressions; those that did were dichotomized and evaluated logistically. 8 Control variables were included in all models but their coefficients are not displayed for space reasons; they are available upon request. All regressions were weighted with poststratification weights (MIDUS) or weights to make them representative of the older population of the United States (NSHAP).
Last, latent class analyses (LCAs) and latent profile analyses (LPAs)—which perform similar statistical operations—explore variation within partnership types: men partnered to younger women, women partnered to older men, and women partnered to younger men (neither survey had a large-enough sample to conduct an LPA/LCA within men partnered to older women). Whereas regressions examine the association between variables and an outcome of interest, LCAs and LPAs determine groups of individuals on the basis of variables (Grzanka 2016). 9 Regressions isolate the effects of a particular independent variable, after controlling for other variables, to determine its relationship to the dependent variable. For instance, regressions tell us the relationship between age-related partnership status and sex life satisfaction, after controlling for age. LCAs and LPAs, in contrast, identify particular groups (or classes) that share similarities on the basis of those variables. For instance, an LCA/LPA among men partnered to younger women using the variable age and various measures of sex life satisfaction would reveal (1) the number of distinct groups of men on the basis of those variables, (2) the percentage of men in each group, and (3) the values for age and sex life satisfaction in each group. In other words, regressions and LCAs/LPAs show different things: The former shows the relationship between two variables after accounting for other variables, whereas the latter identifies groupings of people on the basis of those variables. The purpose of LCAs/LPAs in this paper is to determine diversity within categories of men partnered to younger women, women partnered to younger men, and women partnered to older men.
Results
Multivariable Regressions
Women
Table 1 presents the results for all multivariable regressions from MIDUS. Notably, partner types significantly differed from one another on only two variables, net of controls. Women partnered to older men had significantly lower satisfaction with regard to their sex life; their scores were 1.77 points higher than age concordants (p < .05). Women partnered to younger men were not significantly different from age concordants on this measure. Interestingly, both women partnered to younger men and women partnered to older men significantly differed from age concordants on the attitude about women working, but in opposite ways. For women partnered to younger men compared to age concordants, there were increased odds of having more conservative views about women working (odds ratio [OR] = 2.93, p < .01). For women partnered to older men compared to age concordants, there were decreased odds of having conservative views about women working (OR = 0.40, p < .01). These contrasting findings are unexpected and intriguing, and it is unclear why they exist. There were no significant differences between women in various partnership types on the gender attitudes scale, the poor partner communication scale, the partner disagreement scale, or the following attitudes: whether both parents are needed, whether single parents are unacceptable, and whether the partner with less money should do more chores.
Association between Partnership Type and Dependent Variables in MIDUS after Adjusting for Controls.

Note: Coefficients for controls are not shown but are available upon request. Partnership type is the independent variable of interest in all models; its coefficients are the only ones shown. Controls include respondent age, race, educational difference between respondents and their partners, whether or not the respondent had children, religious attendance, marriage number, whether currently cohabitating or married, and length of current relationship. Higher values represent higher conservativism, higher religious attendance, more disagreement, worse communication, and worse attitudes about one’s sex life. MIDUS = Midlife in the United States survey; OR = odds ratio.
Coefficients shown.
ORs shown.
Men’s attitudes about women working were evaluated dichotomously in a logistic model, since tests indicated that the ordinal version of the variable—for men only—violated the proportional odds assumption. Women’s attitudes about women working were evaluated in an ordered logit model.
p < .05. **p < .001. ***p < .001 (two tailed).
Table 2 presents results from multivariable regressions using NSHAP data. Women partnered to younger men compared to age concordants had higher odds of feeling unhappy in their relationship (OR = 3.31, p < .05). Women partnered to older men did not significantly differ from age concordants on this measure. In contrast, women partnered to older men compared to age concordants had higher odds of feeling like life is difficult (OR = 2.02, p < .01), though women partnered to younger men did not significantly differ from age concordants on this variable. Additionally, women partnered to older men compared to age concordants had lower odds of having frequent sex (OR = 0.31, p < .001). Women partnered to older men compared to age concordants also had higher odds of having trouble reaching orgasm (OR = 1.98, p < .05) and lower odds of being able to talk to their partner about sexual issues (OR = 0.42, p < .05). In contrast, women partnered to younger men did not significantly differ from age concordants about the frequency of sex, trouble reaching orgasm, or talking to their partner about sexual issues. There were no significant differences between women in various partnership types on measures of relationship problems, anxiety, perceptions of lacking control over one’s life or having an unhappy life, feeling like one’s relationship is unemotional or that sex is unpleasurable, the frequency of sex out of a feeling of obligation, lacking interest in sex, orgasming too quickly, or feeling that sex is painful.
Association between Partnership Type and Dependent Variables in NSHAP after Adjusting for Controls.

Note: Coefficients for controls are not shown but are available upon request. Partnership type is the independent variable of interest in all models; its coefficients are the only ones shown. Age concordants are the comparison category. Controls include respondent age, race, respondent education, whether or not the respondent had children, religious attendance, whether currently cohabitating or married, and immigrant status. Higher values represent higher religious attendance, higher sexual frequency, worse mental health, and worse attitudes regarding respondents’ relationship and sex life. NSHAP = National Social Life, Health, and Aging Project; OR = odds ratio.
Coefficients shown.
ORs shown.
Certain attitudes violated the proportional odds assumption and were evaluated logistically. The following attitudes were evaluated logistically for one sex but not the other: relationship happiness (logistic for men, ordered logit for women), unpleasurable sex (logistic for women, ordered logit for men), and sexual obligation (logistic for men, ordered logit for women). These are under the “ordered logit” section for organizational purposes.
p < .05. **p < .001. ***p < .001 (two tailed).
Together, the results suggest that women partnered to older men have significantly more sexual problems than their counterparts in age-homogenous relationships but that there are few other differences between women in different relationship types.
Men
There were no statistically significant differences between partnership types among men, net of controls, for any of the variables tested in MIDUS (Table 1). The nonsignificant variables included the gender attitudes scale, the poor partner communication scale, measures of poor sex life satisfaction, the partner disagreement scale, and the following attitudes: whether both parents are needed, single parents are unacceptable, working mothers are unacceptable, and partners with less money should do more chores. These nonsignificant associations are themselves substantively important because they indicate the extent to which men in various partnership types share extensive similarities, despite different age-related partnering practices.
More differences existed in NSHAP than in MIDUS, however, as is visible in Table 2. Men partnered to older women compared to age concordants had significantly lower anxiety, with scores that were 3.59 points lower (p < .001). Men partnered to younger women did not differ from age concordants on this measure. Men partnered to younger women compared to age concordants had higher odds of having more frequent sex (OR = 2.00, p < .01), though men partnered to older women did not differ from age concordants on this measure. Interestingly, men partnered to older women had lower odds of premature ejaculation compared to age concordants (OR = .09, p < .05), though men partnered to younger women did not significantly differ from age concordants on this variable. There were no significant differences between men in various partnership types on the relationship problems scale, feeling out of control of one’s life, believing that life is difficult or unhappy, feeling that one’s relationship is unhappy or unemotional, believing that sex is unpleasurable, the frequency of having sex out of obligation, lacking interest in sex, not being able to orgasm, feeling that sex is painful, and being able to talk to partners about sexual issues. The statistically insignificant findings show that men in age-heterogenous partnerships, net of other factors, are not very different from their age-homogenous counterparts on most measures. While age-heterogenous relationships are uncommon, men in them are not markedly different from their counterparts.
LPAs
Women
Table 3 presents results from the LPAs from MIDUS for women partnered to older men and men partnered to younger women; due to insufficient sample size, LPAs were not possible for women partnered to younger men or men partnered to older women. Bolded rows draw attention to the substantively different results between classes. Turning to women partnered to older men, class 1 had 38.50 percent of the sample, class 2 had 52.70 percent, and class 3 had just 8.80 percent. Notably, class 3 was much more conservative in its attitudes about single parents and working mothers, and it had vastly worse scores on the measures of partner disagreement, poor partner communication, and poor sex life satisfaction. Class 3 appears to characterize women in deeply unhappy and low-quality relationships, though it represents only about 9 percent of all women partnered to older men. Class 1 was more liberal than class 2 on almost all measures and had higher sex life satisfaction and only slightly worse scores on the partner communication scale.
Latent Profile Analyses of Men Partnered to Younger Women and Women Partnered to Older Men from MIDUS.
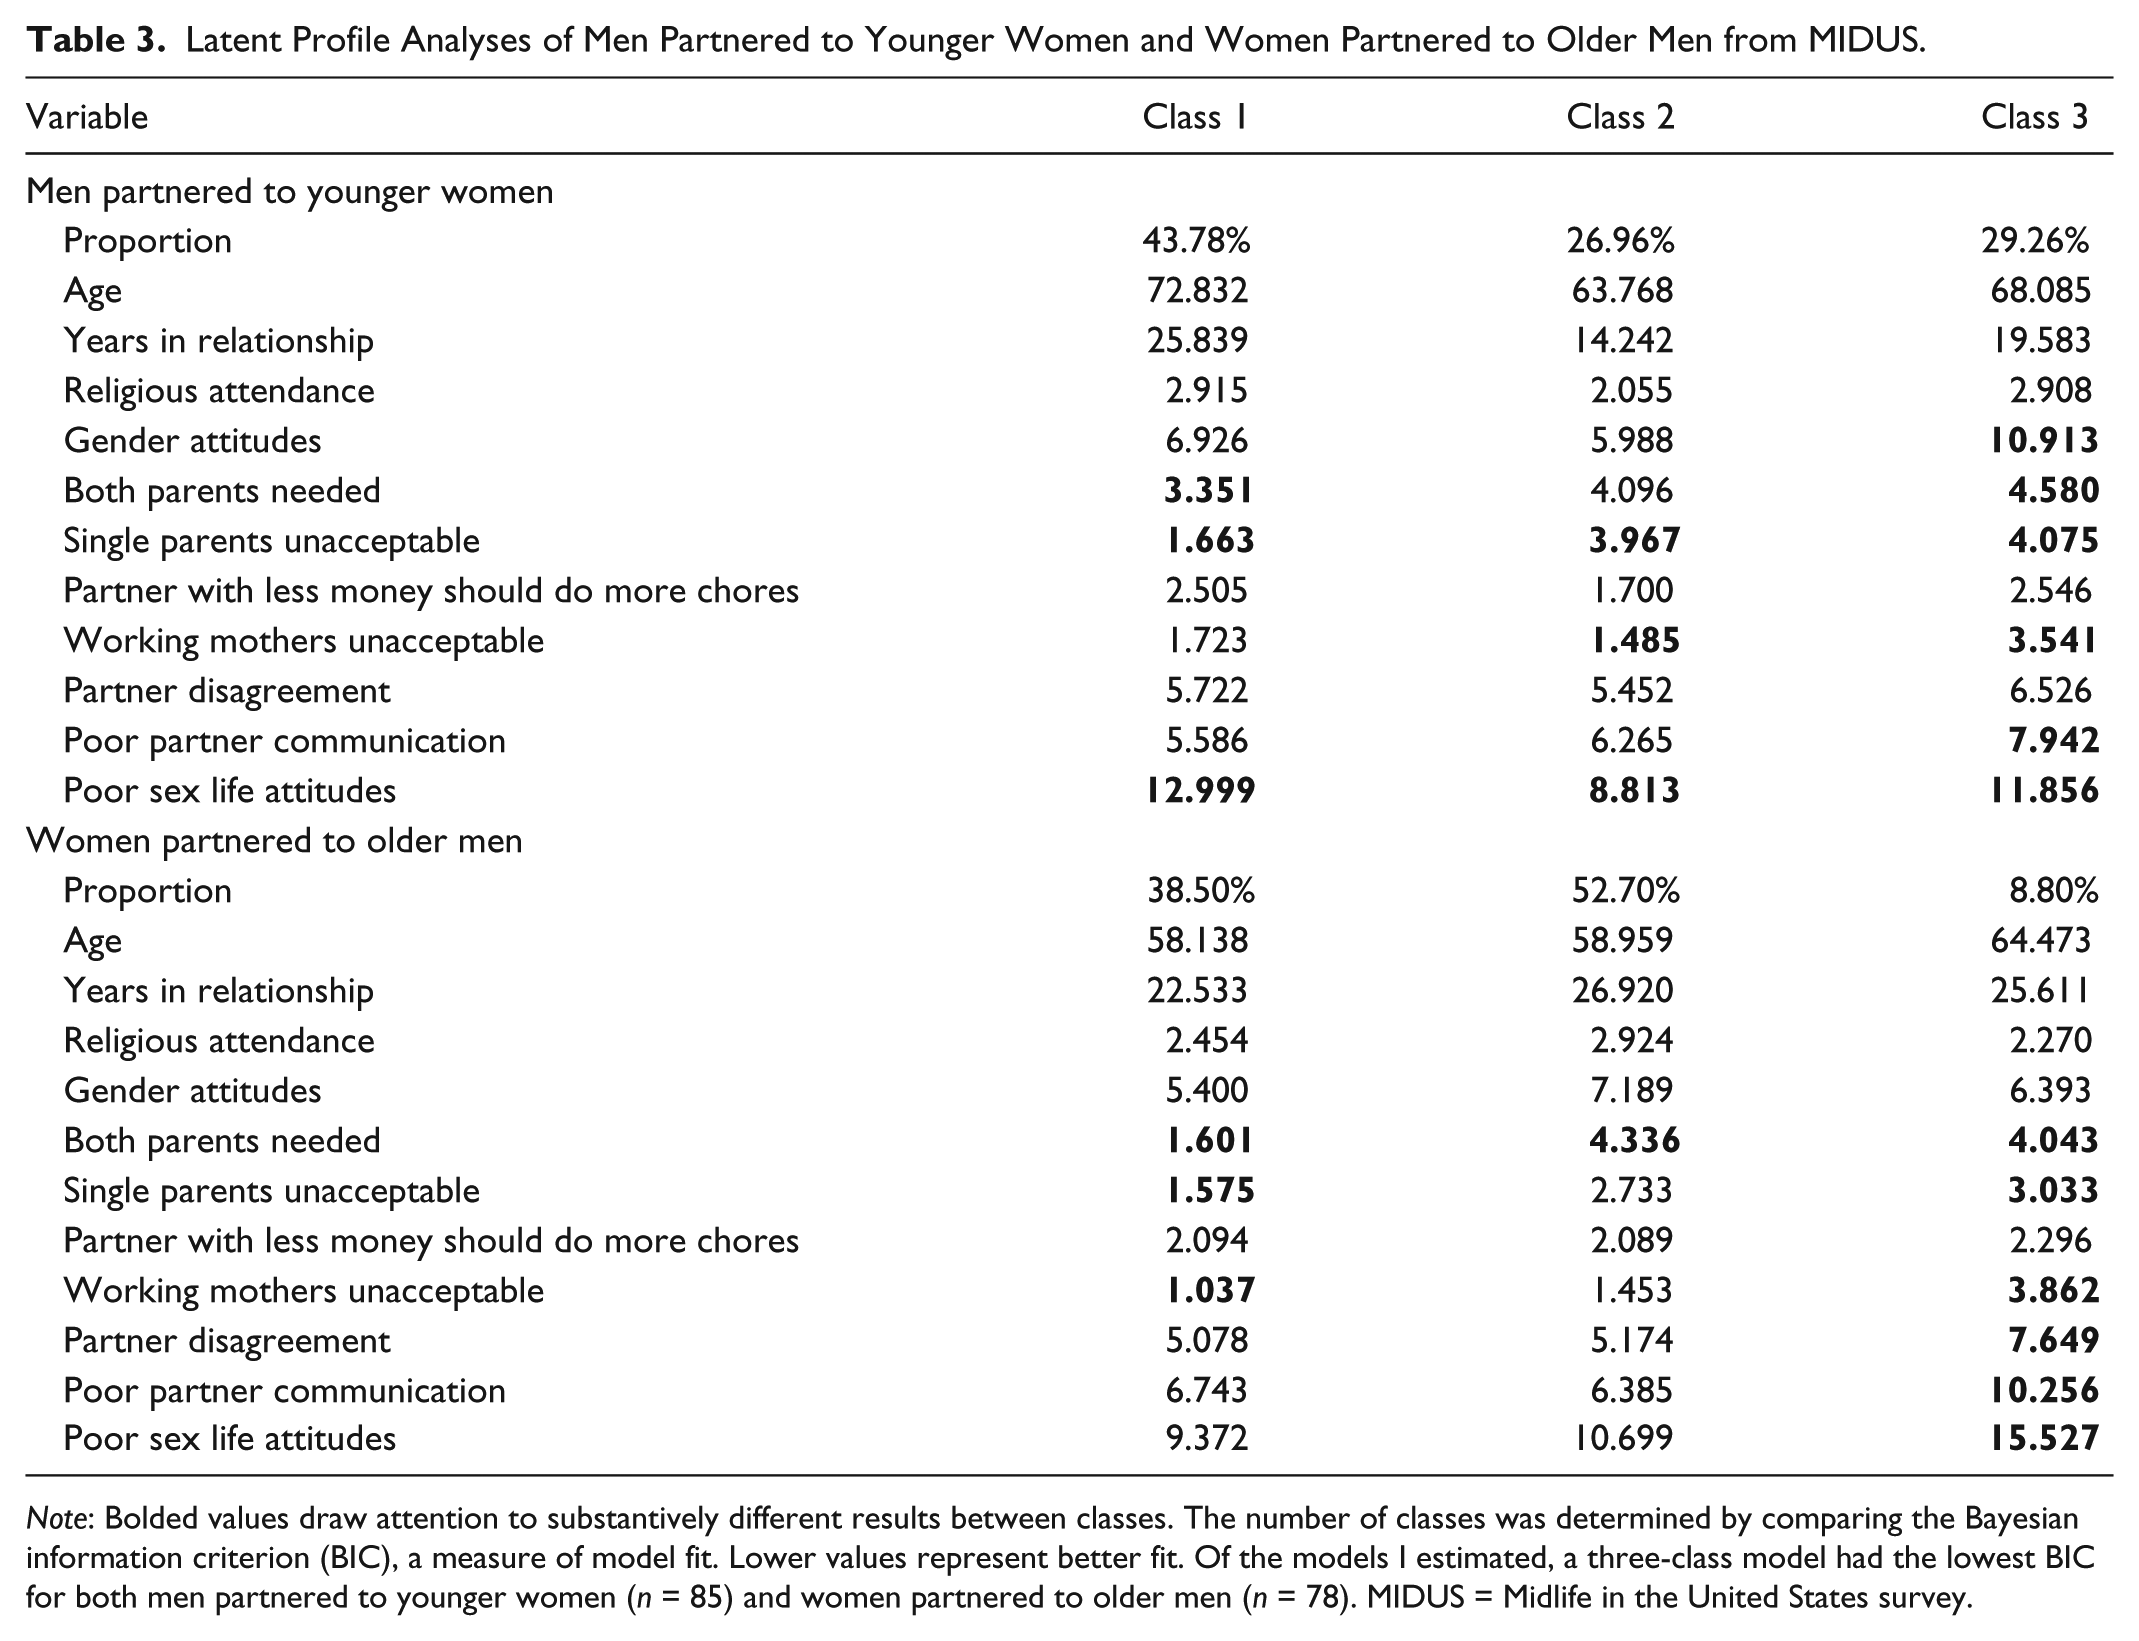
Note: Bolded values draw attention to substantively different results between classes. The number of classes was determined by comparing the Bayesian information criterion (BIC), a measure of model fit. Lower values represent better fit. Of the models I estimated, a three-class model had the lowest BIC for both men partnered to younger women (n = 85) and women partnered to older men (n = 78). MIDUS = Midlife in the United States survey.
Table 4 includes results from the LCAs/LPAs from NSHAP for women partnered to older men and women partnered to younger men. Similar to the results in MIDUS, women partnered to older men with the worst scores on indicators of relationship and life satisfaction were clustered into two classes. These classes, 2 and 3, comprised 10.46 percent and 28.69 percent of the subset, respectively. Class 2 had the worst measures by far, though importantly it was only a small portion of the subset. It had the worst scores on measures of relationship problems, feelings of lacking control, feeling that life is difficult and unhappy, feeling that sex is unpleasurable, and feeling that the relationship is unhappy and unemotional. Class 3 had the highest share of women having trouble experiencing orgasm, at 52.1 percent.
Latent Profile Analyses of Women Partnered to Older Men and Women Partnered to Younger Men from NSHAP.

Note: Bolded values draw attention to substantively different results between classes. The number of classes was determined by comparing the Bayesian information criterion (BIC), a measure of model fit. Lower values represent better fit. Of the models I estimated, a four-class model had the lowest BIC for women partnered to older men (n = 91), and a two-class model had the lowest BIC for women partnered to younger men (n = 35). NSHAP = National Social Life, Health, and Aging Project.
While only two classes were estimated for women partnered to younger men, the same general trend held: The class with the worst scores were a distinct minority of the subset, in this case, at 27.33 percent of all women partnered to younger men. Class 2 had more relationship problems, higher anxiety, a higher frequency of having sex out of a feeling of obligation, and stronger feelings that life is unhappy, their relationship is unemotional, and sex is unpleasurable.
Men
Turning to men partnered to younger women in MIDUS (Table 3), three classes were estimated. Class 1 had 43.78 percent of men partnered to younger women, class 2 had 26.96 percent, and class 3 had 29.26 percent. Class 3 was much more conservative than the other two on the gender attitudes scale, beliefs about both parents or single parents raising children, and whether working mothers are acceptable. It also had the worst scores regarding partner communication, and by a substantial amount. Class 2 was much more conservative than class 1 on attitudes about single parenting, but it was more liberal on the gender attitudes scale. Class 2 also had the highest sex life satisfaction. As with the other LPAs, men partnered to younger women with the poorest measures on relationship satisfaction were a distinct minority of the sample.
Table 5 displays results from the LPA of men partnered to younger women in NSHAP, in which a seven-class model was the best fit. Classes 3, 4, and 5, comprising 2.54 percent, 15.05 percent and 13.70 percent of the subset, respectively, had the worst scores on several indicators of relationship and life satisfaction. Combined, however, they are a minority of the sample of men partnered to younger women (approximately 31.29 percent combined). In contrast, class 7—which was the oldest class with a mean age of over 80, comprising 14.67 percent of the subset—had some of the most positive responses. In terms of sex, class 2—7.23 percent of the subset—was an outlier in two ways: It had a very high frequency of obligated sex as well as the highest frequency of sex overall, presumably due to having it out of a feeling of obligation. Class 1, which was 30.62 percent of the subset, had the second-highest frequency of sex.
Latent Profile Analyses of Men Partnered to Younger Women from NSHAP.

Note: Bolded values draw attention to substantively different results between classes. The number of classes was determined by comparing the Bayesian information criterion (BIC), a measure of model fit. Lower values represent better fit. Of the models I estimated, a seven-class model had the lowest BIC for men partnered to younger women (n = 197). NSHAP = National Social Life, Health, and Aging Project.
Discussion
This paper used two samples, one nationally representative, to examine gender attitudes, relationship well-being, life satisfaction, and sexual functioning among older adults in age-heterogenous partnerships. It is the first to examine most of these characteristics among individuals in age-heterogenous partnerships. By doing so, it adds to the sociological literature about sexuality and gender among older adults as well as uncommon but underexamined age-heterogenous partnerships. While media portrayals of “daddies” and, to a lesser extent, “cougars” have increased, sociological research has until now left these partnerships—especially in older ages—mostly unexamined.
This research builds on the relatively sparse literature about age-heterogenous partnerships. Prior research has shown that fairly few differences in mental and physical health exist between individuals in age-heterogenous versus age-homogenous partnerships (Choi and Vasunilashorn 2014; Drefahl 2010; Kim et al. 2015). Previous research has also shown that the demographic characteristics of individuals in age-heterogenous versus age-homogenous relationships are distinct: The former (regardless of gender or age) tend to be less educated and have lower incomes than the latter (Dribe and Nystedt 2017; Feighan 2018; Gustafson and Fransson 2015; Mansour and McKinnish 2013; Oksuzyan et al. 2017). Women who immigrate from developing nations to wealthier ones also have heightened odds of being in age-heterogenous partnerships, demonstrating how nationality and youth are exchanged in gendered ways (Balistreri et al. 2017; Elwert 2016; Guetto and Azzolini 2015; Gustafson and Fransson 2015; Levchenko and Solheim 2013; Niedomysl et al. 2010; Tsai 2011). Overall, while there are comprehensive demographic analyses of age-heterogenous partnerships (Coles and Francesconi 2011; Esteve et al. 2009; England and McClintock 2009; Feighan 2018; Gustafson and Fransson 2015), few have examined whether individuals in these partnerships differ from those in age-homogenous relationships on gender attitudes, relationship quality, and sex life satisfaction.
Several important findings emerged, most of them related to the lack of significant differences on most measures. First, there were few statistically significant differences in relationship well-being between individuals in age-homogenous partnerships (age concordants) and age-heterogenous partnerships, much as Lee and McKinnish (2018) found. Only one measure was significant, with women partnered to younger men having higher odds of reporting an unhappy relationship than age concordants. Characteristics related to poor communication, disagreement, and other relationship issues did not otherwise significantly differ between individuals in various partnership types. Given that age differences may result in relationship challenges—for instance, the younger partner needing to be a caretaker—it is substantively interesting and important that most measures of relationship well-being did not differ. Why women partnered to younger men would have higher odds of being unhappier, however, requires further research. It is likely related to stigma: There are substantial differences in how man-older and woman-older relationships are evaluated and perceived. Women who partner with younger men are devalued and stigmatized in ways that men who partner with younger women are not, reflecting women’s devaluation in society, particularly as they age (Alarie 2019a, 2019b; Montemurro and Siefken 2014; Warren 1996). Stigmas attached to women partnered to younger men may affect relationship quality; external prejudice, in other words, may negatively affect the relationship well-being of women partnered to younger men.
Similarly, individuals in age-heterogenous partnerships did not have significantly different attitudes about traditional gender practices within the family than age concordants on any measure except for beliefs about women working. Whereas women partnered to younger men had higher odds of being conservative on this attitude than age concordants, women partnered to older men had lower odds. The latter finding may reflect that women partnered to older men tend to work more than those partnered to men around the same age (Mansour and McKinnish 2013), so it is unsurprising that they are less conservative on this measure. Why women partnered to younger men would be more conservative, however, is puzzling. These findings somewhat contrast with those of Alarie and Carmichael (2015), but because they used a younger sample (the oldest women in their study were in their 40s), the differences could be due to age or generational factors or because this study examined women in romantic relationships whereas their study included women who had casual sexual encounters with younger men. Regardless, the lack of other differences on attitudes about traditional gender practices within the family—particularly among men—suggests that age-heterogenous or age-homogenous partnership types are not associated with many differences in outlook about gender practices within the family.
Similarly, few significant differences emerged regarding mental health and life satisfaction. There were no significant differences between partnership types regarding feelings of being out of control of one’s life or overall life happiness. Women partnered to older men did, however, have much higher odds than age concordants of feeling that their life was difficult, which may partially reflect needing to caretake for their older partner. It may also reflect external prejudice and stigma about the age difference between themselves and their partner, which could reduce overall life satisfaction. Last, significant anxiety differences did emerge, but only such that men partnered to older women had a lower anxiety score than age concordants. Overall, fairly few differences emerged with regard to relationship well-being, life satisfaction, or mental health for either women or men.
Where the most differences emerged between partnership types was with regard to sexual satisfaction. Women partnered to older men experienced lower satisfaction about their sex life than age concordants, and they also had less frequent sex, higher odds of having trouble reaching orgasm, and lower odds of talking to their partner about sexual issues. This is in contrast to Zhang et al. (2012), who found that in Hong Kong, women partnered to older men had higher sexual satisfaction than women around the same age as their husband. The present study also found that men partnered to older women, in contrast, had lower odds of having issues with premature ejaculation, and men partnered to younger women had higher odds of greater sexual frequency. The fact that men partnered to younger women and women partnered to older men had results that appear to contradict one another with regard to sexual frequency necessitates future research to determine whether this is due to differences in reporting or a sampling procedure that by chance selected higher proportions of sexually inactive or disadvantaged women with older partners or sexually active men with younger partners than in the general population, among other possibilities. Overall, these results suggest that women partnered to younger men are not significantly different from age concordants on measures of sexual well-being, men partnered to younger or older women may be slightly better off than age concordants, and women partnered to older men have worse outcomes than age concordants on multiple measures. Qualitative research is well suited to explore why exactly this may be the case.
One possible reason that women partnered to older men may have lower sexual satisfaction relates to both gender inequality and the aging process. First, men are much likelier to orgasm than women, reflecting how heterosexual sex is usually structured such that men’s pleasure is prioritized over that of women’s (Armstrong, England, and Fogarty 2012; Frederick et al. 2018). Thus, gender inequalities are built into heterosexual sex. Second, many men experience erectile dysfunction as they age, and women partnered to older men may experience frustration if they feel that their sex lives have come to a premature standstill or have more complications than they would have had, had they hypothetically partnered to a man around their own age. Women around the same age as their husband, in contrast, may be experiencing similar levels of sexual difficulty as their husband and therefore may not feel as though they are unduly disadvantaged by their partner’s sexual challenges. Given that women’s pleasure is attended to less than men’s pleasure in heterosexual relationships, on average, the added dynamic of navigating an older partner’s possibly heightened sexual difficulties may be frustrating for many women partnered to older men. Of course, it is also possible that man-older relationships operate differently sexually than same-age relationships, either due to selection effects of who enters into these relationships or because of age- and gender-related dynamics within the relationship itself. For instance, dynamics related to gender and age inequalities may interact to make sex less satisfying for women partnered to older men, perhaps because men are less focused on their younger woman partner than are men with a partner around the same age. These are simply possibilities; future research will need to examine this topic further.
It is likely that a variety of forms of prejudice affect the well-being of individuals in age-heterogenous partnerships, too. First, social norms around the “appropriate” age gap between partners may result in external prejudice from social contacts and possibly internalized prejudice, both of which may affect relationship quality. Second, gendered double standards about who can pursue a younger partner and express sexual interest—both of which are more socially acceptable for men than for women (Alarie 2019a, 2019b; Hamilton and Armstrong 2009; Montemurro and Siefken 2014; Warren 1996)—likely result in prejudice that affects well-being for those who challenge these norms, particularly women. Third, prejudice related to age (i.e., ageism), particularly as it relates to sex, likely affects the well-being of both older adults and their younger partners. And fourth, interactions of these forms of prejudice—for instance, the gendered double standard as it intersects with ageism and women’s social devaluation as they age (England and McClintock 2009)—may pose particular challenges. In sum, while there are not many differences in relationship well-being and sex life satisfaction between individuals in age-heterogenous and age-homogenous relationships, those that do exist likely stem at least in part from social stigma and prejudice of various kinds.
The LPAs and LCAs highlight several themes that complement those in conventional regression models. First, there are distinct types of individuals in age-heterogenous partnerships on the basis of gender attitudes, relationship well-being, and sex life satisfaction. Second, the classes with the worst scores on a particular measure represented a minority of the sample of men partnered to younger women, women partnered to younger men, and women partnered to older men. Most have high or moderate measures of relationship well-being and sex life satisfaction. Third, the most unhappy men partnered to younger women and women partnered to older men also tend to be conservative on many attitudes about gender practices within the family. Putting these results in conversation with those from the conventional regressions, it appears as though most individuals in age-heterogenous partnerships are not markedly different from their age-homogenous counterparts on most measures and that certain differences on other measures—particularly, sexual ones—are driven by a distinct minority of individuals in a particular relationship type.
The results from this study are intriguing and warrant additional research. More qualitative research is needed on the experiences and perceptions of individuals in age-heterogenous partnerships, as Alarie (2019a, 2019b) has done through interviews with women who have dated or partnered with younger men. Greater attention also needs to be paid to how man-older and woman-older relationships operate and are perceived by others, given that there is much more stigma attached to women who partner with younger men than to men who partner with younger women (Alarie 2019a, 2019b; Warren 1996). Results in this study are also reflective only of older adults in the United States, so more research is needed on individuals in their 30s, 40s, and 50s in age-heterogenous partnerships. Because almost all respondents were in different-sex relationships, larger data sets are also necessary to examine same-sex relationships. Nonetheless, this study offers important insights into older adults’ sexuality and characteristics of different-sex age-heterogenous partnerships at older ages, a largely overlooked topic within sociological research. Individuals in age-heterogenous relationships are similar to their age-concordant counterparts on many gender attitudes and measures of life satisfaction, relationship well-being, and sexual well-being, with some important exceptions.
Footnotes
1
This section discusses research projects about age-heterogenous partnerships and identifies the data sets used within that research but does not cite the data sets themselves because it focuses only on the research that used them.
2
Only 19 were in same-sex relationships, making them unfeasible to analyze.
3
The National Social Life, Health, and Aging Project has a partner history data supplement file, but its wave 3 file was not available to researchers at the time of this research.
4
This measure could not be measured via ordered logit for men because it violated the proportional odds assumption for men (but not women), so I dichotomized this measure such that 0 to 3 = 0 and 4 to 7 = 1 (for men only).
5
This measure could not be measured via ordered logit for women because it violated the proportional odds assumption for women (not men), so I dichotomized this measure into extremely pleasurable and not for women.
6
This measure could not be measured via ordered logit for men (not women) because it violated the proportional odds assumption for men, so I dichotomized this measure into never versus sometimes or more for men.
7
This measure could not be measured via ordered logit (for men or women) because it violated the proportional odds assumption, so I dichotomized this measure into never or once per month or less versus more frequently.
8
The omodel command in Stata determined whether assumptions were violated.
9
Generally latent class analyses include one or more categorical variables whereas latent profile analyses do not, but they are similar analyses.